|
|
市場調査レポート
商品コード
1788475
個別化医療における生成AIの世界市場、2025~2029年Global Generative AI in Personalized Medicine Market 2025-2029 |
||||||

|
|||||||
カスタマイズ可能
|
|||||||

| 個別化医療における生成AIの世界市場、2025~2029年 |
|
出版日: 2025年08月06日
発行: TechNavio
ページ情報: 英文 234 Pages
納期: 即納可能
|

全表示
- 概要
- 図表
- 目次
個別化医療における生成AI市場は2024~2029年に84億5,560万米ドル、予測期間中のCAGRは41.1%で成長すると予測されます。
当レポートでは、個別化医療における生成AI市場の全体的な分析、市場規模・予測、動向、成長促進要因、課題、約25のベンダーを網羅したベンダー分析などを掲載しています。
現在の市場シナリオ、最新動向と促進要因、市場環境全体に関する最新分析を提供しています。市場は、主要な触媒としての医薬品の発見と開発サイクルの加速、主要な市場促進要因としての戦略的コラボレーションと資本流入の強化、そして基礎的な促進要因としてのアクセス可能なマルチモーダルデータと計算能力の拡大によって推進されています。
| 市場範囲 | |
|---|---|
| 基準年 | 2025年 |
| 終了年 | 2029年 |
| 予測期間 | 2025~2029年 |
| 成長モメンタム | 加速 |
| 前年比 | 36.6% |
| CAGR | 41.1% |
| 増分額 | 84億5,560万米ドル |
本調査は、業界の主要参加者からのインプットを含め、一次情報と二次情報を客観的に組み合わせて実施しました。レポートには、主要企業の分析に加え、包括的な市場規模データ、地域別分析によるセグメント、ベンダー情勢が含まれています。レポートには履歴データと予測データがあります。
本調査では、今後数年間の個別化医療における生成AI市場の成長を促進する主な理由の一つとして、生物学的基礎モデルとAIファクトリーの台頭を挙げています。また、疾患の全体像を把握するためのマルチモーダルAIの登場や、インシリコ臨床試験やデジタルツインへのパラダイムシフトは、市場の大きな需要につながります。
目次
第1章 エグゼクティブサマリー
- 市場概要
第2章 Technavio分析
- 価格・ライフサイクル・顧客購入バスケット・採用率・購入基準の分析
- インプットの重要性と差別化の要因
- 混乱の要因
- 促進要因と課題の影響
第3章 市場情勢
- 市場エコシステム
- 市場の特徴
- バリューチェーン分析
第4章 市場規模
- 市場の定義
- 市場セグメント分析
- 市場規模、2024年
- 市場展望、2024~2029年
第5章 ファイブフォース分析
- ファイブフォースの要約
- 買い手の交渉力
- 供給企業の交渉力
- 新規参入業者の脅威
- 代替品の脅威
- 競争の脅威
- 市況
第6章 市場セグメンテーション:用途別
- 市場セグメント
- 比較:用途別
- 創薬:市場規模と予測、2024~2029年
- 病気の診断:市場規模と予測、2024~2029年
- ゲノム解析:市場規模と予測、2024~2029年
- 市場機会:用途別
第7章 市場セグメンテーション:エンドユーザー別
- 市場セグメント
- 比較:エンドユーザー別
- 製薬:市場規模と予測、2024~2029年
- 学術機関:市場規模と予測、2024~2029年
- 病院:市場規模と予測、2024~2029年
- 診断センター:市場規模と予測、2024~2029年
- 市場機会:エンドユーザー別
第8章 市場セグメンテーション:治療領域別
- 市場セグメント
- 比較:治療領域別
- 腫瘍:市場規模と予測、2024~2029年
- 神経:市場規模と予測、2024~2029年
- 心臓病:市場規模と予測、2024~2029年
- 希少疾患:市場規模と予測、2024~2029年
- 感染症:市場規模と予測、2024~2029年
- 市場機会:治療領域別
第9章 顧客情勢
- 顧客情勢の概要
第10章 地域別情勢
- 地域別セグメンテーション
- 地域別比較
- 北米:市場規模と予測、2024~2029年
- 欧州:市場規模と予測、2024~2029年
- アジア太平洋:市場規模と予測、2024~2029年
- 南米:市場規模と予測、2024~2029年
- 中東・アフリカ:市場規模と予測、2024~2029年
- 米国:市場規模と予測、2024~2029年
- ドイツ:市場規模と予測、2024~2029年
- 中国:市場規模と予測、2024~2029年
- 英国:市場規模と予測、2024~2029年
- カナダ:市場規模と予測、2024~2029年
- 日本:市場規模と予測、2024~2029年
- フランス:市場規模と予測、2024~2029年
- イタリア:市場規模と予測、2024~2029年
- スペイン:市場規模と予測、2024~2029年
- 韓国:市場規模と予測、2024~2029年
- 市場機会:地域情勢別
第11章 促進要因・課題・機会・抑制要因
- 市場促進要因
- 市場の課題
- 促進要因と課題の影響
- 市場の機会・抑制要因
第12章 競合情勢
- 概要
- 競合情勢
- 混乱の状況
- 業界のリスク
第13章 競合分析
- 企業プロファイル
- 企業ランキング指数
- 企業の市場ポジショニング
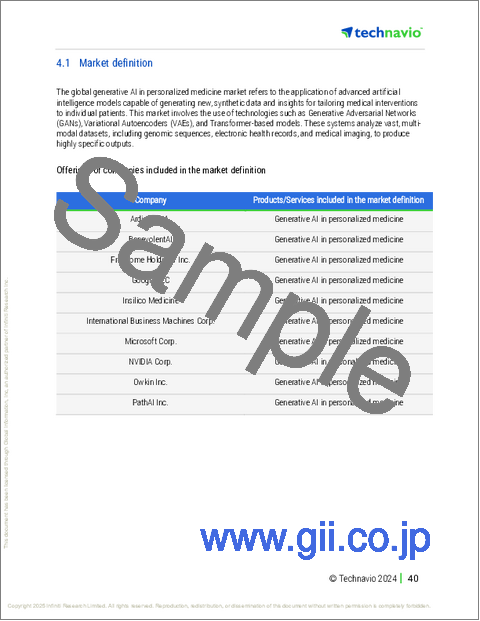
- Ardigen S.A.
- BenevolentAI
- Freenome Holdings Inc.
- Google LLC
- Insilico Medicine
- International Business Machines Corp.
- Microsoft Corp.
- NVIDIA Corp.
- Owkin Inc.
- PathAI Inc.
- Qure.ai Technologies Pvt. Ltd.
- Shenzhen Jingtai Technology Co. Ltd.
- Syntekabio Inc.
- Tempus Labs Inc.
- TurinTech AI Inc.
第14章 付録
Exhibits:
- Exhibits1: Executive Summary - Chart on Market Overview
- Exhibits2: Executive Summary - Data Table on Market Overview
- Exhibits3: Executive Summary - Chart on Global Market Characteristics
- Exhibits4: Executive Summary - Chart on Market By Geographical Landscape
- Exhibits5: Executive Summary - Chart on Market Segmentation by Application
- Exhibits6: Executive Summary - Chart on Market Segmentation by End-user
- Exhibits7: Executive Summary - Chart on Market Segmentation by Therapeutic Area
- Exhibits8: Executive Summary - Chart on Incremental Growth
- Exhibits9: Executive Summary - Data Table on Incremental Growth
- Exhibits10: Executive Summary - Chart on Company Market Positioning
- Exhibits11: Analysis of price sensitivity, lifecycle, customer purchase basket, adoption rates, and purchase criteria
- Exhibits12: Overview on criticality of inputs and factors of differentiation
- Exhibits13: Overview on factors of disruption
- Exhibits14: Impact of drivers and challenges in 2024 and 2029
- Exhibits15: Parent Market
- Exhibits16: Data Table on - Parent Market
- Exhibits17: Market characteristics analysis
- Exhibits18: Value chain analysis
- Exhibits19: Offerings of companies included in the market definition
- Exhibits20: Market segments
- Exhibits21: Chart on Global - Market size and forecast 2024-2029 ($ million)
- Exhibits22: Data Table on Global - Market size and forecast 2024-2029 ($ million)
- Exhibits23: Chart on Global Market: Year-over-year growth 2024-2029 (%)
- Exhibits24: Data Table on Global Market: Year-over-year growth 2024-2029 (%)
- Exhibits25: Five forces analysis - Comparison between 2024 and 2029
- Exhibits26: Bargaining power of buyers - Impact of key factors 2024 and 2029
- Exhibits27: Bargaining power of suppliers - Impact of key factors in 2024 and 2029
- Exhibits28: Threat of new entrants - Impact of key factors in 2024 and 2029
- Exhibits29: Threat of substitutes - Impact of key factors in 2024 and 2029
- Exhibits30: Threat of rivalry - Impact of key factors in 2024 and 2029
- Exhibits31: Chart on Market condition - Five forces 2024 and 2029
- Exhibits32: Chart on Application - Market share 2024-2029 (%)
- Exhibits33: Data Table on Application - Market share 2024-2029 (%)
- Exhibits34: Chart on Comparison by Application
- Exhibits35: Data Table on Comparison by Application
- Exhibits36: Chart on Drug discovery - Market size and forecast 2024-2029 ($ million)
- Exhibits37: Data Table on Drug discovery - Market size and forecast 2024-2029 ($ million)
- Exhibits38: Chart on Drug discovery - Year-over-year growth 2024-2029 (%)
- Exhibits39: Data Table on Drug discovery - Year-over-year growth 2024-2029 (%)
- Exhibits40: Chart on Disease diagnosis - Market size and forecast 2024-2029 ($ million)
- Exhibits41: Data Table on Disease diagnosis - Market size and forecast 2024-2029 ($ million)
- Exhibits42: Chart on Disease diagnosis - Year-over-year growth 2024-2029 (%)
- Exhibits43: Data Table on Disease diagnosis - Year-over-year growth 2024-2029 (%)
- Exhibits44: Chart on Genomic analysis - Market size and forecast 2024-2029 ($ million)
- Exhibits45: Data Table on Genomic analysis - Market size and forecast 2024-2029 ($ million)
- Exhibits46: Chart on Genomic analysis - Year-over-year growth 2024-2029 (%)
- Exhibits47: Data Table on Genomic analysis - Year-over-year growth 2024-2029 (%)
- Exhibits48: Market opportunity by Application ($ million)
- Exhibits49: Data Table on Market opportunity by Application ($ million)
- Exhibits50: Chart on End-user - Market share 2024-2029 (%)
- Exhibits51: Data Table on End-user - Market share 2024-2029 (%)
- Exhibits52: Chart on Comparison by End-user
- Exhibits53: Data Table on Comparison by End-user
- Exhibits54: Chart on Pharmaceutical - Market size and forecast 2024-2029 ($ million)
- Exhibits55: Data Table on Pharmaceutical - Market size and forecast 2024-2029 ($ million)
- Exhibits56: Chart on Pharmaceutical - Year-over-year growth 2024-2029 (%)
- Exhibits57: Data Table on Pharmaceutical - Year-over-year growth 2024-2029 (%)
- Exhibits58: Chart on Academic institutes - Market size and forecast 2024-2029 ($ million)
- Exhibits59: Data Table on Academic institutes - Market size and forecast 2024-2029 ($ million)
- Exhibits60: Chart on Academic institutes - Year-over-year growth 2024-2029 (%)
- Exhibits61: Data Table on Academic institutes - Year-over-year growth 2024-2029 (%)
- Exhibits62: Chart on Hospitals - Market size and forecast 2024-2029 ($ million)
- Exhibits63: Data Table on Hospitals - Market size and forecast 2024-2029 ($ million)
- Exhibits64: Chart on Hospitals - Year-over-year growth 2024-2029 (%)
- Exhibits65: Data Table on Hospitals - Year-over-year growth 2024-2029 (%)
- Exhibits66: Chart on Diagnostic centers - Market size and forecast 2024-2029 ($ million)
- Exhibits67: Data Table on Diagnostic centers - Market size and forecast 2024-2029 ($ million)
- Exhibits68: Chart on Diagnostic centers - Year-over-year growth 2024-2029 (%)
- Exhibits69: Data Table on Diagnostic centers - Year-over-year growth 2024-2029 (%)
- Exhibits70: Market opportunity by End-user ($ million)
- Exhibits71: Data Table on Market opportunity by End-user ($ million)
- Exhibits72: Chart on Therapeutic Area - Market share 2024-2029 (%)
- Exhibits73: Data Table on Therapeutic Area - Market share 2024-2029 (%)
- Exhibits74: Chart on Comparison by Therapeutic Area
- Exhibits75: Data Table on Comparison by Therapeutic Area
- Exhibits76: Chart on Oncology - Market size and forecast 2024-2029 ($ million)
- Exhibits77: Data Table on Oncology - Market size and forecast 2024-2029 ($ million)
- Exhibits78: Chart on Oncology - Year-over-year growth 2024-2029 (%)
- Exhibits79: Data Table on Oncology - Year-over-year growth 2024-2029 (%)
- Exhibits80: Chart on Neurology - Market size and forecast 2024-2029 ($ million)
- Exhibits81: Data Table on Neurology - Market size and forecast 2024-2029 ($ million)
- Exhibits82: Chart on Neurology - Year-over-year growth 2024-2029 (%)
- Exhibits83: Data Table on Neurology - Year-over-year growth 2024-2029 (%)
- Exhibits84: Chart on Cardiology - Market size and forecast 2024-2029 ($ million)
- Exhibits85: Data Table on Cardiology - Market size and forecast 2024-2029 ($ million)
- Exhibits86: Chart on Cardiology - Year-over-year growth 2024-2029 (%)
- Exhibits87: Data Table on Cardiology - Year-over-year growth 2024-2029 (%)
- Exhibits88: Chart on Rare diseases - Market size and forecast 2024-2029 ($ million)
- Exhibits89: Data Table on Rare diseases - Market size and forecast 2024-2029 ($ million)
- Exhibits90: Chart on Rare diseases - Year-over-year growth 2024-2029 (%)
- Exhibits91: Data Table on Rare diseases - Year-over-year growth 2024-2029 (%)
- Exhibits92: Chart on Infectious diseases - Market size and forecast 2024-2029 ($ million)
- Exhibits93: Data Table on Infectious diseases - Market size and forecast 2024-2029 ($ million)
- Exhibits94: Chart on Infectious diseases - Year-over-year growth 2024-2029 (%)
- Exhibits95: Data Table on Infectious diseases - Year-over-year growth 2024-2029 (%)
- Exhibits96: Market opportunity by Therapeutic Area ($ million)
- Exhibits97: Data Table on Market opportunity by Therapeutic Area ($ million)
- Exhibits98: Analysis of price sensitivity, lifecycle, customer purchase basket, adoption rates, and purchase criteria
- Exhibits99: Chart on Market share By Geographical Landscape 2024-2029 (%)
- Exhibits100: Data Table on Market share By Geographical Landscape 2024-2029 (%)
- Exhibits101: Chart on Geographic comparison
- Exhibits102: Data Table on Geographic comparison
- Exhibits103: Chart on North America - Market size and forecast 2024-2029 ($ million)
- Exhibits104: Data Table on North America - Market size and forecast 2024-2029 ($ million)
- Exhibits105: Chart on North America - Year-over-year growth 2024-2029 (%)
- Exhibits106: Data Table on North America - Year-over-year growth 2024-2029 (%)
- Exhibits107: Chart on Europe - Market size and forecast 2024-2029 ($ million)
- Exhibits108: Data Table on Europe - Market size and forecast 2024-2029 ($ million)
- Exhibits109: Chart on Europe - Year-over-year growth 2024-2029 (%)
- Exhibits110: Data Table on Europe - Year-over-year growth 2024-2029 (%)
- Exhibits111: Chart on APAC - Market size and forecast 2024-2029 ($ million)
- Exhibits112: Data Table on APAC - Market size and forecast 2024-2029 ($ million)
- Exhibits113: Chart on APAC - Year-over-year growth 2024-2029 (%)
- Exhibits114: Data Table on APAC - Year-over-year growth 2024-2029 (%)
- Exhibits115: Chart on South America - Market size and forecast 2024-2029 ($ million)
- Exhibits116: Data Table on South America - Market size and forecast 2024-2029 ($ million)
- Exhibits117: Chart on South America - Year-over-year growth 2024-2029 (%)
- Exhibits118: Data Table on South America - Year-over-year growth 2024-2029 (%)
- Exhibits119: Chart on Middle East and Africa - Market size and forecast 2024-2029 ($ million)
- Exhibits120: Data Table on Middle East and Africa - Market size and forecast 2024-2029 ($ million)
- Exhibits121: Chart on Middle East and Africa - Year-over-year growth 2024-2029 (%)
- Exhibits122: Data Table on Middle East and Africa - Year-over-year growth 2024-2029 (%)
- Exhibits123: Chart on US - Market size and forecast 2024-2029 ($ million)
- Exhibits124: Data Table on US - Market size and forecast 2024-2029 ($ million)
- Exhibits125: Chart on US - Year-over-year growth 2024-2029 (%)
- Exhibits126: Data Table on US - Year-over-year growth 2024-2029 (%)
- Exhibits127: Chart on Germany - Market size and forecast 2024-2029 ($ million)
- Exhibits128: Data Table on Germany - Market size and forecast 2024-2029 ($ million)
- Exhibits129: Chart on Germany - Year-over-year growth 2024-2029 (%)
- Exhibits130: Data Table on Germany - Year-over-year growth 2024-2029 (%)
- Exhibits131: Chart on China - Market size and forecast 2024-2029 ($ million)
- Exhibits132: Data Table on China - Market size and forecast 2024-2029 ($ million)
- Exhibits133: Chart on China - Year-over-year growth 2024-2029 (%)
- Exhibits134: Data Table on China - Year-over-year growth 2024-2029 (%)
- Exhibits135: Chart on UK - Market size and forecast 2024-2029 ($ million)
- Exhibits136: Data Table on UK - Market size and forecast 2024-2029 ($ million)
- Exhibits137: Chart on UK - Year-over-year growth 2024-2029 (%)
- Exhibits138: Data Table on UK - Year-over-year growth 2024-2029 (%)
- Exhibits139: Chart on Canada - Market size and forecast 2024-2029 ($ million)
- Exhibits140: Data Table on Canada - Market size and forecast 2024-2029 ($ million)
- Exhibits141: Chart on Canada - Year-over-year growth 2024-2029 (%)
- Exhibits142: Data Table on Canada - Year-over-year growth 2024-2029 (%)
- Exhibits143: Chart on Japan - Market size and forecast 2024-2029 ($ million)
- Exhibits144: Data Table on Japan - Market size and forecast 2024-2029 ($ million)
- Exhibits145: Chart on Japan - Year-over-year growth 2024-2029 (%)
- Exhibits146: Data Table on Japan - Year-over-year growth 2024-2029 (%)
- Exhibits147: Chart on France - Market size and forecast 2024-2029 ($ million)
- Exhibits148: Data Table on France - Market size and forecast 2024-2029 ($ million)
- Exhibits149: Chart on France - Year-over-year growth 2024-2029 (%)
- Exhibits150: Data Table on France - Year-over-year growth 2024-2029 (%)
- Exhibits151: Chart on Italy - Market size and forecast 2024-2029 ($ million)
- Exhibits152: Data Table on Italy - Market size and forecast 2024-2029 ($ million)
- Exhibits153: Chart on Italy - Year-over-year growth 2024-2029 (%)
- Exhibits154: Data Table on Italy - Year-over-year growth 2024-2029 (%)
- Exhibits155: Chart on Spain - Market size and forecast 2024-2029 ($ million)
- Exhibits156: Data Table on Spain - Market size and forecast 2024-2029 ($ million)
- Exhibits157: Chart on Spain - Year-over-year growth 2024-2029 (%)
- Exhibits158: Data Table on Spain - Year-over-year growth 2024-2029 (%)
- Exhibits159: Chart on South Korea - Market size and forecast 2024-2029 ($ million)
- Exhibits160: Data Table on South Korea - Market size and forecast 2024-2029 ($ million)
- Exhibits161: Chart on South Korea - Year-over-year growth 2024-2029 (%)
- Exhibits162: Data Table on South Korea - Year-over-year growth 2024-2029 (%)
- Exhibits163: Market opportunity By Geographical Landscape ($ million)
- Exhibits164: Data Tables on Market opportunity By Geographical Landscape ($ million)
- Exhibits165: Impact of drivers and challenges in 2024 and 2029
- Exhibits166: Overview on criticality of inputs and factors of differentiation
- Exhibits167: Overview on factors of disruption
- Exhibits168: Impact of key risks on business
- Exhibits169: Companies covered
- Exhibits170: Company ranking index
- Exhibits171: Matrix on companies position and classification
- Exhibits172: Ardigen S.A. - Overview
- Exhibits173: Ardigen S.A. - Product / Service
- Exhibits174: Ardigen S.A. - Key offerings
- Exhibits175: SWOT
- Exhibits176: BenevolentAI - Overview
- Exhibits177: BenevolentAI - Product / Service
- Exhibits178: BenevolentAI - Key offerings
- Exhibits179: SWOT
- Exhibits180: Freenome Holdings Inc. - Overview
- Exhibits181: Freenome Holdings Inc. - Product / Service
- Exhibits182: Freenome Holdings Inc. - Key offerings
- Exhibits183: SWOT
- Exhibits184: Google LLC - Overview
- Exhibits185: Google LLC - Product / Service
- Exhibits186: Google LLC - Key offerings
- Exhibits187: SWOT
- Exhibits188: Insilico Medicine - Overview
- Exhibits189: Insilico Medicine - Product / Service
- Exhibits190: Insilico Medicine - Key offerings
- Exhibits191: SWOT
- Exhibits192: International Business Machines Corp. - Overview
- Exhibits193: International Business Machines Corp. - Business segments
- Exhibits194: International Business Machines Corp. - Key news
- Exhibits195: International Business Machines Corp. - Key offerings
- Exhibits196: International Business Machines Corp. - Segment focus
- Exhibits197: SWOT
- Exhibits198: Microsoft Corp. - Overview
- Exhibits199: Microsoft Corp. - Business segments
- Exhibits200: Microsoft Corp. - Key news
- Exhibits201: Microsoft Corp. - Key offerings
- Exhibits202: Microsoft Corp. - Segment focus
- Exhibits203: SWOT
- Exhibits204: NVIDIA Corp. - Overview
- Exhibits205: NVIDIA Corp. - Business segments
- Exhibits206: NVIDIA Corp. - Key news
- Exhibits207: NVIDIA Corp. - Key offerings
- Exhibits208: NVIDIA Corp. - Segment focus
- Exhibits209: SWOT
- Exhibits210: Owkin Inc. - Overview
- Exhibits211: Owkin Inc. - Product / Service
- Exhibits212: Owkin Inc. - Key offerings
- Exhibits213: SWOT
- Exhibits214: PathAI Inc. - Overview
- Exhibits215: PathAI Inc. - Product / Service
- Exhibits216: PathAI Inc. - Key offerings
- Exhibits217: SWOT
- Exhibits218: Qure.ai Technologies Pvt. Ltd. - Overview
- Exhibits219: Qure.ai Technologies Pvt. Ltd. - Product / Service
- Exhibits220: Qure.ai Technologies Pvt. Ltd. - Key offerings
- Exhibits221: SWOT
- Exhibits222: Shenzhen Jingtai Technology Co. Ltd. - Overview
- Exhibits223: Shenzhen Jingtai Technology Co. Ltd. - Product / Service
- Exhibits224: Shenzhen Jingtai Technology Co. Ltd. - Key offerings
- Exhibits225: SWOT
- Exhibits226: Syntekabio Inc. - Overview
- Exhibits227: Syntekabio Inc. - Product / Service
- Exhibits228: Syntekabio Inc. - Key offerings
- Exhibits229: SWOT
- Exhibits230: Tempus Labs Inc. - Overview
- Exhibits231: Tempus Labs Inc. - Product / Service
- Exhibits232: Tempus Labs Inc. - Key offerings
- Exhibits233: SWOT
- Exhibits234: TurinTech AI Inc. - Overview
- Exhibits235: TurinTech AI Inc. - Product / Service
- Exhibits236: TurinTech AI Inc. - Key offerings
- Exhibits237: SWOT
- Exhibits238: Inclusions checklist
- Exhibits239: Exclusions checklist
- Exhibits240: Currency conversion rates for US$
- Exhibits241: Research methodology
- Exhibits242: Information sources
- Exhibits243: Data validation
- Exhibits244: Validation techniques employed for market sizing
- Exhibits245: Data synthesis
- Exhibits246: 360 degree market analysis
- Exhibits247: List of abbreviations
The generative AI in personalized medicine market is forecasted to grow by USD 8,455.6 mn during 2024-2029, accelerating at a CAGR of 41.1% during the forecast period. The report on the generative AI in personalized medicine market provides a holistic analysis, market size and forecast, trends, growth drivers, and challenges, as well as vendor analysis covering around 25 vendors.
The report offers an up-to-date analysis regarding the current market scenario, the latest trends and drivers, and the overall market environment. The market is driven by accelerated drug discovery and development cycles as a primary catalyst, intensifying strategic collaborations and influx of capital as a key market accelerator, and expansion of accessible multimodal data and computational power as a foundational enabler.
| Market Scope | |
|---|---|
| Base Year | 2025 |
| End Year | 2029 |
| Series Year | 2025-2029 |
| Growth Momentum | Accelerate |
| YOY 2025 | 36.6% |
| CAGR | 41.1% |
| Incremental Value | $8,455.6 mn |
The study was conducted using an objective combination of primary and secondary information including inputs from key participants in the industry. The report contains a comprehensive market size data, segment with regional analysis and vendor landscape in addition to an analysis of the key companies. Reports have historic and forecast data.
Technavio's generative AI in personalized medicine market is segmented as below:
By Application
- Drug discovery
- Disease diagnosis
- Genomic analysis
By End-user
- Pharmaceutical
- Academic institutes
- Hospitals
- Diagnostic centers
By Therapeutic Area
- Oncology
- Neurology
- Cardiology
- Rare diseases
- Infectious diseases
By Geographical Landscape
- North America
- Europe
- APAC
- South America
- Middle East and Africa
This study identifies the rise of biological foundation models and AI factories as one of the prime reasons driving the generative AI in personalized medicine market growth during the next few years. Also, emergence of multimodal AI for a holistic view of disease and paradigm shift toward in-silico clinical trials and digital twins will lead to sizable demand in the market.
The report on the generative AI in personalized medicine market covers the following areas:
- Generative AI In Personalized Medicine Market sizing
- Generative AI In Personalized Medicine Market forecast
- Generative AI In Personalized Medicine Market industry analysis
The robust vendor analysis is designed to help clients improve their market position, and in line with this, this report provides a detailed analysis of several leading generative AI in personalized medicine market vendors that include Ardigen S.A., BenevolentAI, Freenome Holdings Inc., Google LLC, Insilico Medicine, International Business Machines Corp., Mediwhale Inc., Microsoft Corp., NVIDIA Corp., Owkin Inc., PathAI Inc., Qure.ai Technologies Pvt. Ltd., Shenzhen Jingtai Technology Co. Ltd., Syntekabio Inc., Tempus Labs Inc., and TurinTech AI Inc.. Also, the generative AI in personalized medicine market analysis report includes information on upcoming trends and challenges that will influence market growth. This is to help companies strategize and leverage all forthcoming growth opportunities.
The publisher presents a detailed picture of the market by the way of study, synthesis, and summation of data from multiple sources by an analysis of key parameters such as profit, pricing, competition, and promotions. It presents various market facets by identifying the key industry influencers. The data presented is comprehensive, reliable, and a result of extensive primary and secondary research. The market research reports provide a complete competitive landscape and an in-depth vendor selection methodology and analysis using qualitative and quantitative research to forecast accurate market growth.
Table of Contents
1 Executive Summary
- 1.1 Market overview
- Executive Summary - Chart on Market Overview
- Executive Summary - Data Table on Market Overview
- Executive Summary - Chart on Global Market Characteristics
- Executive Summary - Chart on Market By Geographical Landscape
- Executive Summary - Chart on Market Segmentation by Application
- Executive Summary - Chart on Market Segmentation by End-user
- Executive Summary - Chart on Market Segmentation by Therapeutic Area
- Executive Summary - Chart on Incremental Growth
- Executive Summary - Data Table on Incremental Growth
- Executive Summary - Chart on Company Market Positioning
2 Technavio Analysis
- 2.1 Analysis of price sensitivity, lifecycle, customer purchase basket, adoption rates, and purchase criteria
- Analysis of price sensitivity, lifecycle, customer purchase basket, adoption rates, and purchase criteria
- 2.2 Criticality of inputs and Factors of differentiation
- Overview on criticality of inputs and factors of differentiation
- 2.3 Factors of disruption
- Overview on factors of disruption
- 2.4 Impact of drivers and challenges
- Impact of drivers and challenges in 2024 and 2029
3 Market Landscape
- 3.1 Market ecosystem
- Parent Market
- Data Table on - Parent Market
- 3.2 Market characteristics
- Market characteristics analysis
- 3.3 Value chain analysis
- Value chain analysis
4 Market Sizing
- 4.1 Market definition
- Offerings of companies included in the market definition
- 4.2 Market segment analysis
- Market segments
- 4.3 Market size 2024
- 4.4 Market outlook: Forecast for 2024-2029
- Chart on Global - Market size and forecast 2024-2029 ($ million)
- Data Table on Global - Market size and forecast 2024-2029 ($ million)
- Chart on Global Market: Year-over-year growth 2024-2029 (%)
- Data Table on Global Market: Year-over-year growth 2024-2029 (%)
5 Five Forces Analysis
- 5.1 Five forces summary
- Five forces analysis - Comparison between 2024 and 2029
- 5.2 Bargaining power of buyers
- Bargaining power of buyers - Impact of key factors 2024 and 2029
- 5.3 Bargaining power of suppliers
- Bargaining power of suppliers - Impact of key factors in 2024 and 2029
- 5.4 Threat of new entrants
- Threat of new entrants - Impact of key factors in 2024 and 2029
- 5.5 Threat of substitutes
- Threat of substitutes - Impact of key factors in 2024 and 2029
- 5.6 Threat of rivalry
- Threat of rivalry - Impact of key factors in 2024 and 2029
- 5.7 Market condition
- Chart on Market condition - Five forces 2024 and 2029
6 Market Segmentation by Application
- 6.1 Market segments
- Chart on Application - Market share 2024-2029 (%)
- Data Table on Application - Market share 2024-2029 (%)
- 6.2 Comparison by Application
- Chart on Comparison by Application
- Data Table on Comparison by Application
- 6.3 Drug discovery - Market size and forecast 2024-2029
- Chart on Drug discovery - Market size and forecast 2024-2029 ($ million)
- Data Table on Drug discovery - Market size and forecast 2024-2029 ($ million)
- Chart on Drug discovery - Year-over-year growth 2024-2029 (%)
- Data Table on Drug discovery - Year-over-year growth 2024-2029 (%)
- 6.4 Disease diagnosis - Market size and forecast 2024-2029
- Chart on Disease diagnosis - Market size and forecast 2024-2029 ($ million)
- Data Table on Disease diagnosis - Market size and forecast 2024-2029 ($ million)
- Chart on Disease diagnosis - Year-over-year growth 2024-2029 (%)
- Data Table on Disease diagnosis - Year-over-year growth 2024-2029 (%)
- 6.5 Genomic analysis - Market size and forecast 2024-2029
- Chart on Genomic analysis - Market size and forecast 2024-2029 ($ million)
- Data Table on Genomic analysis - Market size and forecast 2024-2029 ($ million)
- Chart on Genomic analysis - Year-over-year growth 2024-2029 (%)
- Data Table on Genomic analysis - Year-over-year growth 2024-2029 (%)
- 6.6 Market opportunity by Application
- Market opportunity by Application ($ million)
- Data Table on Market opportunity by Application ($ million)
7 Market Segmentation by End-user
- 7.1 Market segments
- Chart on End-user - Market share 2024-2029 (%)
- Data Table on End-user - Market share 2024-2029 (%)
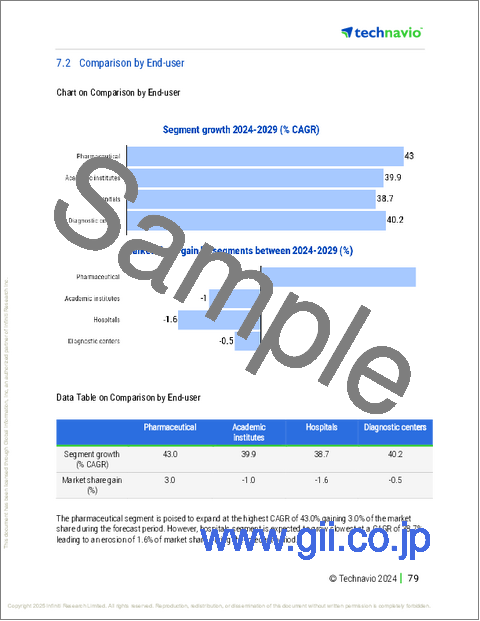
- 7.2 Comparison by End-user
- Chart on Comparison by End-user
- Data Table on Comparison by End-user
- 7.3 Pharmaceutical - Market size and forecast 2024-2029
- Chart on Pharmaceutical - Market size and forecast 2024-2029 ($ million)
- Data Table on Pharmaceutical - Market size and forecast 2024-2029 ($ million)
- Chart on Pharmaceutical - Year-over-year growth 2024-2029 (%)
- Data Table on Pharmaceutical - Year-over-year growth 2024-2029 (%)
- 7.4 Academic institutes - Market size and forecast 2024-2029
- Chart on Academic institutes - Market size and forecast 2024-2029 ($ million)
- Data Table on Academic institutes - Market size and forecast 2024-2029 ($ million)
- Chart on Academic institutes - Year-over-year growth 2024-2029 (%)
- Data Table on Academic institutes - Year-over-year growth 2024-2029 (%)
- 7.5 Hospitals - Market size and forecast 2024-2029
- Chart on Hospitals - Market size and forecast 2024-2029 ($ million)
- Data Table on Hospitals - Market size and forecast 2024-2029 ($ million)
- Chart on Hospitals - Year-over-year growth 2024-2029 (%)
- Data Table on Hospitals - Year-over-year growth 2024-2029 (%)
- 7.6 Diagnostic centers - Market size and forecast 2024-2029
- Chart on Diagnostic centers - Market size and forecast 2024-2029 ($ million)
- Data Table on Diagnostic centers - Market size and forecast 2024-2029 ($ million)
- Chart on Diagnostic centers - Year-over-year growth 2024-2029 (%)
- Data Table on Diagnostic centers - Year-over-year growth 2024-2029 (%)
- 7.7 Market opportunity by End-user
- Market opportunity by End-user ($ million)
- Data Table on Market opportunity by End-user ($ million)
8 Market Segmentation by Therapeutic Area
- 8.1 Market segments
- Chart on Therapeutic Area - Market share 2024-2029 (%)
- Data Table on Therapeutic Area - Market share 2024-2029 (%)
- 8.2 Comparison by Therapeutic Area
- Chart on Comparison by Therapeutic Area
- Data Table on Comparison by Therapeutic Area
- 8.3 Oncology - Market size and forecast 2024-2029
- Chart on Oncology - Market size and forecast 2024-2029 ($ million)
- Data Table on Oncology - Market size and forecast 2024-2029 ($ million)
- Chart on Oncology - Year-over-year growth 2024-2029 (%)
- Data Table on Oncology - Year-over-year growth 2024-2029 (%)
- 8.4 Neurology - Market size and forecast 2024-2029
- Chart on Neurology - Market size and forecast 2024-2029 ($ million)
- Data Table on Neurology - Market size and forecast 2024-2029 ($ million)
- Chart on Neurology - Year-over-year growth 2024-2029 (%)
- Data Table on Neurology - Year-over-year growth 2024-2029 (%)
- 8.5 Cardiology - Market size and forecast 2024-2029
- Chart on Cardiology - Market size and forecast 2024-2029 ($ million)
- Data Table on Cardiology - Market size and forecast 2024-2029 ($ million)
- Chart on Cardiology - Year-over-year growth 2024-2029 (%)
- Data Table on Cardiology - Year-over-year growth 2024-2029 (%)
- 8.6 Rare diseases - Market size and forecast 2024-2029
- Chart on Rare diseases - Market size and forecast 2024-2029 ($ million)
- Data Table on Rare diseases - Market size and forecast 2024-2029 ($ million)
- Chart on Rare diseases - Year-over-year growth 2024-2029 (%)
- Data Table on Rare diseases - Year-over-year growth 2024-2029 (%)
- 8.7 Infectious diseases - Market size and forecast 2024-2029
- Chart on Infectious diseases - Market size and forecast 2024-2029 ($ million)
- Data Table on Infectious diseases - Market size and forecast 2024-2029 ($ million)
- Chart on Infectious diseases - Year-over-year growth 2024-2029 (%)
- Data Table on Infectious diseases - Year-over-year growth 2024-2029 (%)
- 8.8 Market opportunity by Therapeutic Area
- Market opportunity by Therapeutic Area ($ million)
- Data Table on Market opportunity by Therapeutic Area ($ million)
9 Customer Landscape
- 9.1 Customer landscape overview
- Analysis of price sensitivity, lifecycle, customer purchase basket, adoption rates, and purchase criteria
10 Geographic Landscape
- 10.1 Geographic segmentation
- Chart on Market share By Geographical Landscape 2024-2029 (%)
- Data Table on Market share By Geographical Landscape 2024-2029 (%)
- 10.2 Geographic comparison
- Chart on Geographic comparison
- Data Table on Geographic comparison
- 10.3 North America - Market size and forecast 2024-2029
- Chart on North America - Market size and forecast 2024-2029 ($ million)
- Data Table on North America - Market size and forecast 2024-2029 ($ million)
- Chart on North America - Year-over-year growth 2024-2029 (%)
- Data Table on North America - Year-over-year growth 2024-2029 (%)
- 10.4 Europe - Market size and forecast 2024-2029
- Chart on Europe - Market size and forecast 2024-2029 ($ million)
- Data Table on Europe - Market size and forecast 2024-2029 ($ million)
- Chart on Europe - Year-over-year growth 2024-2029 (%)
- Data Table on Europe - Year-over-year growth 2024-2029 (%)
- 10.5 APAC - Market size and forecast 2024-2029
- Chart on APAC - Market size and forecast 2024-2029 ($ million)
- Data Table on APAC - Market size and forecast 2024-2029 ($ million)
- Chart on APAC - Year-over-year growth 2024-2029 (%)
- Data Table on APAC - Year-over-year growth 2024-2029 (%)
- 10.6 South America - Market size and forecast 2024-2029
- Chart on South America - Market size and forecast 2024-2029 ($ million)
- Data Table on South America - Market size and forecast 2024-2029 ($ million)
- Chart on South America - Year-over-year growth 2024-2029 (%)
- Data Table on South America - Year-over-year growth 2024-2029 (%)
- 10.7 Middle East and Africa - Market size and forecast 2024-2029
- Chart on Middle East and Africa - Market size and forecast 2024-2029 ($ million)
- Data Table on Middle East and Africa - Market size and forecast 2024-2029 ($ million)
- Chart on Middle East and Africa - Year-over-year growth 2024-2029 (%)
- Data Table on Middle East and Africa - Year-over-year growth 2024-2029 (%)
- 10.8 US - Market size and forecast 2024-2029
- Chart on US - Market size and forecast 2024-2029 ($ million)
- Data Table on US - Market size and forecast 2024-2029 ($ million)
- Chart on US - Year-over-year growth 2024-2029 (%)
- Data Table on US - Year-over-year growth 2024-2029 (%)
- 10.9 Germany - Market size and forecast 2024-2029
- Chart on Germany - Market size and forecast 2024-2029 ($ million)
- Data Table on Germany - Market size and forecast 2024-2029 ($ million)
- Chart on Germany - Year-over-year growth 2024-2029 (%)
- Data Table on Germany - Year-over-year growth 2024-2029 (%)
- 10.10 China - Market size and forecast 2024-2029
- Chart on China - Market size and forecast 2024-2029 ($ million)
- Data Table on China - Market size and forecast 2024-2029 ($ million)
- Chart on China - Year-over-year growth 2024-2029 (%)
- Data Table on China - Year-over-year growth 2024-2029 (%)
- 10.11 UK - Market size and forecast 2024-2029
- Chart on UK - Market size and forecast 2024-2029 ($ million)
- Data Table on UK - Market size and forecast 2024-2029 ($ million)
- Chart on UK - Year-over-year growth 2024-2029 (%)
- Data Table on UK - Year-over-year growth 2024-2029 (%)
- 10.12 Canada - Market size and forecast 2024-2029
- Chart on Canada - Market size and forecast 2024-2029 ($ million)
- Data Table on Canada - Market size and forecast 2024-2029 ($ million)
- Chart on Canada - Year-over-year growth 2024-2029 (%)
- Data Table on Canada - Year-over-year growth 2024-2029 (%)
- 10.13 Japan - Market size and forecast 2024-2029
- Chart on Japan - Market size and forecast 2024-2029 ($ million)
- Data Table on Japan - Market size and forecast 2024-2029 ($ million)
- Chart on Japan - Year-over-year growth 2024-2029 (%)
- Data Table on Japan - Year-over-year growth 2024-2029 (%)
- 10.14 France - Market size and forecast 2024-2029
- Chart on France - Market size and forecast 2024-2029 ($ million)
- Data Table on France - Market size and forecast 2024-2029 ($ million)
- Chart on France - Year-over-year growth 2024-2029 (%)
- Data Table on France - Year-over-year growth 2024-2029 (%)
- 10.15 Italy - Market size and forecast 2024-2029
- Chart on Italy - Market size and forecast 2024-2029 ($ million)
- Data Table on Italy - Market size and forecast 2024-2029 ($ million)
- Chart on Italy - Year-over-year growth 2024-2029 (%)
- Data Table on Italy - Year-over-year growth 2024-2029 (%)
- 10.16 Spain - Market size and forecast 2024-2029
- Chart on Spain - Market size and forecast 2024-2029 ($ million)
- Data Table on Spain - Market size and forecast 2024-2029 ($ million)
- Chart on Spain - Year-over-year growth 2024-2029 (%)
- Data Table on Spain - Year-over-year growth 2024-2029 (%)
- 10.17 South Korea - Market size and forecast 2024-2029
- Chart on South Korea - Market size and forecast 2024-2029 ($ million)
- Data Table on South Korea - Market size and forecast 2024-2029 ($ million)
- Chart on South Korea - Year-over-year growth 2024-2029 (%)
- Data Table on South Korea - Year-over-year growth 2024-2029 (%)
- 10.18 Market opportunity By Geographical Landscape
- Market opportunity By Geographical Landscape ($ million)
- Data Tables on Market opportunity By Geographical Landscape ($ million)
11 Drivers, Challenges, and Opportunity/Restraints
- 11.1 Market drivers
- 11.2 Market challenges
- 11.3 Impact of drivers and challenges
- Impact of drivers and challenges in 2024 and 2029
- 11.4 Market opportunities/restraints
12 Competitive Landscape
- 12.1 Overview
- 12.2 Competitive Landscape
- Overview on criticality of inputs and factors of differentiation
- 12.3 Landscape disruption
- Overview on factors of disruption
- 12.4 Industry risks
- Impact of key risks on business
13 Competitive Analysis
- 13.1 Companies profiled
- Companies covered
- 13.2 Company ranking index
- Company ranking index
- 13.3 Market positioning of companies
- Matrix on companies position and classification
- 13.4 Ardigen S.A.
- Ardigen S.A. - Overview
- Ardigen S.A. - Product / Service
- Ardigen S.A. - Key offerings
- SWOT
- 13.5 BenevolentAI
- BenevolentAI - Overview
- BenevolentAI - Product / Service
- BenevolentAI - Key offerings
- SWOT
- 13.6 Freenome Holdings Inc.
- Freenome Holdings Inc. - Overview
- Freenome Holdings Inc. - Product / Service
- Freenome Holdings Inc. - Key offerings
- SWOT
- 13.7 Google LLC
- Google LLC - Overview
- Google LLC - Product / Service
- Google LLC - Key offerings
- SWOT
- 13.8 Insilico Medicine
- Insilico Medicine - Overview
- Insilico Medicine - Product / Service
- Insilico Medicine - Key offerings
- SWOT
- 13.9 International Business Machines Corp.
- International Business Machines Corp. - Overview
- International Business Machines Corp. - Business segments
- International Business Machines Corp. - Key news
- International Business Machines Corp. - Key offerings
- International Business Machines Corp. - Segment focus
- SWOT
- 13.10 Microsoft Corp.
- Microsoft Corp. - Overview
- Microsoft Corp. - Business segments
- Microsoft Corp. - Key news
- Microsoft Corp. - Key offerings
- Microsoft Corp. - Segment focus
- SWOT
- 13.11 NVIDIA Corp.
- NVIDIA Corp. - Overview
- NVIDIA Corp. - Business segments
- NVIDIA Corp. - Key news
- NVIDIA Corp. - Key offerings
- NVIDIA Corp. - Segment focus
- SWOT
- 13.12 Owkin Inc.
- Owkin Inc. - Overview
- Owkin Inc. - Product / Service
- Owkin Inc. - Key offerings
- SWOT
- 13.13 PathAI Inc.
- PathAI Inc. - Overview
- PathAI Inc. - Product / Service
- PathAI Inc. - Key offerings
- SWOT
- 13.14 Qure.ai Technologies Pvt. Ltd.
- Qure.ai Technologies Pvt. Ltd. - Overview
- Qure.ai Technologies Pvt. Ltd. - Product / Service
- Qure.ai Technologies Pvt. Ltd. - Key offerings
- SWOT
- 13.15 Shenzhen Jingtai Technology Co. Ltd.
- Shenzhen Jingtai Technology Co. Ltd. - Overview
- Shenzhen Jingtai Technology Co. Ltd. - Product / Service
- Shenzhen Jingtai Technology Co. Ltd. - Key offerings
- SWOT
- 13.16 Syntekabio Inc.
- Syntekabio Inc. - Overview
- Syntekabio Inc. - Product / Service
- Syntekabio Inc. - Key offerings
- SWOT
- 13.17 Tempus Labs Inc.
- Tempus Labs Inc. - Overview
- Tempus Labs Inc. - Product / Service
- Tempus Labs Inc. - Key offerings
- SWOT
- 13.18 TurinTech AI Inc.
- TurinTech AI Inc. - Overview
- TurinTech AI Inc. - Product / Service
- TurinTech AI Inc. - Key offerings
- SWOT
14 Appendix
- 14.1 Scope of the report
- 14.2 Inclusions and exclusions checklist
- Inclusions checklist
- Exclusions checklist
- 14.3 Currency conversion rates for US$
- Currency conversion rates for US$
- 14.4 Research methodology
- Research methodology
- 14.5 Data procurement
- Information sources
- 14.6 Data validation
- Data validation
- 14.7 Validation techniques employed for market sizing
- Validation techniques employed for market sizing
- 14.8 Data synthesis
- Data synthesis
- 14.9 360 degree market analysis
- 360 degree market analysis
- 14.10 List of abbreviations
- List of abbreviations
