|
|
市場調査レポート
商品コード
1769527
エッジデバイス向けAIハードウェアの世界市場 2025年~2029年Global AI Hardware for Edge Devices Market 2025-2029 |
||||||

|
|||||||
カスタマイズ可能
|
|||||||

| エッジデバイス向けAIハードウェアの世界市場 2025年~2029年 |
|
出版日: 2025年07月04日
発行: TechNavio
ページ情報: 英文 278 Pages
納期: 即納可能
|

全表示
- 概要
- 図表
- 目次
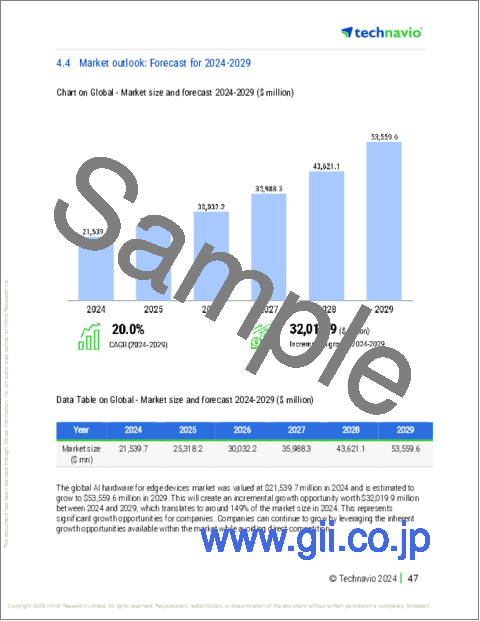
エッジデバイス向けAIハードウェア市場は、2024年から2029年にかけて320億1,990万米ドル、予測期間中のCAGRは20%と予測されています。
当レポートでは、エッジデバイス向けAIハードウェア市場の全体的な分析、市場規模・予測、動向、成長促進要因、課題、約25のベンダーを網羅したベンダー分析などを掲載しています。
現在の市場シナリオ、最新動向と促進要因、市場環境全体に関する最新分析を提供しています。市場は、低レイテンシーとリアルタイム処理の重要な必要性、データプライバシー、セキュリティ、運用の回復力に対する懸念の高まり、iotの普及とオンデバイス生成AIの出現の共生によって牽引されています。
| 市場範囲 | |
|---|---|
| 基準年 | 2025年 |
| 終了年 | 2029年 |
| 予測期間 | 2025年~2029年 |
| 成長モメンタム | 加速 |
| 前年比 | 17.5% |
| CAGR | 20% |
| 増分額 | 320億1,990万米ドル |
本調査は、業界の主要参加者からのインプットを含め、一次情報と二次情報を客観的に組み合わせて実施しました。レポートには、主要企業の分析に加え、包括的な市場規模データ、地域別分析によるセグメント、ベンダー情勢が含まれています。レポートには過去データと予測データがあります。
本調査では、今後数年間におけるエッジデバイス向けAIハードウェア市場の成長を促進する主要な理由の1つとして、基幹技術としてのオンデバイスジェネレーティブAIの出現を挙げています。また、ドメイン特化型アーキテクチャやアプリケーション特化型アーキテクチャの普及、ヘテロジニアスコンピューティングやインテリジェントワークロードオーケストレーションの台頭は、市場の大きな需要につながります。
目次
第1章 エグゼクティブサマリー
- 市場概要
第2章 Technavio分析
- 価格・ライフサイクル・顧客購入バスケット・採用率・購入基準の分析
- インプットの重要性と差別化の要因
- 混乱の要因
- 促進要因と課題の影響
第3章 市場情勢
- 市場エコシステム
- 市場の特徴
- バリューチェーン分析
第4章 市場規模
- 市場の定義
- 市場セグメント分析
- 市場規模 2024年
- 市場の見通し 2024年~2029年
第5章 市場規模実績
- エッジデバイス向けAIハードウェアの世界市場 2019年~2023年
- デバイス別セグメント分析 2019年~2023年
- プロセッサタイプ別セグメント分析 2019年~2023年
- 出力定格別セグメント分析 2019年~2023年
- 産業用途別セグメント分析 2019年~2023年
- 地域別セグメント分析 2019年~2023年
- 国別セグメント分析 2019年~2023年
第6章 ファイブフォース分析
- ファイブフォースの要約
- 買い手の交渉力
- 供給企業の交渉力
- 新規参入業者の脅威
- 代替品の脅威
- 競争の脅威
- 市況
第7章 市場セグメンテーション:デバイス別
- 市場セグメント
- 比較:デバイス別
- スマートフォン:市場規模と予測 2024年~2029年
- 監視カメラ:市場規模と予測 2024年~2029年
- ウェアラブル:市場規模と予測 2024年~2029年
- スマートスピーカー:市場規模と予測 2024年~2029年
- エッジサーバー:市場規模と予測 2024年~2029年
- 市場機会:デバイス別
第8章 市場セグメンテーション:プロセッサタイプ別
- 市場セグメント
- 比較:プロセッサタイプ別
- NPU:市場規模と予測 2024年~2029年
- グラフィックプロセッサ:市場規模と予測 2024年~2029年
- ASIC:市場規模と予測 2024年~2029年
- CPU:市場規模と予測 2024年~2029年
- FPGA:市場規模と予測 2024年~2029年
- 市場機会:プロセッサタイプ別
第9章 市場セグメンテーション:出力定格別
- 市場セグメント
- 比較:出力定格別
- 1W未満:市場規模と予測 2024年~2029年
- 5W以上:市場規模と予測 2024年~2029年
- 市場機会:出力定格別
第10章 市場セグメンテーション:産業用途別
- 市場セグメント
- 比較:産業用途別
- 消費者向けデバイス:市場規模と予測 2024年~2029年
- 自動車:市場規模と予測 2024年~2029年
- ヘルスケア:市場規模と予測 2024年~2029年
- 製造業:市場規模と予測 2024年~2029年
- 小売り:市場規模と予測 2024年~2029年
- 市場機会:産業用途別
第11章 顧客情勢
- 顧客情勢の概要
第12章 地域別情勢
- 地域別セグメンテーション
- 地域別比較
- アジア太平洋:市場規模と予測 2024年~2029年
- 北米:市場規模と予測 2024年~2029年
- 欧州:市場規模と予測 2024年~2029年
- 中東・アフリカ:市場規模と予測 2024年~2029年
- 南米:市場規模と予測 2024年~2029年
- 米国:市場規模と予測 2024年~2029年
- 中国:市場規模と予測 2024年~2029年
- 日本:市場規模と予測 2024年~2029年
- 韓国:市場規模と予測 2024年~2029年
- ドイツ:市場規模と予測 2024年~2029年
- インド:市場規模と予測 2024年~2029年
- 英国:市場規模と予測 2024年~2029年
- カナダ:市場規模と予測 2024年~2029年
- フランス:市場規模と予測 2024年~2029年
- イスラエル:市場規模と予測 2024年~2029年
- 市場機会:地域情勢別
第13章 促進要因・課題・機会・抑制要因
- 市場促進要因
- 市場の課題
- 促進要因と課題の影響
- 市場の機会・抑制要因
第14章 競合情勢
- 概要
- 競合情勢
- 混乱の状況
- 業界のリスク
第15章 競合分析
- 企業プロファイル
- 企業ランキング指数
- 企業の市場ポジショニング
- Advanced Micro Devices Inc.
- Apple Inc.
- Axelera AI B.V.
- BrainChip Holdings Ltd
- Graphcore Ltd.
- Hailo Technologies Ltd
- Huawei Technologies Co. Ltd.
- Kneron Inc.
- MediaTek Inc.
- Mythic Inc.
- NVIDIA Corp.
- Qualcomm Inc.
- Samsung Electronics Co. Ltd.
- Synaptics Inc.
- Tenstorrent Inc.
第16章 付録
Exhibits:
- Exhibits1: Executive Summary - Chart on Market Overview
- Exhibits2: Executive Summary - Data Table on Market Overview
- Exhibits3: Executive Summary - Chart on Global Market Characteristics
- Exhibits4: Executive Summary - Chart on Market By Geographical Landscape
- Exhibits5: Executive Summary - Chart on Market Segmentation by Device
- Exhibits6: Executive Summary - Chart on Market Segmentation by Processor Type
- Exhibits7: Executive Summary - Chart on Market Segmentation by Power Rating
- Exhibits8: Executive Summary - Chart on Market Segmentation by Industry Application
- Exhibits9: Executive Summary - Chart on Incremental Growth
- Exhibits10: Executive Summary - Data Table on Incremental Growth
- Exhibits11: Executive Summary - Chart on Company Market Positioning
- Exhibits12: Analysis of price sensitivity, lifecycle, customer purchase basket, adoption rates, and purchase criteria
- Exhibits13: Overview on criticality of inputs and factors of differentiation
- Exhibits14: Overview on factors of disruption
- Exhibits15: Impact of drivers and challenges in 2024 and 2029
- Exhibits16: Parent Market
- Exhibits17: Data Table on - Parent Market
- Exhibits18: Market characteristics analysis
- Exhibits19: Value chain analysis
- Exhibits20: Offerings of companies included in the market definition
- Exhibits21: Market segments
- Exhibits22: Chart on Global - Market size and forecast 2024-2029 ($ million)
- Exhibits23: Data Table on Global - Market size and forecast 2024-2029 ($ million)
- Exhibits24: Chart on Global Market: Year-over-year growth 2024-2029 (%)
- Exhibits25: Data Table on Global Market: Year-over-year growth 2024-2029 (%)
- Exhibits26: Historic Market Size - Data Table on Global AI Hardware For Edge Devices Market 2019 - 2023 ($ million)
- Exhibits27: Historic Market Size - Device Segment 2019 - 2023 ($ million)
- Exhibits28: Historic Market Size - Processor Type Segment 2019 - 2023 ($ million)
- Exhibits29: Historic Market Size - Power Rating Segment 2019 - 2023 ($ million)
- Exhibits30: Historic Market Size - Industry Application Segment 2019 - 2023 ($ million)
- Exhibits31: Historic Market Size - Geography Segment 2019 - 2023 ($ million)
- Exhibits32: Historic Market Size - Country Segment 2019 - 2023 ($ million)
- Exhibits33: Five forces analysis - Comparison between 2024 and 2029
- Exhibits34: Bargaining power of buyers - Impact of key factors 2024 and 2029
- Exhibits35: Bargaining power of suppliers - Impact of key factors in 2024 and 2029
- Exhibits36: Threat of new entrants - Impact of key factors in 2024 and 2029
- Exhibits37: Threat of substitutes - Impact of key factors in 2024 and 2029
- Exhibits38: Threat of rivalry - Impact of key factors in 2024 and 2029
- Exhibits39: Chart on Market condition - Five forces 2024 and 2029
- Exhibits40: Chart on Device - Market share 2024-2029 (%)
- Exhibits41: Data Table on Device - Market share 2024-2029 (%)
- Exhibits42: Chart on Comparison by Device
- Exhibits43: Data Table on Comparison by Device
- Exhibits44: Chart on Smartphones - Market size and forecast 2024-2029 ($ million)
- Exhibits45: Data Table on Smartphones - Market size and forecast 2024-2029 ($ million)
- Exhibits46: Chart on Smartphones - Year-over-year growth 2024-2029 (%)
- Exhibits47: Data Table on Smartphones - Year-over-year growth 2024-2029 (%)
- Exhibits48: Chart on Surveillance cameras - Market size and forecast 2024-2029 ($ million)
- Exhibits49: Data Table on Surveillance cameras - Market size and forecast 2024-2029 ($ million)
- Exhibits50: Chart on Surveillance cameras - Year-over-year growth 2024-2029 (%)
- Exhibits51: Data Table on Surveillance cameras - Year-over-year growth 2024-2029 (%)
- Exhibits52: Chart on Wearables - Market size and forecast 2024-2029 ($ million)
- Exhibits53: Data Table on Wearables - Market size and forecast 2024-2029 ($ million)
- Exhibits54: Chart on Wearables - Year-over-year growth 2024-2029 (%)
- Exhibits55: Data Table on Wearables - Year-over-year growth 2024-2029 (%)
- Exhibits56: Chart on Smart speakers - Market size and forecast 2024-2029 ($ million)
- Exhibits57: Data Table on Smart speakers - Market size and forecast 2024-2029 ($ million)
- Exhibits58: Chart on Smart speakers - Year-over-year growth 2024-2029 (%)
- Exhibits59: Data Table on Smart speakers - Year-over-year growth 2024-2029 (%)
- Exhibits60: Chart on Edge servers - Market size and forecast 2024-2029 ($ million)
- Exhibits61: Data Table on Edge servers - Market size and forecast 2024-2029 ($ million)
- Exhibits62: Chart on Edge servers - Year-over-year growth 2024-2029 (%)
- Exhibits63: Data Table on Edge servers - Year-over-year growth 2024-2029 (%)
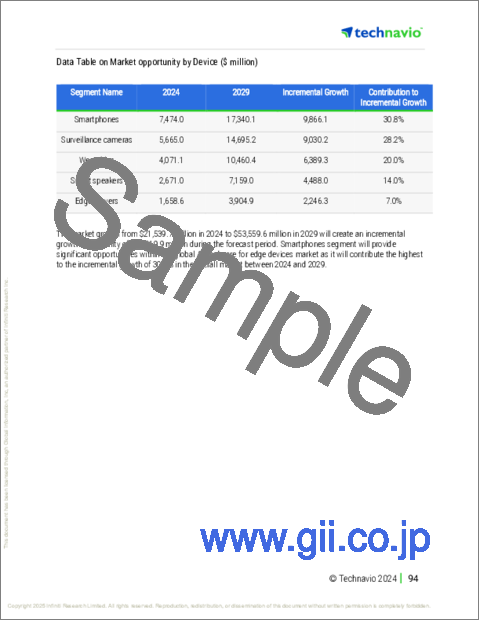
- Exhibits64: Market opportunity by Device ($ million)
- Exhibits65: Data Table on Market opportunity by Device ($ million)
- Exhibits66: Chart on Processor Type - Market share 2024-2029 (%)
- Exhibits67: Data Table on Processor Type - Market share 2024-2029 (%)
- Exhibits68: Chart on Comparison by Processor Type
- Exhibits69: Data Table on Comparison by Processor Type
- Exhibits70: Chart on NPU - Market size and forecast 2024-2029 ($ million)
- Exhibits71: Data Table on NPU - Market size and forecast 2024-2029 ($ million)
- Exhibits72: Chart on NPU - Year-over-year growth 2024-2029 (%)
- Exhibits73: Data Table on NPU - Year-over-year growth 2024-2029 (%)
- Exhibits74: Chart on GPU - Market size and forecast 2024-2029 ($ million)
- Exhibits75: Data Table on GPU - Market size and forecast 2024-2029 ($ million)
- Exhibits76: Chart on GPU - Year-over-year growth 2024-2029 (%)
- Exhibits77: Data Table on GPU - Year-over-year growth 2024-2029 (%)
- Exhibits78: Chart on ASIC - Market size and forecast 2024-2029 ($ million)
- Exhibits79: Data Table on ASIC - Market size and forecast 2024-2029 ($ million)
- Exhibits80: Chart on ASIC - Year-over-year growth 2024-2029 (%)
- Exhibits81: Data Table on ASIC - Year-over-year growth 2024-2029 (%)
- Exhibits82: Chart on CPU - Market size and forecast 2024-2029 ($ million)
- Exhibits83: Data Table on CPU - Market size and forecast 2024-2029 ($ million)
- Exhibits84: Chart on CPU - Year-over-year growth 2024-2029 (%)
- Exhibits85: Data Table on CPU - Year-over-year growth 2024-2029 (%)
- Exhibits86: Chart on FPGA - Market size and forecast 2024-2029 ($ million)
- Exhibits87: Data Table on FPGA - Market size and forecast 2024-2029 ($ million)
- Exhibits88: Chart on FPGA - Year-over-year growth 2024-2029 (%)
- Exhibits89: Data Table on FPGA - Year-over-year growth 2024-2029 (%)
- Exhibits90: Market opportunity by Processor Type ($ million)
- Exhibits91: Data Table on Market opportunity by Processor Type ($ million)
- Exhibits92: Chart on Power Rating - Market share 2024-2029 (%)
- Exhibits93: Data Table on Power Rating - Market share 2024-2029 (%)
- Exhibits94: Chart on Comparison by Power Rating
- Exhibits95: Data Table on Comparison by Power Rating
- Exhibits96: Chart on 1 to 3W - Market size and forecast 2024-2029 ($ million)
- Exhibits97: Data Table on 1 to 3W - Market size and forecast 2024-2029 ($ million)
- Exhibits98: Chart on 1 to 3W - Year-over-year growth 2024-2029 (%)
- Exhibits99: Data Table on 1 to 3W - Year-over-year growth 2024-2029 (%)
- Exhibits100: Chart on Less than 1W - Market size and forecast 2024-2029 ($ million)
- Exhibits101: Data Table on Less than 1W - Market size and forecast 2024-2029 ($ million)
- Exhibits102: Chart on Less than 1W - Year-over-year growth 2024-2029 (%)
- Exhibits103: Data Table on Less than 1W - Year-over-year growth 2024-2029 (%)
- Exhibits104: Chart on 3 to 5W - Market size and forecast 2024-2029 ($ million)
- Exhibits105: Data Table on 3 to 5W - Market size and forecast 2024-2029 ($ million)
- Exhibits106: Chart on 3 to 5W - Year-over-year growth 2024-2029 (%)
- Exhibits107: Data Table on 3 to 5W - Year-over-year growth 2024-2029 (%)
- Exhibits108: Chart on More than 5W - Market size and forecast 2024-2029 ($ million)
- Exhibits109: Data Table on More than 5W - Market size and forecast 2024-2029 ($ million)
- Exhibits110: Chart on More than 5W - Year-over-year growth 2024-2029 (%)
- Exhibits111: Data Table on More than 5W - Year-over-year growth 2024-2029 (%)
- Exhibits112: Market opportunity by Power Rating ($ million)
- Exhibits113: Data Table on Market opportunity by Power Rating ($ million)
- Exhibits114: Chart on Industry Application - Market share 2024-2029 (%)
- Exhibits115: Data Table on Industry Application - Market share 2024-2029 (%)
- Exhibits116: Chart on Comparison by Industry Application
- Exhibits117: Data Table on Comparison by Industry Application
- Exhibits118: Chart on Consumer devices - Market size and forecast 2024-2029 ($ million)
- Exhibits119: Data Table on Consumer devices - Market size and forecast 2024-2029 ($ million)
- Exhibits120: Chart on Consumer devices - Year-over-year growth 2024-2029 (%)
- Exhibits121: Data Table on Consumer devices - Year-over-year growth 2024-2029 (%)
- Exhibits122: Chart on Automotive - Market size and forecast 2024-2029 ($ million)
- Exhibits123: Data Table on Automotive - Market size and forecast 2024-2029 ($ million)
- Exhibits124: Chart on Automotive - Year-over-year growth 2024-2029 (%)
- Exhibits125: Data Table on Automotive - Year-over-year growth 2024-2029 (%)
- Exhibits126: Chart on Healthcare - Market size and forecast 2024-2029 ($ million)
- Exhibits127: Data Table on Healthcare - Market size and forecast 2024-2029 ($ million)
- Exhibits128: Chart on Healthcare - Year-over-year growth 2024-2029 (%)
- Exhibits129: Data Table on Healthcare - Year-over-year growth 2024-2029 (%)
- Exhibits130: Chart on Manufacturing - Market size and forecast 2024-2029 ($ million)
- Exhibits131: Data Table on Manufacturing - Market size and forecast 2024-2029 ($ million)
- Exhibits132: Chart on Manufacturing - Year-over-year growth 2024-2029 (%)
- Exhibits133: Data Table on Manufacturing - Year-over-year growth 2024-2029 (%)
- Exhibits134: Chart on Retail - Market size and forecast 2024-2029 ($ million)
- Exhibits135: Data Table on Retail - Market size and forecast 2024-2029 ($ million)
- Exhibits136: Chart on Retail - Year-over-year growth 2024-2029 (%)
- Exhibits137: Data Table on Retail - Year-over-year growth 2024-2029 (%)
- Exhibits138: Market opportunity by Industry Application ($ million)
- Exhibits139: Data Table on Market opportunity by Industry Application ($ million)
- Exhibits140: Analysis of price sensitivity, lifecycle, customer purchase basket, adoption rates, and purchase criteria
- Exhibits141: Chart on Market share By Geographical Landscape 2024-2029 (%)
- Exhibits142: Data Table on Market share By Geographical Landscape 2024-2029 (%)
- Exhibits143: Chart on Geographic comparison
- Exhibits144: Data Table on Geographic comparison
- Exhibits145: Chart on APAC - Market size and forecast 2024-2029 ($ million)
- Exhibits146: Data Table on APAC - Market size and forecast 2024-2029 ($ million)
- Exhibits147: Chart on APAC - Year-over-year growth 2024-2029 (%)
- Exhibits148: Data Table on APAC - Year-over-year growth 2024-2029 (%)
- Exhibits149: Chart on North America - Market size and forecast 2024-2029 ($ million)
- Exhibits150: Data Table on North America - Market size and forecast 2024-2029 ($ million)
- Exhibits151: Chart on North America - Year-over-year growth 2024-2029 (%)
- Exhibits152: Data Table on North America - Year-over-year growth 2024-2029 (%)
- Exhibits153: Chart on Europe - Market size and forecast 2024-2029 ($ million)
- Exhibits154: Data Table on Europe - Market size and forecast 2024-2029 ($ million)
- Exhibits155: Chart on Europe - Year-over-year growth 2024-2029 (%)
- Exhibits156: Data Table on Europe - Year-over-year growth 2024-2029 (%)
- Exhibits157: Chart on Middle East and Africa - Market size and forecast 2024-2029 ($ million)
- Exhibits158: Data Table on Middle East and Africa - Market size and forecast 2024-2029 ($ million)
- Exhibits159: Chart on Middle East and Africa - Year-over-year growth 2024-2029 (%)
- Exhibits160: Data Table on Middle East and Africa - Year-over-year growth 2024-2029 (%)
- Exhibits161: Chart on South America - Market size and forecast 2024-2029 ($ million)
- Exhibits162: Data Table on South America - Market size and forecast 2024-2029 ($ million)
- Exhibits163: Chart on South America - Year-over-year growth 2024-2029 (%)
- Exhibits164: Data Table on South America - Year-over-year growth 2024-2029 (%)
- Exhibits165: Chart on US - Market size and forecast 2024-2029 ($ million)
- Exhibits166: Data Table on US - Market size and forecast 2024-2029 ($ million)
- Exhibits167: Chart on US - Year-over-year growth 2024-2029 (%)
- Exhibits168: Data Table on US - Year-over-year growth 2024-2029 (%)
- Exhibits169: Chart on China - Market size and forecast 2024-2029 ($ million)
- Exhibits170: Data Table on China - Market size and forecast 2024-2029 ($ million)
- Exhibits171: Chart on China - Year-over-year growth 2024-2029 (%)
- Exhibits172: Data Table on China - Year-over-year growth 2024-2029 (%)
- Exhibits173: Chart on Japan - Market size and forecast 2024-2029 ($ million)
- Exhibits174: Data Table on Japan - Market size and forecast 2024-2029 ($ million)
- Exhibits175: Chart on Japan - Year-over-year growth 2024-2029 (%)
- Exhibits176: Data Table on Japan - Year-over-year growth 2024-2029 (%)
- Exhibits177: Chart on South Korea - Market size and forecast 2024-2029 ($ million)
- Exhibits178: Data Table on South Korea - Market size and forecast 2024-2029 ($ million)
- Exhibits179: Chart on South Korea - Year-over-year growth 2024-2029 (%)
- Exhibits180: Data Table on South Korea - Year-over-year growth 2024-2029 (%)
- Exhibits181: Chart on Germany - Market size and forecast 2024-2029 ($ million)
- Exhibits182: Data Table on Germany - Market size and forecast 2024-2029 ($ million)
- Exhibits183: Chart on Germany - Year-over-year growth 2024-2029 (%)
- Exhibits184: Data Table on Germany - Year-over-year growth 2024-2029 (%)
- Exhibits185: Chart on India - Market size and forecast 2024-2029 ($ million)
- Exhibits186: Data Table on India - Market size and forecast 2024-2029 ($ million)
- Exhibits187: Chart on India - Year-over-year growth 2024-2029 (%)
- Exhibits188: Data Table on India - Year-over-year growth 2024-2029 (%)
- Exhibits189: Chart on UK - Market size and forecast 2024-2029 ($ million)
- Exhibits190: Data Table on UK - Market size and forecast 2024-2029 ($ million)
- Exhibits191: Chart on UK - Year-over-year growth 2024-2029 (%)
- Exhibits192: Data Table on UK - Year-over-year growth 2024-2029 (%)
- Exhibits193: Chart on Canada - Market size and forecast 2024-2029 ($ million)
- Exhibits194: Data Table on Canada - Market size and forecast 2024-2029 ($ million)
- Exhibits195: Chart on Canada - Year-over-year growth 2024-2029 (%)
- Exhibits196: Data Table on Canada - Year-over-year growth 2024-2029 (%)
- Exhibits197: Chart on France - Market size and forecast 2024-2029 ($ million)
- Exhibits198: Data Table on France - Market size and forecast 2024-2029 ($ million)
- Exhibits199: Chart on France - Year-over-year growth 2024-2029 (%)
- Exhibits200: Data Table on France - Year-over-year growth 2024-2029 (%)
- Exhibits201: Chart on Israel - Market size and forecast 2024-2029 ($ million)
- Exhibits202: Data Table on Israel - Market size and forecast 2024-2029 ($ million)
- Exhibits203: Chart on Israel - Year-over-year growth 2024-2029 (%)
- Exhibits204: Data Table on Israel - Year-over-year growth 2024-2029 (%)
- Exhibits205: Market opportunity By Geographical Landscape ($ million)
- Exhibits206: Data Tables on Market opportunity By Geographical Landscape ($ million)
- Exhibits207: Impact of drivers and challenges in 2024 and 2029
- Exhibits208: Overview on criticality of inputs and factors of differentiation
- Exhibits209: Overview on factors of disruption
- Exhibits210: Impact of key risks on business
- Exhibits211: Companies covered
- Exhibits212: Company ranking index
- Exhibits213: Matrix on companies position and classification
- Exhibits214: Advanced Micro Devices Inc. - Overview
- Exhibits215: Advanced Micro Devices Inc. - Business segments
- Exhibits216: Advanced Micro Devices Inc. - Key news
- Exhibits217: Advanced Micro Devices Inc. - Key offerings
- Exhibits218: Advanced Micro Devices Inc. - Segment focus
- Exhibits219: SWOT
- Exhibits220: Apple Inc. - Overview
- Exhibits221: Apple Inc. - Business segments
- Exhibits222: Apple Inc. - Key news
- Exhibits223: Apple Inc. - Key offerings
- Exhibits224: Apple Inc. - Segment focus
- Exhibits225: SWOT
- Exhibits226: Axelera AI B.V. - Overview
- Exhibits227: Axelera AI B.V. - Product / Service
- Exhibits228: Axelera AI B.V. - Key offerings
- Exhibits229: SWOT
- Exhibits230: BrainChip Holdings Ltd - Overview
- Exhibits231: BrainChip Holdings Ltd - Product / Service
- Exhibits232: BrainChip Holdings Ltd - Key offerings
- Exhibits233: SWOT
- Exhibits234: Graphcore Ltd. - Overview
- Exhibits235: Graphcore Ltd. - Product / Service
- Exhibits236: Graphcore Ltd. - Key offerings
- Exhibits237: SWOT
- Exhibits238: Hailo Technologies Ltd - Overview
- Exhibits239: Hailo Technologies Ltd - Product / Service
- Exhibits240: Hailo Technologies Ltd - Key offerings
- Exhibits241: SWOT
- Exhibits242: Huawei Technologies Co. Ltd. - Overview
- Exhibits243: Huawei Technologies Co. Ltd. - Product / Service
- Exhibits244: Huawei Technologies Co. Ltd. - Key news
- Exhibits245: Huawei Technologies Co. Ltd. - Key offerings
- Exhibits246: SWOT
- Exhibits247: Kneron Inc. - Overview
- Exhibits248: Kneron Inc. - Product / Service
- Exhibits249: Kneron Inc. - Key offerings
- Exhibits250: SWOT
- Exhibits251: MediaTek Inc. - Overview
- Exhibits252: MediaTek Inc. - Product / Service
- Exhibits253: MediaTek Inc. - Key news
- Exhibits254: MediaTek Inc. - Key offerings
- Exhibits255: SWOT
- Exhibits256: Mythic Inc. - Overview
- Exhibits257: Mythic Inc. - Product / Service
- Exhibits258: Mythic Inc. - Key offerings
- Exhibits259: SWOT
- Exhibits260: NVIDIA Corp. - Overview
- Exhibits261: NVIDIA Corp. - Business segments
- Exhibits262: NVIDIA Corp. - Key news
- Exhibits263: NVIDIA Corp. - Key offerings
- Exhibits264: NVIDIA Corp. - Segment focus
- Exhibits265: SWOT
- Exhibits266: Qualcomm Inc. - Overview
- Exhibits267: Qualcomm Inc. - Business segments
- Exhibits268: Qualcomm Inc. - Key news
- Exhibits269: Qualcomm Inc. - Key offerings
- Exhibits270: Qualcomm Inc. - Segment focus
- Exhibits271: SWOT
- Exhibits272: Samsung Electronics Co. Ltd. - Overview
- Exhibits273: Samsung Electronics Co. Ltd. - Business segments
- Exhibits274: Samsung Electronics Co. Ltd. - Key news
- Exhibits275: Samsung Electronics Co. Ltd. - Key offerings
- Exhibits276: Samsung Electronics Co. Ltd. - Segment focus
- Exhibits277: SWOT
- Exhibits278: Synaptics Inc. - Overview
- Exhibits279: Synaptics Inc. - Product / Service
- Exhibits280: Synaptics Inc. - Key offerings
- Exhibits281: SWOT
- Exhibits282: Tenstorrent Inc. - Overview
- Exhibits283: Tenstorrent Inc. - Product / Service
- Exhibits284: Tenstorrent Inc. - Key offerings
- Exhibits285: SWOT
- Exhibits286: Inclusions checklist
- Exhibits287: Exclusions checklist
- Exhibits288: Currency conversion rates for US$
- Exhibits289: Research methodology
- Exhibits290: Information sources
- Exhibits291: Data validation
- Exhibits292: Validation techniques employed for market sizing
- Exhibits293: Data synthesis
- Exhibits294: 360 degree market analysis
- Exhibits295: List of abbreviations
The ai hardware for edge devices market is forecasted to grow by USD 32,019.9 mn during 2024-2029, accelerating at a CAGR of 20% during the forecast period. The report on the ai hardware for edge devices market provides a holistic analysis, market size and forecast, trends, growth drivers, and challenges, as well as vendor analysis covering around 25 vendors.
The report offers an up-to-date analysis regarding the current market scenario, the latest trends and drivers, and the overall market environment. The market is driven by critical imperative for low latency and real time processing, escalating concerns for data privacy, security, and operational resilience, and symbiotic proliferation of iot and advent of on-device generative ai.
| Market Scope | |
|---|---|
| Base Year | 2025 |
| End Year | 2029 |
| Series Year | 2025-2029 |
| Growth Momentum | Accelerate |
| YOY 2025 | 17.5% |
| CAGR | 20% |
| Incremental Value | $32,019.9 mn |
The study was conducted using an objective combination of primary and secondary information including inputs from key participants in the industry. The report contains a comprehensive market size data, segment with regional analysis and vendor landscape in addition to an analysis of the key companies. Reports have historic and forecast data.
Technavio's ai hardware for edge devices market is segmented as below:
By Device
- Smartphones
- Surveillance cameras
- Wearables
- Smart speakers
- Edge servers
By Processor Type
- NPU
- GPU
- ASIC
- CPU
- FPGA
By Power Rating
- 1 to 3W
- Less than 1W
- 3 to 5W
- More than 5W
By Industry Application
- Consumer devices
- Automotive
- Healthcare
- Manufacturing
- Retail
By Geographical Landscape
- APAC
- North America
- Europe
- Middle East and Africa
- South America
This study identifies the emergence of on-device generative ai as a keystone technology as one of the prime reasons driving the ai hardware for edge devices market growth during the next few years. Also, proliferation of domain-specific and application-specific architectures and rise of heterogeneous computing and intelligent workload orchestration will lead to sizable demand in the market.
The report on the ai hardware for edge devices market covers the following areas:
- AI Hardware For Edge Devices Market sizing
- AI Hardware For Edge Devices Market forecast
- AI Hardware For Edge Devices Market industry analysis
The robust vendor analysis is designed to help clients improve their market position, and in line with this, this report provides a detailed analysis of several leading ai hardware for edge devices market vendors that include Advanced Micro Devices Inc., Apple Inc., Arm Ltd., Axelera AI B.V., BrainChip Holdings Ltd, Google LLC, Graphcore Ltd., Hailo Technologies Ltd, Huawei Technologies Co. Ltd., Intel Corp., Kneron Inc., LeapMind Inc., MediaTek Inc., Mythic Inc., NVIDIA Corp., Qualcomm Inc., Samsung Electronics Co. Ltd., Synaptics Inc., and Tenstorrent Inc.. Also, the ai hardware for edge devices market analysis report includes information on upcoming trends and challenges that will influence market growth. This is to help companies strategize and leverage all forthcoming growth opportunities.
The publisher presents a detailed picture of the market by the way of study, synthesis, and summation of data from multiple sources by an analysis of key parameters such as profit, pricing, competition, and promotions. It presents various market facets by identifying the key industry influencers. The data presented is comprehensive, reliable, and a result of extensive primary and secondary research. The market research reports provide a complete competitive landscape and an in-depth vendor selection methodology and analysis using qualitative and quantitative research to forecast accurate market growth.
Table of Contents
1 Executive Summary
- 1.1 Market overview
- Executive Summary - Chart on Market Overview
- Executive Summary - Data Table on Market Overview
- Executive Summary - Chart on Global Market Characteristics
- Executive Summary - Chart on Market By Geographical Landscape
- Executive Summary - Chart on Market Segmentation by Device
- Executive Summary - Chart on Market Segmentation by Processor Type
- Executive Summary - Chart on Market Segmentation by Power Rating
- Executive Summary - Chart on Market Segmentation by Industry Application
- Executive Summary - Chart on Incremental Growth
- Executive Summary - Data Table on Incremental Growth
- Executive Summary - Chart on Company Market Positioning
2 Technavio Analysis
- 2.1 Analysis of price sensitivity, lifecycle, customer purchase basket, adoption rates, and purchase criteria
- Analysis of price sensitivity, lifecycle, customer purchase basket, adoption rates, and purchase criteria
- 2.2 Criticality of inputs and Factors of differentiation
- Overview on criticality of inputs and factors of differentiation
- 2.3 Factors of disruption
- Overview on factors of disruption
- 2.4 Impact of drivers and challenges
- Impact of drivers and challenges in 2024 and 2029
3 Market Landscape
- 3.1 Market ecosystem
- Parent Market
- Data Table on - Parent Market
- 3.2 Market characteristics
- Market characteristics analysis
- 3.3 Value chain analysis
- Value chain analysis
4 Market Sizing
- 4.1 Market definition
- Offerings of companies included in the market definition
- 4.2 Market segment analysis
- Market segments
- 4.3 Market size 2024
- 4.4 Market outlook: Forecast for 2024-2029
- Chart on Global - Market size and forecast 2024-2029 ($ million)
- Data Table on Global - Market size and forecast 2024-2029 ($ million)
- Chart on Global Market: Year-over-year growth 2024-2029 (%)
- Data Table on Global Market: Year-over-year growth 2024-2029 (%)
5 Historic Market Size
- 5.1 Global AI Hardware For Edge Devices Market 2019 - 2023
- Historic Market Size - Data Table on Global AI Hardware For Edge Devices Market 2019 - 2023 ($ million)
- 5.2 Device segment analysis 2019 - 2023
- Historic Market Size - Device Segment 2019 - 2023 ($ million)
- 5.3 Processor Type segment analysis 2019 - 2023
- Historic Market Size - Processor Type Segment 2019 - 2023 ($ million)
- 5.4 Power Rating segment analysis 2019 - 2023
- Historic Market Size - Power Rating Segment 2019 - 2023 ($ million)
- 5.5 Industry Application segment analysis 2019 - 2023
- Historic Market Size - Industry Application Segment 2019 - 2023 ($ million)
- 5.6 Geography segment analysis 2019 - 2023
- Historic Market Size - Geography Segment 2019 - 2023 ($ million)
- 5.7 Country segment analysis 2019 - 2023
- Historic Market Size - Country Segment 2019 - 2023 ($ million)
6 Five Forces Analysis
- 6.1 Five forces summary
- Five forces analysis - Comparison between 2024 and 2029
- 6.2 Bargaining power of buyers
- Bargaining power of buyers - Impact of key factors 2024 and 2029
- 6.3 Bargaining power of suppliers
- Bargaining power of suppliers - Impact of key factors in 2024 and 2029
- 6.4 Threat of new entrants
- Threat of new entrants - Impact of key factors in 2024 and 2029
- 6.5 Threat of substitutes
- Threat of substitutes - Impact of key factors in 2024 and 2029
- 6.6 Threat of rivalry
- Threat of rivalry - Impact of key factors in 2024 and 2029
- 6.7 Market condition
- Chart on Market condition - Five forces 2024 and 2029
7 Market Segmentation by Device
- 7.1 Market segments
- Chart on Device - Market share 2024-2029 (%)
- Data Table on Device - Market share 2024-2029 (%)
- 7.2 Comparison by Device
- Chart on Comparison by Device
- Data Table on Comparison by Device
- 7.3 Smartphones - Market size and forecast 2024-2029
- Chart on Smartphones - Market size and forecast 2024-2029 ($ million)
- Data Table on Smartphones - Market size and forecast 2024-2029 ($ million)
- Chart on Smartphones - Year-over-year growth 2024-2029 (%)
- Data Table on Smartphones - Year-over-year growth 2024-2029 (%)
- 7.4 Surveillance cameras - Market size and forecast 2024-2029
- Chart on Surveillance cameras - Market size and forecast 2024-2029 ($ million)
- Data Table on Surveillance cameras - Market size and forecast 2024-2029 ($ million)
- Chart on Surveillance cameras - Year-over-year growth 2024-2029 (%)
- Data Table on Surveillance cameras - Year-over-year growth 2024-2029 (%)
- 7.5 Wearables - Market size and forecast 2024-2029
- Chart on Wearables - Market size and forecast 2024-2029 ($ million)
- Data Table on Wearables - Market size and forecast 2024-2029 ($ million)
- Chart on Wearables - Year-over-year growth 2024-2029 (%)
- Data Table on Wearables - Year-over-year growth 2024-2029 (%)
- 7.6 Smart speakers - Market size and forecast 2024-2029
- Chart on Smart speakers - Market size and forecast 2024-2029 ($ million)
- Data Table on Smart speakers - Market size and forecast 2024-2029 ($ million)
- Chart on Smart speakers - Year-over-year growth 2024-2029 (%)
- Data Table on Smart speakers - Year-over-year growth 2024-2029 (%)
- 7.7 Edge servers - Market size and forecast 2024-2029
- Chart on Edge servers - Market size and forecast 2024-2029 ($ million)
- Data Table on Edge servers - Market size and forecast 2024-2029 ($ million)
- Chart on Edge servers - Year-over-year growth 2024-2029 (%)
- Data Table on Edge servers - Year-over-year growth 2024-2029 (%)
- 7.8 Market opportunity by Device
- Market opportunity by Device ($ million)
- Data Table on Market opportunity by Device ($ million)
8 Market Segmentation by Processor Type
- 8.1 Market segments
- Chart on Processor Type - Market share 2024-2029 (%)
- Data Table on Processor Type - Market share 2024-2029 (%)
- 8.2 Comparison by Processor Type
- Chart on Comparison by Processor Type
- Data Table on Comparison by Processor Type
- 8.3 NPU - Market size and forecast 2024-2029
- Chart on NPU - Market size and forecast 2024-2029 ($ million)
- Data Table on NPU - Market size and forecast 2024-2029 ($ million)
- Chart on NPU - Year-over-year growth 2024-2029 (%)
- Data Table on NPU - Year-over-year growth 2024-2029 (%)
- 8.4 GPU - Market size and forecast 2024-2029
- Chart on GPU - Market size and forecast 2024-2029 ($ million)
- Data Table on GPU - Market size and forecast 2024-2029 ($ million)
- Chart on GPU - Year-over-year growth 2024-2029 (%)
- Data Table on GPU - Year-over-year growth 2024-2029 (%)
- 8.5 ASIC - Market size and forecast 2024-2029
- Chart on ASIC - Market size and forecast 2024-2029 ($ million)
- Data Table on ASIC - Market size and forecast 2024-2029 ($ million)
- Chart on ASIC - Year-over-year growth 2024-2029 (%)
- Data Table on ASIC - Year-over-year growth 2024-2029 (%)
- 8.6 CPU - Market size and forecast 2024-2029
- Chart on CPU - Market size and forecast 2024-2029 ($ million)
- Data Table on CPU - Market size and forecast 2024-2029 ($ million)
- Chart on CPU - Year-over-year growth 2024-2029 (%)
- Data Table on CPU - Year-over-year growth 2024-2029 (%)
- 8.7 FPGA - Market size and forecast 2024-2029
- Chart on FPGA - Market size and forecast 2024-2029 ($ million)
- Data Table on FPGA - Market size and forecast 2024-2029 ($ million)
- Chart on FPGA - Year-over-year growth 2024-2029 (%)
- Data Table on FPGA - Year-over-year growth 2024-2029 (%)
- 8.8 Market opportunity by Processor Type
- Market opportunity by Processor Type ($ million)
- Data Table on Market opportunity by Processor Type ($ million)
9 Market Segmentation by Power Rating
- 9.1 Market segments
- Chart on Power Rating - Market share 2024-2029 (%)
- Data Table on Power Rating - Market share 2024-2029 (%)
- 9.2 Comparison by Power Rating
- Chart on Comparison by Power Rating
- Data Table on Comparison by Power Rating
- 1 to 3W - Market size and forecast 2024-2029
- Chart on 1 to 3W - Market size and forecast 2024-2029 ($ million)
- Data Table on 1 to 3W - Market size and forecast 2024-2029 ($ million)
- Chart on 1 to 3W - Year-over-year growth 2024-2029 (%)
- Data Table on 1 to 3W - Year-over-year growth 2024-2029 (%)
- 9.4 Less than 1W - Market size and forecast 2024-2029
- Chart on Less than 1W - Market size and forecast 2024-2029 ($ million)
- Data Table on Less than 1W - Market size and forecast 2024-2029 ($ million)
- Chart on Less than 1W - Year-over-year growth 2024-2029 (%)
- Data Table on Less than 1W - Year-over-year growth 2024-2029 (%)
- 3 to 5W - Market size and forecast 2024-2029
- Chart on 3 to 5W - Market size and forecast 2024-2029 ($ million)
- Data Table on 3 to 5W - Market size and forecast 2024-2029 ($ million)
- Chart on 3 to 5W - Year-over-year growth 2024-2029 (%)
- Data Table on 3 to 5W - Year-over-year growth 2024-2029 (%)
- 9.6 More than 5W - Market size and forecast 2024-2029
- Chart on More than 5W - Market size and forecast 2024-2029 ($ million)
- Data Table on More than 5W - Market size and forecast 2024-2029 ($ million)
- Chart on More than 5W - Year-over-year growth 2024-2029 (%)
- Data Table on More than 5W - Year-over-year growth 2024-2029 (%)
- 9.7 Market opportunity by Power Rating
- Market opportunity by Power Rating ($ million)
- Data Table on Market opportunity by Power Rating ($ million)
10 Market Segmentation by Industry Application
- 10.1 Market segments
- Chart on Industry Application - Market share 2024-2029 (%)
- Data Table on Industry Application - Market share 2024-2029 (%)
- 10.2 Comparison by Industry Application
- Chart on Comparison by Industry Application
- Data Table on Comparison by Industry Application
- 10.3 Consumer devices - Market size and forecast 2024-2029
- Chart on Consumer devices - Market size and forecast 2024-2029 ($ million)
- Data Table on Consumer devices - Market size and forecast 2024-2029 ($ million)
- Chart on Consumer devices - Year-over-year growth 2024-2029 (%)
- Data Table on Consumer devices - Year-over-year growth 2024-2029 (%)
- 10.4 Automotive - Market size and forecast 2024-2029
- Chart on Automotive - Market size and forecast 2024-2029 ($ million)
- Data Table on Automotive - Market size and forecast 2024-2029 ($ million)
- Chart on Automotive - Year-over-year growth 2024-2029 (%)
- Data Table on Automotive - Year-over-year growth 2024-2029 (%)
- 10.5 Healthcare - Market size and forecast 2024-2029
- Chart on Healthcare - Market size and forecast 2024-2029 ($ million)
- Data Table on Healthcare - Market size and forecast 2024-2029 ($ million)
- Chart on Healthcare - Year-over-year growth 2024-2029 (%)
- Data Table on Healthcare - Year-over-year growth 2024-2029 (%)
- 10.6 Manufacturing - Market size and forecast 2024-2029
- Chart on Manufacturing - Market size and forecast 2024-2029 ($ million)
- Data Table on Manufacturing - Market size and forecast 2024-2029 ($ million)
- Chart on Manufacturing - Year-over-year growth 2024-2029 (%)
- Data Table on Manufacturing - Year-over-year growth 2024-2029 (%)
- 10.7 Retail - Market size and forecast 2024-2029
- Chart on Retail - Market size and forecast 2024-2029 ($ million)
- Data Table on Retail - Market size and forecast 2024-2029 ($ million)
- Chart on Retail - Year-over-year growth 2024-2029 (%)
- Data Table on Retail - Year-over-year growth 2024-2029 (%)
- 10.8 Market opportunity by Industry Application
- Market opportunity by Industry Application ($ million)
- Data Table on Market opportunity by Industry Application ($ million)
11 Customer Landscape
- 11.1 Customer landscape overview
- Analysis of price sensitivity, lifecycle, customer purchase basket, adoption rates, and purchase criteria
12 Geographic Landscape
- 12.1 Geographic segmentation
- Chart on Market share By Geographical Landscape 2024-2029 (%)
- Data Table on Market share By Geographical Landscape 2024-2029 (%)
- 12.2 Geographic comparison
- Chart on Geographic comparison
- Data Table on Geographic comparison
- 12.3 APAC - Market size and forecast 2024-2029
- Chart on APAC - Market size and forecast 2024-2029 ($ million)
- Data Table on APAC - Market size and forecast 2024-2029 ($ million)
- Chart on APAC - Year-over-year growth 2024-2029 (%)
- Data Table on APAC - Year-over-year growth 2024-2029 (%)
- 12.4 North America - Market size and forecast 2024-2029
- Chart on North America - Market size and forecast 2024-2029 ($ million)
- Data Table on North America - Market size and forecast 2024-2029 ($ million)
- Chart on North America - Year-over-year growth 2024-2029 (%)
- Data Table on North America - Year-over-year growth 2024-2029 (%)
- 12.5 Europe - Market size and forecast 2024-2029
- Chart on Europe - Market size and forecast 2024-2029 ($ million)
- Data Table on Europe - Market size and forecast 2024-2029 ($ million)
- Chart on Europe - Year-over-year growth 2024-2029 (%)
- Data Table on Europe - Year-over-year growth 2024-2029 (%)
- 12.6 Middle East and Africa - Market size and forecast 2024-2029
- Chart on Middle East and Africa - Market size and forecast 2024-2029 ($ million)
- Data Table on Middle East and Africa - Market size and forecast 2024-2029 ($ million)
- Chart on Middle East and Africa - Year-over-year growth 2024-2029 (%)
- Data Table on Middle East and Africa - Year-over-year growth 2024-2029 (%)
- 12.7 South America - Market size and forecast 2024-2029
- Chart on South America - Market size and forecast 2024-2029 ($ million)
- Data Table on South America - Market size and forecast 2024-2029 ($ million)
- Chart on South America - Year-over-year growth 2024-2029 (%)
- Data Table on South America - Year-over-year growth 2024-2029 (%)
- 12.8 US - Market size and forecast 2024-2029
- Chart on US - Market size and forecast 2024-2029 ($ million)
- Data Table on US - Market size and forecast 2024-2029 ($ million)
- Chart on US - Year-over-year growth 2024-2029 (%)
- Data Table on US - Year-over-year growth 2024-2029 (%)
- 12.9 China - Market size and forecast 2024-2029
- Chart on China - Market size and forecast 2024-2029 ($ million)
- Data Table on China - Market size and forecast 2024-2029 ($ million)
- Chart on China - Year-over-year growth 2024-2029 (%)
- Data Table on China - Year-over-year growth 2024-2029 (%)
- 12.10 Japan - Market size and forecast 2024-2029
- Chart on Japan - Market size and forecast 2024-2029 ($ million)
- Data Table on Japan - Market size and forecast 2024-2029 ($ million)
- Chart on Japan - Year-over-year growth 2024-2029 (%)
- Data Table on Japan - Year-over-year growth 2024-2029 (%)
- 12.11 South Korea - Market size and forecast 2024-2029
- Chart on South Korea - Market size and forecast 2024-2029 ($ million)
- Data Table on South Korea - Market size and forecast 2024-2029 ($ million)
- Chart on South Korea - Year-over-year growth 2024-2029 (%)
- Data Table on South Korea - Year-over-year growth 2024-2029 (%)
- 12.12 Germany - Market size and forecast 2024-2029
- Chart on Germany - Market size and forecast 2024-2029 ($ million)
- Data Table on Germany - Market size and forecast 2024-2029 ($ million)
- Chart on Germany - Year-over-year growth 2024-2029 (%)
- Data Table on Germany - Year-over-year growth 2024-2029 (%)
- 12.13 India - Market size and forecast 2024-2029
- Chart on India - Market size and forecast 2024-2029 ($ million)
- Data Table on India - Market size and forecast 2024-2029 ($ million)
- Chart on India - Year-over-year growth 2024-2029 (%)
- Data Table on India - Year-over-year growth 2024-2029 (%)
- 12.14 UK - Market size and forecast 2024-2029
- Chart on UK - Market size and forecast 2024-2029 ($ million)
- Data Table on UK - Market size and forecast 2024-2029 ($ million)
- Chart on UK - Year-over-year growth 2024-2029 (%)
- Data Table on UK - Year-over-year growth 2024-2029 (%)
- 12.15 Canada - Market size and forecast 2024-2029
- Chart on Canada - Market size and forecast 2024-2029 ($ million)
- Data Table on Canada - Market size and forecast 2024-2029 ($ million)
- Chart on Canada - Year-over-year growth 2024-2029 (%)
- Data Table on Canada - Year-over-year growth 2024-2029 (%)
- 12.16 France - Market size and forecast 2024-2029
- Chart on France - Market size and forecast 2024-2029 ($ million)
- Data Table on France - Market size and forecast 2024-2029 ($ million)
- Chart on France - Year-over-year growth 2024-2029 (%)
- Data Table on France - Year-over-year growth 2024-2029 (%)
- 12.17 Israel - Market size and forecast 2024-2029
- Chart on Israel - Market size and forecast 2024-2029 ($ million)
- Data Table on Israel - Market size and forecast 2024-2029 ($ million)
- Chart on Israel - Year-over-year growth 2024-2029 (%)
- Data Table on Israel - Year-over-year growth 2024-2029 (%)
- 12.18 Market opportunity By Geographical Landscape
- Market opportunity By Geographical Landscape ($ million)
- Data Tables on Market opportunity By Geographical Landscape ($ million)
13 Drivers, Challenges, and Opportunity/Restraints
- 13.1 Market drivers
- 13.2 Market challenges
- 13.3 Impact of drivers and challenges
- Impact of drivers and challenges in 2024 and 2029
- 13.4 Market opportunities/restraints
14 Competitive Landscape
- 14.1 Overview
- 14.2 Competitive Landscape
- Overview on criticality of inputs and factors of differentiation
- 14.3 Landscape disruption
- Overview on factors of disruption
- 14.4 Industry risks
- Impact of key risks on business
15 Competitive Analysis
- 15.1 Companies profiled
- Companies covered
- 15.2 Company ranking index
- Company ranking index
- 15.3 Market positioning of companies
- Matrix on companies position and classification
- 15.4 Advanced Micro Devices Inc.
- Advanced Micro Devices Inc. - Overview
- Advanced Micro Devices Inc. - Business segments
- Advanced Micro Devices Inc. - Key news
- Advanced Micro Devices Inc. - Key offerings
- Advanced Micro Devices Inc. - Segment focus
- SWOT
- 15.5 Apple Inc.
- Apple Inc. - Overview
- Apple Inc. - Business segments
- Apple Inc. - Key news
- Apple Inc. - Key offerings
- Apple Inc. - Segment focus
- SWOT
- 15.6 Axelera AI B.V.
- Axelera AI B.V. - Overview
- Axelera AI B.V. - Product / Service
- Axelera AI B.V. - Key offerings
- SWOT
- 15.7 BrainChip Holdings Ltd
- BrainChip Holdings Ltd - Overview
- BrainChip Holdings Ltd - Product / Service
- BrainChip Holdings Ltd - Key offerings
- SWOT
- 15.8 Graphcore Ltd.
- Graphcore Ltd. - Overview
- Graphcore Ltd. - Product / Service
- Graphcore Ltd. - Key offerings
- SWOT
- 15.9 Hailo Technologies Ltd
- Hailo Technologies Ltd - Overview
- Hailo Technologies Ltd - Product / Service
- Hailo Technologies Ltd - Key offerings
- SWOT
- 15.10 Huawei Technologies Co. Ltd.
- Huawei Technologies Co. Ltd. - Overview
- Huawei Technologies Co. Ltd. - Product / Service
- Huawei Technologies Co. Ltd. - Key news
- Huawei Technologies Co. Ltd. - Key offerings
- SWOT
- 15.11 Kneron Inc.
- Kneron Inc. - Overview
- Kneron Inc. - Product / Service
- Kneron Inc. - Key offerings
- SWOT
- 15.12 MediaTek Inc.
- MediaTek Inc. - Overview
- MediaTek Inc. - Product / Service
- MediaTek Inc. - Key news
- MediaTek Inc. - Key offerings
- SWOT
- 15.13 Mythic Inc.
- Mythic Inc. - Overview
- Mythic Inc. - Product / Service
- Mythic Inc. - Key offerings
- SWOT
- 15.14 NVIDIA Corp.
- NVIDIA Corp. - Overview
- NVIDIA Corp. - Business segments
- NVIDIA Corp. - Key news
- NVIDIA Corp. - Key offerings
- NVIDIA Corp. - Segment focus
- SWOT
- 15.15 Qualcomm Inc.
- Qualcomm Inc. - Overview
- Qualcomm Inc. - Business segments
- Qualcomm Inc. - Key news
- Qualcomm Inc. - Key offerings
- Qualcomm Inc. - Segment focus
- SWOT
- 15.16 Samsung Electronics Co. Ltd.
- Samsung Electronics Co. Ltd. - Overview
- Samsung Electronics Co. Ltd. - Business segments
- Samsung Electronics Co. Ltd. - Key news
- Samsung Electronics Co. Ltd. - Key offerings
- Samsung Electronics Co. Ltd. - Segment focus
- SWOT
- 15.17 Synaptics Inc.
- Synaptics Inc. - Overview
- Synaptics Inc. - Product / Service
- Synaptics Inc. - Key offerings
- SWOT
- 15.18 Tenstorrent Inc.
- Tenstorrent Inc. - Overview
- Tenstorrent Inc. - Product / Service
- Tenstorrent Inc. - Key offerings
- SWOT
16 Appendix
- 16.1 Scope of the report
- 16.2 Inclusions and exclusions checklist
- Inclusions checklist
- Exclusions checklist
- 16.3 Currency conversion rates for US$
- Currency conversion rates for US$
- 16.4 Research methodology
- Research methodology
- 16.5 Data procurement
- Information sources
- 16.6 Data validation
- Data validation
- 16.7 Validation techniques employed for market sizing
- Validation techniques employed for market sizing
- 16.8 Data synthesis
- Data synthesis
- 16.9 360 degree market analysis
- 360 degree market analysis
- 16.10 List of abbreviations
- List of abbreviations

