|
|
市場調査レポート
商品コード
1769520
ペプチド合成の世界市場 2025年~2029年Global Peptide Synthesis Market 2025-2029 |
||||||
|
|||||||
カスタマイズ可能
|
|||||||


| ペプチド合成の世界市場 2025年~2029年 |
|
出版日: 2025年07月03日
発行: TechNavio
ページ情報: 英文 228 Pages
納期: 即納可能
|

全表示
- 概要
- 図表
- 目次
ペプチド合成市場は2024年~2029年に4億6,990万米ドル、予測期間中のCAGRは8.1%で成長すると予測されます。
当レポートでは、ペプチド合成市場の全体的な分析、市場規模・予測、動向、成長促進要因、課題、約25のベンダーを網羅したベンダー分析などを掲載しています。
現在の市場シナリオ、最新動向と促進要因、市場環境全体に関する最新分析を提供しています。市場は、ペプチド医薬品の急成長する治療パイプラインと商業的成功、合成と精製における技術進歩、専門受託機関への戦略的アウトソーシングの増加によって牽引されています。
| 市場範囲 | |
|---|---|
| 基準年 | 2025年 |
| 終了年 | 2029年 |
| 予測期間 | 2025年~2029年 |
| 成長モメンタム | 加速 |
| 前年比 | 7.5% |
| CAGR | 8.1% |
| 増分額 | 4億6,990万米ドル |
本調査は、業界の主要参加者からのインプットを含め、一次情報と二次情報を客観的に組み合わせて実施しました。レポートには、主要企業の分析に加え、包括的な市場規模データ、地域別分析によるセグメント、ベンダー情勢が含まれています。レポートには過去データと予測データがあります。
本調査では、グリーンケミストリーと持続可能な合成が、今後数年間のペプチド合成市場の成長を促進する主要な理由の1つであることを明らかにしています。また、分子の複雑化とペプチドコンジュゲートの増加、製造における戦略的統合と垂直統合が市場の大きな需要につながります。
目次
第1章 エグゼクティブサマリー
- 市場概要
第2章 Technavio分析
- 価格・ライフサイクル・顧客購入バスケット・採用率・購入基準の分析
- インプットの重要性と差別化の要因
- 混乱の要因
- 促進要因と課題の影響
第3章 市場情勢
- 市場エコシステム
- 市場の特徴
- バリューチェーン分析
第4章 市場規模
- 市場の定義
- 市場セグメント分析
- 市場規模 2024年
- 市場の見通し 2024年~2029年
第5章 市場規模実績
- ペプチド合成の世界市場 2019年~2023年
- 製品別セグメント分析 2019年~2023年
- 技術別セグメント分析 2019年~2023年
- 用途別セグメント分析 2019年~2023年
- 地域別セグメント分析 2019年~2023年
- 国別セグメント分析 2019年~2023年
第6章 ファイブフォース分析
- ファイブフォースの要約
- 買い手の交渉力
- 供給企業の交渉力
- 新規参入業者の脅威
- 代替品の脅威
- 競争の脅威
- 市況
第7章 市場セグメンテーション:製品別
- 市場セグメント
- 比較:製品別
- 消耗品:市場規模と予測 2024年~2029年
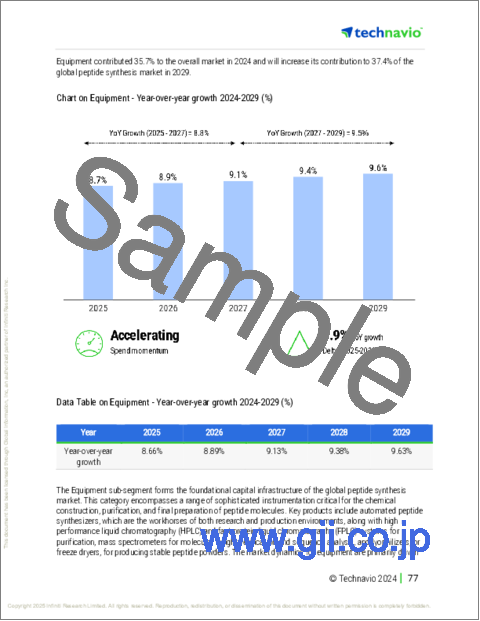
- 装置:市場規模と予測 2024年~2029年
- サービス:市場規模と予測 2024年~2029年
- 市場機会:製品別
第8章 市場セグメンテーション:技術別
- 市場セグメント
- 比較:技術別
- 化学薬品:市場規模と予測 2024年~2029年
- 生物学的:市場規模と予測 2024年~2029年
- 市場機会:技術別
第9章 市場セグメンテーション:用途別
- 市場セグメント
- 比較:用途別
- 治療的:市場規模と予測 2024年~2029年
- 診断:市場規模と予測 2024年~2029年
- 研究:市場規模と予測 2024年~2029年
- 市場機会:用途別
第10章 顧客情勢
- 顧客情勢の概要
第11章 地域別情勢
- 地域別セグメンテーション
- 地域別比較
- 北米:市場規模と予測 2024年~2029年
- 欧州:市場規模と予測 2024年~2029年
- アジア:市場規模と予測 2024年~2029年
- 世界のその他の地域:市場規模と予測 2024年~2029年
- 米国:市場規模と予測 2024年~2029年
- 中国:市場規模と予測 2024年~2029年
- ドイツ:市場規模と予測 2024年~2029年
- 英国:市場規模と予測 2024年~2029年
- カナダ:市場規模と予測 2024年~2029年
- 日本:市場規模と予測 2024年~2029年
- インド:市場規模と予測 2024年~2029年
- フランス:市場規模と予測 2024年~2029年
- オーストラリア:市場規模と予測 2024年~2029年
- 韓国:市場規模と予測 2024年~2029年
- 市場機会:地域情勢別
第12章 促進要因・課題・機会・抑制要因
- 市場促進要因
- 市場の課題
- 促進要因と課題の影響
- 市場の機会・抑制要因
第13章 競合情勢
- 概要
- 競合情勢
- 混乱の状況
- 業界のリスク
第14章 競合分析
- 企業プロファイル
- 企業ランキング指数
- 企業の市場ポジショニング
- AnaSpec Inc.
- Bachem AG
- Bio Basic Inc.
- Biotage AB
- CPC Scientific Inc.
- GenScript Biotech Corp.
- GL Biochem
- Hybio Pharmaceutical Co. Ltd.
- JPT Peptide Technologies GmbH
- LifeTein LLC.
- PolyPeptide Group
- ScinoPharm Taiwan Ltd.
- Sigma Aldrich Chemicals Pvt. Ltd.
- Thermo Fisher Scientific Inc.
- USV Pvt Ltd
第15章 付録
Exhibits:
- Exhibits1: Executive Summary - Chart on Market Overview
- Exhibits2: Executive Summary - Data Table on Market Overview
- Exhibits3: Executive Summary - Chart on Global Market Characteristics
- Exhibits4: Executive Summary - Chart on Market By Geographical Landscape
- Exhibits5: Executive Summary - Chart on Market Segmentation by Product
- Exhibits6: Executive Summary - Chart on Market Segmentation by Technique
- Exhibits7: Executive Summary - Chart on Market Segmentation by Application
- Exhibits8: Executive Summary - Chart on Incremental Growth
- Exhibits9: Executive Summary - Data Table on Incremental Growth
- Exhibits10: Executive Summary - Chart on Company Market Positioning
- Exhibits11: Analysis of price sensitivity, lifecycle, customer purchase basket, adoption rates, and purchase criteria
- Exhibits12: Overview on criticality of inputs and factors of differentiation
- Exhibits13: Overview on factors of disruption
- Exhibits14: Impact of drivers and challenges in 2024 and 2029
- Exhibits15: Parent Market
- Exhibits16: Data Table on - Parent Market
- Exhibits17: Market characteristics analysis
- Exhibits18: Value chain analysis
- Exhibits19: Offerings of companies included in the market definition
- Exhibits20: Market segments
- Exhibits21: Chart on Global - Market size and forecast 2024-2029 ($ million)
- Exhibits22: Data Table on Global - Market size and forecast 2024-2029 ($ million)
- Exhibits23: Chart on Global Market: Year-over-year growth 2024-2029 (%)
- Exhibits24: Data Table on Global Market: Year-over-year growth 2024-2029 (%)
- Exhibits25: Historic Market Size - Data Table on Global Peptide Synthesis Market 2019 - 2023 ($ million)
- Exhibits26: Historic Market Size - Product Segment 2019 - 2023 ($ million)
- Exhibits27: Historic Market Size - Technique Segment 2019 - 2023 ($ million)
- Exhibits28: Historic Market Size - Application Segment 2019 - 2023 ($ million)
- Exhibits29: Historic Market Size - Geography Segment 2019 - 2023 ($ million)
- Exhibits30: Historic Market Size - Country Segment 2019 - 2023 ($ million)
- Exhibits31: Five forces analysis - Comparison between 2024 and 2029
- Exhibits32: Bargaining power of buyers - Impact of key factors 2024 and 2029
- Exhibits33: Bargaining power of suppliers - Impact of key factors in 2024 and 2029
- Exhibits34: Threat of new entrants - Impact of key factors in 2024 and 2029
- Exhibits35: Threat of substitutes - Impact of key factors in 2024 and 2029
- Exhibits36: Threat of rivalry - Impact of key factors in 2024 and 2029
- Exhibits37: Chart on Market condition - Five forces 2024 and 2029
- Exhibits38: Chart on Product - Market share 2024-2029 (%)
- Exhibits39: Data Table on Product - Market share 2024-2029 (%)
- Exhibits40: Chart on Comparison by Product
- Exhibits41: Data Table on Comparison by Product
- Exhibits42: Chart on Consumables - Market size and forecast 2024-2029 ($ million)
- Exhibits43: Data Table on Consumables - Market size and forecast 2024-2029 ($ million)
- Exhibits44: Chart on Consumables - Year-over-year growth 2024-2029 (%)
- Exhibits45: Data Table on Consumables - Year-over-year growth 2024-2029 (%)
- Exhibits46: Chart on Equipment - Market size and forecast 2024-2029 ($ million)
- Exhibits47: Data Table on Equipment - Market size and forecast 2024-2029 ($ million)
- Exhibits48: Chart on Equipment - Year-over-year growth 2024-2029 (%)
- Exhibits49: Data Table on Equipment - Year-over-year growth 2024-2029 (%)
- Exhibits50: Chart on Services - Market size and forecast 2024-2029 ($ million)
- Exhibits51: Data Table on Services - Market size and forecast 2024-2029 ($ million)
- Exhibits52: Chart on Services - Year-over-year growth 2024-2029 (%)
- Exhibits53: Data Table on Services - Year-over-year growth 2024-2029 (%)
- Exhibits54: Market opportunity by Product ($ million)
- Exhibits55: Data Table on Market opportunity by Product ($ million)
- Exhibits56: Chart on Technique - Market share 2024-2029 (%)
- Exhibits57: Data Table on Technique - Market share 2024-2029 (%)
- Exhibits58: Chart on Comparison by Technique
- Exhibits59: Data Table on Comparison by Technique
- Exhibits60: Chart on Chemical - Market size and forecast 2024-2029 ($ million)
- Exhibits61: Data Table on Chemical - Market size and forecast 2024-2029 ($ million)
- Exhibits62: Chart on Chemical - Year-over-year growth 2024-2029 (%)
- Exhibits63: Data Table on Chemical - Year-over-year growth 2024-2029 (%)
- Exhibits64: Chart on Biological - Market size and forecast 2024-2029 ($ million)
- Exhibits65: Data Table on Biological - Market size and forecast 2024-2029 ($ million)
- Exhibits66: Chart on Biological - Year-over-year growth 2024-2029 (%)
- Exhibits67: Data Table on Biological - Year-over-year growth 2024-2029 (%)
- Exhibits68: Market opportunity by Technique ($ million)
- Exhibits69: Data Table on Market opportunity by Technique ($ million)
- Exhibits70: Chart on Application - Market share 2024-2029 (%)
- Exhibits71: Data Table on Application - Market share 2024-2029 (%)
- Exhibits72: Chart on Comparison by Application
- Exhibits73: Data Table on Comparison by Application
- Exhibits74: Chart on Therapeutic - Market size and forecast 2024-2029 ($ million)
- Exhibits75: Data Table on Therapeutic - Market size and forecast 2024-2029 ($ million)
- Exhibits76: Chart on Therapeutic - Year-over-year growth 2024-2029 (%)
- Exhibits77: Data Table on Therapeutic - Year-over-year growth 2024-2029 (%)
- Exhibits78: Chart on Diagnostic - Market size and forecast 2024-2029 ($ million)
- Exhibits79: Data Table on Diagnostic - Market size and forecast 2024-2029 ($ million)
- Exhibits80: Chart on Diagnostic - Year-over-year growth 2024-2029 (%)
- Exhibits81: Data Table on Diagnostic - Year-over-year growth 2024-2029 (%)
- Exhibits82: Chart on Research - Market size and forecast 2024-2029 ($ million)
- Exhibits83: Data Table on Research - Market size and forecast 2024-2029 ($ million)
- Exhibits84: Chart on Research - Year-over-year growth 2024-2029 (%)
- Exhibits85: Data Table on Research - Year-over-year growth 2024-2029 (%)
- Exhibits86: Market opportunity by Application ($ million)
- Exhibits87: Data Table on Market opportunity by Application ($ million)
- Exhibits88: Analysis of price sensitivity, lifecycle, customer purchase basket, adoption rates, and purchase criteria
- Exhibits89: Chart on Market share By Geographical Landscape 2024-2029 (%)
- Exhibits90: Data Table on Market share By Geographical Landscape 2024-2029 (%)
- Exhibits91: Chart on Geographic comparison
- Exhibits92: Data Table on Geographic comparison
- Exhibits93: Chart on North America - Market size and forecast 2024-2029 ($ million)
- Exhibits94: Data Table on North America - Market size and forecast 2024-2029 ($ million)
- Exhibits95: Chart on North America - Year-over-year growth 2024-2029 (%)
- Exhibits96: Data Table on North America - Year-over-year growth 2024-2029 (%)
- Exhibits97: Chart on Europe - Market size and forecast 2024-2029 ($ million)
- Exhibits98: Data Table on Europe - Market size and forecast 2024-2029 ($ million)
- Exhibits99: Chart on Europe - Year-over-year growth 2024-2029 (%)
- Exhibits100: Data Table on Europe - Year-over-year growth 2024-2029 (%)
- Exhibits101: Chart on Asia - Market size and forecast 2024-2029 ($ million)
- Exhibits102: Data Table on Asia - Market size and forecast 2024-2029 ($ million)
- Exhibits103: Chart on Asia - Year-over-year growth 2024-2029 (%)
- Exhibits104: Data Table on Asia - Year-over-year growth 2024-2029 (%)
- Exhibits105: Chart on Rest of World (ROW) - Market size and forecast 2024-2029 ($ million)
- Exhibits106: Data Table on Rest of World (ROW) - Market size and forecast 2024-2029 ($ million)
- Exhibits107: Chart on Rest of World (ROW) - Year-over-year growth 2024-2029 (%)
- Exhibits108: Data Table on Rest of World (ROW) - Year-over-year growth 2024-2029 (%)
- Exhibits109: Chart on US - Market size and forecast 2024-2029 ($ million)
- Exhibits110: Data Table on US - Market size and forecast 2024-2029 ($ million)
- Exhibits111: Chart on US - Year-over-year growth 2024-2029 (%)
- Exhibits112: Data Table on US - Year-over-year growth 2024-2029 (%)
- Exhibits113: Chart on China - Market size and forecast 2024-2029 ($ million)
- Exhibits114: Data Table on China - Market size and forecast 2024-2029 ($ million)
- Exhibits115: Chart on China - Year-over-year growth 2024-2029 (%)
- Exhibits116: Data Table on China - Year-over-year growth 2024-2029 (%)
- Exhibits117: Chart on Germany - Market size and forecast 2024-2029 ($ million)
- Exhibits118: Data Table on Germany - Market size and forecast 2024-2029 ($ million)
- Exhibits119: Chart on Germany - Year-over-year growth 2024-2029 (%)
- Exhibits120: Data Table on Germany - Year-over-year growth 2024-2029 (%)
- Exhibits121: Chart on UK - Market size and forecast 2024-2029 ($ million)
- Exhibits122: Data Table on UK - Market size and forecast 2024-2029 ($ million)
- Exhibits123: Chart on UK - Year-over-year growth 2024-2029 (%)
- Exhibits124: Data Table on UK - Year-over-year growth 2024-2029 (%)
- Exhibits125: Chart on Canada - Market size and forecast 2024-2029 ($ million)
- Exhibits126: Data Table on Canada - Market size and forecast 2024-2029 ($ million)
- Exhibits127: Chart on Canada - Year-over-year growth 2024-2029 (%)
- Exhibits128: Data Table on Canada - Year-over-year growth 2024-2029 (%)
- Exhibits129: Chart on Japan - Market size and forecast 2024-2029 ($ million)
- Exhibits130: Data Table on Japan - Market size and forecast 2024-2029 ($ million)
- Exhibits131: Chart on Japan - Year-over-year growth 2024-2029 (%)
- Exhibits132: Data Table on Japan - Year-over-year growth 2024-2029 (%)
- Exhibits133: Chart on India - Market size and forecast 2024-2029 ($ million)
- Exhibits134: Data Table on India - Market size and forecast 2024-2029 ($ million)
- Exhibits135: Chart on India - Year-over-year growth 2024-2029 (%)
- Exhibits136: Data Table on India - Year-over-year growth 2024-2029 (%)
- Exhibits137: Chart on France - Market size and forecast 2024-2029 ($ million)
- Exhibits138: Data Table on France - Market size and forecast 2024-2029 ($ million)
- Exhibits139: Chart on France - Year-over-year growth 2024-2029 (%)
- Exhibits140: Data Table on France - Year-over-year growth 2024-2029 (%)
- Exhibits141: Chart on Australia - Market size and forecast 2024-2029 ($ million)
- Exhibits142: Data Table on Australia - Market size and forecast 2024-2029 ($ million)
- Exhibits143: Chart on Australia - Year-over-year growth 2024-2029 (%)
- Exhibits144: Data Table on Australia - Year-over-year growth 2024-2029 (%)
- Exhibits145: Chart on South Korea - Market size and forecast 2024-2029 ($ million)
- Exhibits146: Data Table on South Korea - Market size and forecast 2024-2029 ($ million)
- Exhibits147: Chart on South Korea - Year-over-year growth 2024-2029 (%)
- Exhibits148: Data Table on South Korea - Year-over-year growth 2024-2029 (%)
- Exhibits149: Market opportunity By Geographical Landscape ($ million)
- Exhibits150: Data Tables on Market opportunity By Geographical Landscape ($ million)
- Exhibits151: Impact of drivers and challenges in 2024 and 2029
- Exhibits152: Overview on criticality of inputs and factors of differentiation
- Exhibits153: Overview on factors of disruption
- Exhibits154: Impact of key risks on business
- Exhibits155: Companies covered
- Exhibits156: Company ranking index
- Exhibits157: Matrix on companies position and classification
- Exhibits158: AnaSpec Inc. - Overview
- Exhibits159: AnaSpec Inc. - Product / Service
- Exhibits160: AnaSpec Inc. - Key offerings
- Exhibits161: SWOT
- Exhibits162: Bachem AG - Overview
- Exhibits163: Bachem AG - Business segments
- Exhibits164: Bachem AG - Key offerings
- Exhibits165: Bachem AG - Segment focus
- Exhibits166: SWOT
- Exhibits167: Bio Basic Inc. - Overview
- Exhibits168: Bio Basic Inc. - Product / Service
- Exhibits169: Bio Basic Inc. - Key offerings
- Exhibits170: SWOT
- Exhibits171: Biotage AB - Overview
- Exhibits172: Biotage AB - Product / Service
- Exhibits173: Biotage AB - Key offerings
- Exhibits174: SWOT
- Exhibits175: CPC Scientific Inc. - Overview
- Exhibits176: CPC Scientific Inc. - Product / Service
- Exhibits177: CPC Scientific Inc. - Key offerings
- Exhibits178: SWOT
- Exhibits179: GenScript Biotech Corp. - Overview
- Exhibits180: GenScript Biotech Corp. - Business segments
- Exhibits181: GenScript Biotech Corp. - Key news
- Exhibits182: GenScript Biotech Corp. - Key offerings
- Exhibits183: GenScript Biotech Corp. - Segment focus
- Exhibits184: SWOT
- Exhibits185: GL Biochem - Overview
- Exhibits186: GL Biochem - Product / Service
- Exhibits187: GL Biochem - Key offerings
- Exhibits188: SWOT
- Exhibits189: Hybio Pharmaceutical Co. Ltd. - Overview
- Exhibits190: Hybio Pharmaceutical Co. Ltd. - Product / Service
- Exhibits191: Hybio Pharmaceutical Co. Ltd. - Key offerings
- Exhibits192: SWOT
- Exhibits193: JPT Peptide Technologies GmbH - Overview
- Exhibits194: JPT Peptide Technologies GmbH - Product / Service
- Exhibits195: JPT Peptide Technologies GmbH - Key offerings
- Exhibits196: SWOT
- Exhibits197: LifeTein LLC. - Overview
- Exhibits198: LifeTein LLC. - Product / Service
- Exhibits199: LifeTein LLC. - Key offerings
- Exhibits200: SWOT
- Exhibits201: PolyPeptide Group - Overview
- Exhibits202: PolyPeptide Group - Product / Service
- Exhibits203: PolyPeptide Group - Key offerings
- Exhibits204: SWOT
- Exhibits205: ScinoPharm Taiwan Ltd. - Overview
- Exhibits206: ScinoPharm Taiwan Ltd. - Product / Service
- Exhibits207: ScinoPharm Taiwan Ltd. - Key offerings
- Exhibits208: SWOT
- Exhibits209: Sigma Aldrich Chemicals Pvt. Ltd. - Overview
- Exhibits210: Sigma Aldrich Chemicals Pvt. Ltd. - Product / Service
- Exhibits211: Sigma Aldrich Chemicals Pvt. Ltd. - Key offerings
- Exhibits212: SWOT
- Exhibits213: Thermo Fisher Scientific Inc. - Overview
- Exhibits214: Thermo Fisher Scientific Inc. - Business segments
- Exhibits215: Thermo Fisher Scientific Inc. - Key news
- Exhibits216: Thermo Fisher Scientific Inc. - Key offerings
- Exhibits217: Thermo Fisher Scientific Inc. - Segment focus
- Exhibits218: SWOT
- Exhibits219: USV Pvt Ltd - Overview
- Exhibits220: USV Pvt Ltd - Product / Service
- Exhibits221: USV Pvt Ltd - Key offerings
- Exhibits222: SWOT
- Exhibits223: Inclusions checklist
- Exhibits224: Exclusions checklist
- Exhibits225: Currency conversion rates for US$
- Exhibits226: Research methodology
- Exhibits227: Information sources
- Exhibits228: Data validation
- Exhibits229: Validation techniques employed for market sizing
- Exhibits230: Data synthesis
- Exhibits231: 360 degree market analysis
- Exhibits232: List of abbreviations
The peptide synthesis market is forecasted to grow by USD 469.9 mn during 2024-2029, accelerating at a CAGR of 8.1% during the forecast period. The report on the peptide synthesis market provides a holistic analysis, market size and forecast, trends, growth drivers, and challenges, as well as vendor analysis covering around 25 vendors.
The report offers an up-to-date analysis regarding the current market scenario, the latest trends and drivers, and the overall market environment. The market is driven by burgeoning therapeutic pipeline and commercial success of peptide drugs, technological advancements in synthesis and purification, and increasing strategic outsourcing to specialized contract organizations.
| Market Scope | |
|---|---|
| Base Year | 2025 |
| End Year | 2029 |
| Series Year | 2025-2029 |
| Growth Momentum | Accelerate |
| YOY 2025 | 7.5% |
| CAGR | 8.1% |
| Incremental Value | $469.9 mn |
The study was conducted using an objective combination of primary and secondary information including inputs from key participants in the industry. The report contains a comprehensive market size data, segment with regional analysis and vendor landscape in addition to an analysis of the key companies. Reports have historic and forecast data.
Technavio's peptide synthesis market is segmented as below:
By Product
- Consumables
- Equipment
- Services
By Technique
- Chemical
- Biological
By Application
- Therapeutic
- Diagnostic
- Research
By Geographical Landscape
- North America
- Europe
- Asia
- Rest of World (ROW)
This study identifies the imperative of green chemistry and sustainable synthesis as one of the prime reasons driving the peptide synthesis market growth during the next few years. Also, ascendancy of molecular complexity and peptide conjugates and strategic consolidation and vertical integration in manufacturing will lead to sizable demand in the market.
The report on the peptide synthesis market covers the following areas:
- Peptide Synthesis Market sizing
- Peptide Synthesis Market forecast
- Peptide Synthesis Market industry analysis
The robust vendor analysis is designed to help clients improve their market position, and in line with this, this report provides a detailed analysis of several leading peptide synthesis market vendors that include AnaSpec Inc., Bachem AG, Bio Basic Inc., Biomatik Corp., Biosynth Ltd., Biotage AB, CPC Scientific Inc., Creative Peptides., GenScript Biotech Corp., GL Biochem, Hybio Pharmaceutical Co. Ltd., JPT Peptide Technologies GmbH, LifeTein LLC., PolyPeptide Group, ProImmune Ltd., ScinoPharm Taiwan Ltd., Sigma Aldrich Chemicals Pvt. Ltd., Thermo Fisher Scientific Inc., and USV Pvt Ltd. Also, the peptide synthesis market analysis report includes information on upcoming trends and challenges that will influence market growth. This is to help companies strategize and leverage all forthcoming growth opportunities.
The publisher presents a detailed picture of the market by the way of study, synthesis, and summation of data from multiple sources by an analysis of key parameters such as profit, pricing, competition, and promotions. It presents various market facets by identifying the key industry influencers. The data presented is comprehensive, reliable, and a result of extensive primary and secondary research. The market research reports provide a complete competitive landscape and an in-depth vendor selection methodology and analysis using qualitative and quantitative research to forecast accurate market growth.
Table of Contents
1 Executive Summary
- 1.1 Market overview
- Executive Summary - Chart on Market Overview
- Executive Summary - Data Table on Market Overview
- Executive Summary - Chart on Global Market Characteristics
- Executive Summary - Chart on Market By Geographical Landscape
- Executive Summary - Chart on Market Segmentation by Product
- Executive Summary - Chart on Market Segmentation by Technique
- Executive Summary - Chart on Market Segmentation by Application
- Executive Summary - Chart on Incremental Growth
- Executive Summary - Data Table on Incremental Growth
- Executive Summary - Chart on Company Market Positioning
2 Technavio Analysis
- 2.1 Analysis of price sensitivity, lifecycle, customer purchase basket, adoption rates, and purchase criteria
- Analysis of price sensitivity, lifecycle, customer purchase basket, adoption rates, and purchase criteria
- 2.2 Criticality of inputs and Factors of differentiation
- Overview on criticality of inputs and factors of differentiation
- 2.3 Factors of disruption
- Overview on factors of disruption
- 2.4 Impact of drivers and challenges
- Impact of drivers and challenges in 2024 and 2029
3 Market Landscape
- 3.1 Market ecosystem
- Parent Market
- Data Table on - Parent Market
- 3.2 Market characteristics
- Market characteristics analysis
- 3.3 Value chain analysis
- Value chain analysis
4 Market Sizing
- 4.1 Market definition
- Offerings of companies included in the market definition
- 4.2 Market segment analysis
- Market segments
- 4.3 Market size 2024
- 4.4 Market outlook: Forecast for 2024-2029
- Chart on Global - Market size and forecast 2024-2029 ($ million)
- Data Table on Global - Market size and forecast 2024-2029 ($ million)
- Chart on Global Market: Year-over-year growth 2024-2029 (%)
- Data Table on Global Market: Year-over-year growth 2024-2029 (%)
5 Historic Market Size
- 5.1 Global Peptide Synthesis Market 2019 - 2023
- Historic Market Size - Data Table on Global Peptide Synthesis Market 2019 - 2023 ($ million)
- 5.2 Product segment analysis 2019 - 2023
- Historic Market Size - Product Segment 2019 - 2023 ($ million)
- 5.3 Technique segment analysis 2019 - 2023
- Historic Market Size - Technique Segment 2019 - 2023 ($ million)
- 5.4 Application segment analysis 2019 - 2023
- Historic Market Size - Application Segment 2019 - 2023 ($ million)
- 5.5 Geography segment analysis 2019 - 2023
- Historic Market Size - Geography Segment 2019 - 2023 ($ million)
- 5.6 Country segment analysis 2019 - 2023
- Historic Market Size - Country Segment 2019 - 2023 ($ million)
6 Five Forces Analysis
- 6.1 Five forces summary
- Five forces analysis - Comparison between 2024 and 2029
- 6.2 Bargaining power of buyers
- Bargaining power of buyers - Impact of key factors 2024 and 2029
- 6.3 Bargaining power of suppliers
- Bargaining power of suppliers - Impact of key factors in 2024 and 2029
- 6.4 Threat of new entrants
- Threat of new entrants - Impact of key factors in 2024 and 2029
- 6.5 Threat of substitutes
- Threat of substitutes - Impact of key factors in 2024 and 2029
- 6.6 Threat of rivalry
- Threat of rivalry - Impact of key factors in 2024 and 2029
- 6.7 Market condition
- Chart on Market condition - Five forces 2024 and 2029
7 Market Segmentation by Product
- 7.1 Market segments
- Chart on Product - Market share 2024-2029 (%)
- Data Table on Product - Market share 2024-2029 (%)
- 7.2 Comparison by Product
- Chart on Comparison by Product
- Data Table on Comparison by Product
- 7.3 Consumables - Market size and forecast 2024-2029
- Chart on Consumables - Market size and forecast 2024-2029 ($ million)
- Data Table on Consumables - Market size and forecast 2024-2029 ($ million)
- Chart on Consumables - Year-over-year growth 2024-2029 (%)
- Data Table on Consumables - Year-over-year growth 2024-2029 (%)
- 7.4 Equipment - Market size and forecast 2024-2029
- Chart on Equipment - Market size and forecast 2024-2029 ($ million)
- Data Table on Equipment - Market size and forecast 2024-2029 ($ million)
- Chart on Equipment - Year-over-year growth 2024-2029 (%)
- Data Table on Equipment - Year-over-year growth 2024-2029 (%)
- 7.5 Services - Market size and forecast 2024-2029
- Chart on Services - Market size and forecast 2024-2029 ($ million)
- Data Table on Services - Market size and forecast 2024-2029 ($ million)
- Chart on Services - Year-over-year growth 2024-2029 (%)
- Data Table on Services - Year-over-year growth 2024-2029 (%)
- 7.6 Market opportunity by Product
- Market opportunity by Product ($ million)
- Data Table on Market opportunity by Product ($ million)
8 Market Segmentation by Technique
- 8.1 Market segments
- Chart on Technique - Market share 2024-2029 (%)
- Data Table on Technique - Market share 2024-2029 (%)
- 8.2 Comparison by Technique
- Chart on Comparison by Technique
- Data Table on Comparison by Technique
- 8.3 Chemical - Market size and forecast 2024-2029
- Chart on Chemical - Market size and forecast 2024-2029 ($ million)
- Data Table on Chemical - Market size and forecast 2024-2029 ($ million)
- Chart on Chemical - Year-over-year growth 2024-2029 (%)
- Data Table on Chemical - Year-over-year growth 2024-2029 (%)
- 8.4 Biological - Market size and forecast 2024-2029
- Chart on Biological - Market size and forecast 2024-2029 ($ million)
- Data Table on Biological - Market size and forecast 2024-2029 ($ million)
- Chart on Biological - Year-over-year growth 2024-2029 (%)
- Data Table on Biological - Year-over-year growth 2024-2029 (%)
- 8.5 Market opportunity by Technique
- Market opportunity by Technique ($ million)
- Data Table on Market opportunity by Technique ($ million)
9 Market Segmentation by Application
- 9.1 Market segments
- Chart on Application - Market share 2024-2029 (%)
- Data Table on Application - Market share 2024-2029 (%)
- 9.2 Comparison by Application
- Chart on Comparison by Application
- Data Table on Comparison by Application
- 9.3 Therapeutic - Market size and forecast 2024-2029
- Chart on Therapeutic - Market size and forecast 2024-2029 ($ million)
- Data Table on Therapeutic - Market size and forecast 2024-2029 ($ million)
- Chart on Therapeutic - Year-over-year growth 2024-2029 (%)
- Data Table on Therapeutic - Year-over-year growth 2024-2029 (%)
- 9.4 Diagnostic - Market size and forecast 2024-2029
- Chart on Diagnostic - Market size and forecast 2024-2029 ($ million)
- Data Table on Diagnostic - Market size and forecast 2024-2029 ($ million)
- Chart on Diagnostic - Year-over-year growth 2024-2029 (%)
- Data Table on Diagnostic - Year-over-year growth 2024-2029 (%)
- 9.5 Research - Market size and forecast 2024-2029
- Chart on Research - Market size and forecast 2024-2029 ($ million)
- Data Table on Research - Market size and forecast 2024-2029 ($ million)
- Chart on Research - Year-over-year growth 2024-2029 (%)
- Data Table on Research - Year-over-year growth 2024-2029 (%)
- 9.6 Market opportunity by Application
- Market opportunity by Application ($ million)
- Data Table on Market opportunity by Application ($ million)
10 Customer Landscape
- 10.1 Customer landscape overview
- Analysis of price sensitivity, lifecycle, customer purchase basket, adoption rates, and purchase criteria
11 Geographic Landscape
- 11.1 Geographic segmentation
- Chart on Market share By Geographical Landscape 2024-2029 (%)
- Data Table on Market share By Geographical Landscape 2024-2029 (%)
- 11.2 Geographic comparison
- Chart on Geographic comparison
- Data Table on Geographic comparison
- 11.3 North America - Market size and forecast 2024-2029
- Chart on North America - Market size and forecast 2024-2029 ($ million)
- Data Table on North America - Market size and forecast 2024-2029 ($ million)
- Chart on North America - Year-over-year growth 2024-2029 (%)
- Data Table on North America - Year-over-year growth 2024-2029 (%)
- 11.4 Europe - Market size and forecast 2024-2029
- Chart on Europe - Market size and forecast 2024-2029 ($ million)
- Data Table on Europe - Market size and forecast 2024-2029 ($ million)
- Chart on Europe - Year-over-year growth 2024-2029 (%)
- Data Table on Europe - Year-over-year growth 2024-2029 (%)
- 11.5 Asia - Market size and forecast 2024-2029
- Chart on Asia - Market size and forecast 2024-2029 ($ million)
- Data Table on Asia - Market size and forecast 2024-2029 ($ million)
- Chart on Asia - Year-over-year growth 2024-2029 (%)
- Data Table on Asia - Year-over-year growth 2024-2029 (%)
- 11.6 Rest of World (ROW) - Market size and forecast 2024-2029
- Chart on Rest of World (ROW) - Market size and forecast 2024-2029 ($ million)
- Data Table on Rest of World (ROW) - Market size and forecast 2024-2029 ($ million)
- Chart on Rest of World (ROW) - Year-over-year growth 2024-2029 (%)
- Data Table on Rest of World (ROW) - Year-over-year growth 2024-2029 (%)
- 11.7 US - Market size and forecast 2024-2029
- Chart on US - Market size and forecast 2024-2029 ($ million)
- Data Table on US - Market size and forecast 2024-2029 ($ million)
- Chart on US - Year-over-year growth 2024-2029 (%)
- Data Table on US - Year-over-year growth 2024-2029 (%)
- 11.8 China - Market size and forecast 2024-2029
- Chart on China - Market size and forecast 2024-2029 ($ million)
- Data Table on China - Market size and forecast 2024-2029 ($ million)
- Chart on China - Year-over-year growth 2024-2029 (%)
- Data Table on China - Year-over-year growth 2024-2029 (%)
- 11.9 Germany - Market size and forecast 2024-2029
- Chart on Germany - Market size and forecast 2024-2029 ($ million)
- Data Table on Germany - Market size and forecast 2024-2029 ($ million)
- Chart on Germany - Year-over-year growth 2024-2029 (%)
- Data Table on Germany - Year-over-year growth 2024-2029 (%)
- 11.10 UK - Market size and forecast 2024-2029
- Chart on UK - Market size and forecast 2024-2029 ($ million)
- Data Table on UK - Market size and forecast 2024-2029 ($ million)
- Chart on UK - Year-over-year growth 2024-2029 (%)
- Data Table on UK - Year-over-year growth 2024-2029 (%)
- 11.11 Canada - Market size and forecast 2024-2029
- Chart on Canada - Market size and forecast 2024-2029 ($ million)
- Data Table on Canada - Market size and forecast 2024-2029 ($ million)
- Chart on Canada - Year-over-year growth 2024-2029 (%)
- Data Table on Canada - Year-over-year growth 2024-2029 (%)
- 11.12 Japan - Market size and forecast 2024-2029
- Chart on Japan - Market size and forecast 2024-2029 ($ million)
- Data Table on Japan - Market size and forecast 2024-2029 ($ million)
- Chart on Japan - Year-over-year growth 2024-2029 (%)
- Data Table on Japan - Year-over-year growth 2024-2029 (%)
- 11.13 India - Market size and forecast 2024-2029
- Chart on India - Market size and forecast 2024-2029 ($ million)
- Data Table on India - Market size and forecast 2024-2029 ($ million)
- Chart on India - Year-over-year growth 2024-2029 (%)
- Data Table on India - Year-over-year growth 2024-2029 (%)
- 11.14 France - Market size and forecast 2024-2029
- Chart on France - Market size and forecast 2024-2029 ($ million)
- Data Table on France - Market size and forecast 2024-2029 ($ million)
- Chart on France - Year-over-year growth 2024-2029 (%)
- Data Table on France - Year-over-year growth 2024-2029 (%)
- 11.15 Australia - Market size and forecast 2024-2029
- Chart on Australia - Market size and forecast 2024-2029 ($ million)
- Data Table on Australia - Market size and forecast 2024-2029 ($ million)
- Chart on Australia - Year-over-year growth 2024-2029 (%)
- Data Table on Australia - Year-over-year growth 2024-2029 (%)
- 11.16 South Korea - Market size and forecast 2024-2029
- Chart on South Korea - Market size and forecast 2024-2029 ($ million)
- Data Table on South Korea - Market size and forecast 2024-2029 ($ million)
- Chart on South Korea - Year-over-year growth 2024-2029 (%)
- Data Table on South Korea - Year-over-year growth 2024-2029 (%)
- 11.17 Market opportunity By Geographical Landscape
- Market opportunity By Geographical Landscape ($ million)
- Data Tables on Market opportunity By Geographical Landscape ($ million)
12 Drivers, Challenges, and Opportunity/Restraints
- 12.1 Market drivers
- 12.2 Market challenges
- 12.3 Impact of drivers and challenges
- Impact of drivers and challenges in 2024 and 2029
- 12.4 Market opportunities/restraints
13 Competitive Landscape
- 13.1 Overview
- 13.2 Competitive Landscape
- Overview on criticality of inputs and factors of differentiation
- 13.3 Landscape disruption
- Overview on factors of disruption
- 13.4 Industry risks
- Impact of key risks on business
14 Competitive Analysis
- 14.1 Companies profiled
- Companies covered
- 14.2 Company ranking index
- Company ranking index
- 14.3 Market positioning of companies
- Matrix on companies position and classification
- 14.4 AnaSpec Inc.
- AnaSpec Inc. - Overview
- AnaSpec Inc. - Product / Service
- AnaSpec Inc. - Key offerings
- SWOT
- 14.5 Bachem AG
- Bachem AG - Overview
- Bachem AG - Business segments
- Bachem AG - Key offerings
- Bachem AG - Segment focus
- SWOT
- 14.6 Bio Basic Inc.
- Bio Basic Inc. - Overview
- Bio Basic Inc. - Product / Service
- Bio Basic Inc. - Key offerings
- SWOT
- 14.7 Biotage AB
- Biotage AB - Overview
- Biotage AB - Product / Service
- Biotage AB - Key offerings
- SWOT
- 14.8 CPC Scientific Inc.
- CPC Scientific Inc. - Overview
- CPC Scientific Inc. - Product / Service
- CPC Scientific Inc. - Key offerings
- SWOT
- 14.9 GenScript Biotech Corp.
- GenScript Biotech Corp. - Overview
- GenScript Biotech Corp. - Business segments
- GenScript Biotech Corp. - Key news
- GenScript Biotech Corp. - Key offerings
- GenScript Biotech Corp. - Segment focus
- SWOT
- 14.10 GL Biochem
- GL Biochem - Overview
- GL Biochem - Product / Service
- GL Biochem - Key offerings
- SWOT
- 14.11 Hybio Pharmaceutical Co. Ltd.
- Hybio Pharmaceutical Co. Ltd. - Overview
- Hybio Pharmaceutical Co. Ltd. - Product / Service
- Hybio Pharmaceutical Co. Ltd. - Key offerings
- SWOT
- 14.12 JPT Peptide Technologies GmbH
- JPT Peptide Technologies GmbH - Overview
- JPT Peptide Technologies GmbH - Product / Service
- JPT Peptide Technologies GmbH - Key offerings
- SWOT
- 14.13 LifeTein LLC.
- LifeTein LLC. - Overview
- LifeTein LLC. - Product / Service
- LifeTein LLC. - Key offerings
- SWOT
- 14.14 PolyPeptide Group
- PolyPeptide Group - Overview
- PolyPeptide Group - Product / Service
- PolyPeptide Group - Key offerings
- SWOT
- 14.15 ScinoPharm Taiwan Ltd.
- ScinoPharm Taiwan Ltd. - Overview
- ScinoPharm Taiwan Ltd. - Product / Service
- ScinoPharm Taiwan Ltd. - Key offerings
- SWOT
- 14.16 Sigma Aldrich Chemicals Pvt. Ltd.
- Sigma Aldrich Chemicals Pvt. Ltd. - Overview
- Sigma Aldrich Chemicals Pvt. Ltd. - Product / Service
- Sigma Aldrich Chemicals Pvt. Ltd. - Key offerings
- SWOT
- 14.17 Thermo Fisher Scientific Inc.
- Thermo Fisher Scientific Inc. - Overview
- Thermo Fisher Scientific Inc. - Business segments
- Thermo Fisher Scientific Inc. - Key news
- Thermo Fisher Scientific Inc. - Key offerings
- Thermo Fisher Scientific Inc. - Segment focus
- SWOT
- 14.18 USV Pvt Ltd
- USV Pvt Ltd - Overview
- USV Pvt Ltd - Product / Service
- USV Pvt Ltd - Key offerings
- SWOT
15 Appendix
- 15.1 Scope of the report
- 15.2 Inclusions and exclusions checklist
- Inclusions checklist
- Exclusions checklist
- 15.3 Currency conversion rates for US$
- Currency conversion rates for US$
- 15.4 Research methodology
- Research methodology
- 15.5 Data procurement
- Information sources
- 15.6 Data validation
- Data validation
- 15.7 Validation techniques employed for market sizing
- Validation techniques employed for market sizing
- 15.8 Data synthesis
- Data synthesis
- 15.9 360 degree market analysis
- 360 degree market analysis
- 15.10 List of abbreviations
- List of abbreviations
