|
|
市場調査レポート
商品コード
1769502
アンギオスイートの世界市場 2025年~2029年Global Angio Suites Market 2025-2029 |
||||||

|
|||||||
カスタマイズ可能
|
|||||||


| アンギオスイートの世界市場 2025年~2029年 |
|
出版日: 2025年07月09日
発行: TechNavio
ページ情報: 英文 216 Pages
納期: 即納可能
|

全表示
- 概要
- 図表
- 目次
アンギオスイート市場は2024年~2029年に9億5,940万米ドル、予測期間中のCAGRは5.9%で成長すると予測されます。
当レポートでは、アンギオスイート市場の全体的な分析、市場規模・予測、動向、成長促進要因、課題、約25のベンダーを網羅したベンダー分析などを掲載しています。
現在の市場シナリオ、最新動向と促進要因、市場環境全体に関する最新分析を提供しています。市場は、心臓疾患の有病率の上昇、アンギオスイートに関連する製品発売の増加、ヘルスケア投資の増加によって牽引されています。
| 市場範囲 | |
|---|---|
| 基準年 | 2025 |
| 終了年 | 2029 |
| 予測期間 | 2025-2029 |
| 成長モメンタム | 加速 |
| 前年比 | 5.5% |
| CAGR | 5.9% |
| 増分額 | 9億5,940万米ドル |
本調査は、業界の主要参加者からのインプットを含め、一次情報と二次情報を客観的に組み合わせて実施しました。レポートには、主要企業の分析に加え、包括的な市場規模データ、地域分析によるセグメント、ベンダー情勢が含まれています。レポートには過去データと予測データがあります。
本調査では、今後数年間のアンギオスイート市場の成長を促進する主な理由の1つとして、人工知能(AI)と画像診断の統合を挙げています。また、M&A活動の増加やイメージング技術の進歩は、市場の大きな需要につながります。
目次
第1章 エグゼクティブサマリー
- 市場概要
第2章 Technavio分析
- 価格・ライフサイクル・顧客購入バスケット・採用率・購入基準の分析
- インプットの重要性と差別化の要因
- 混乱の要因
- 促進要因と課題の影響
第3章 市場情勢
- 市場エコシステム
- 市場の特徴
- バリューチェーン分析
第4章 市場規模
- 市場の定義
- 市場セグメント分析
- 市場規模 2024
- 市場の見通し 2024年~2029年
第5章 市場規模実績
- アンギオスイートの世界市場 2019年~2023年
- タイプ別セグメント分析 2019年~2023年
- エンドユーザー別セグメント分析 2019年~2023年
- 用途別セグメント分析 2019年~2023年
- 地域別セグメント分析 2019年~2023年
- 国別セグメント分析 2019年~2023年
第6章 定性分析
- AIの影響:アンギオスイートの世界市場
第7章 ファイブフォース分析
- ファイブフォースの要約
- 買い手の交渉力
- 供給企業の交渉力
- 新規参入業者の脅威
- 代替品の脅威
- 競争の脅威
- 市況
第8章 市場セグメンテーション:タイプ別
- 市場セグメント
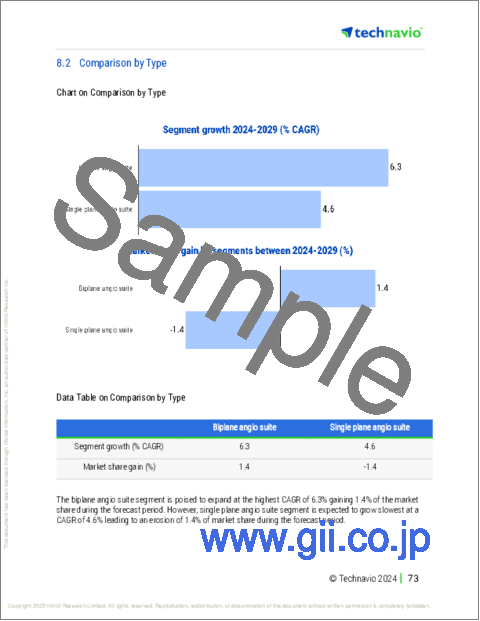
- 比較:タイプ別
- バイプレーン型アンギオスイート(2方向同時血管造影装置):市場規模と予測 2024年~2029年
- シングルプレーン型アンギオスイート(単方向血管造影装置):市場規模と予測 2024年~2029年
- 市場機会:タイプ別
第9章 市場セグメンテーション:エンドユーザー別
- 市場セグメント
- 比較:エンドユーザー別
- 病院と診療所:市場規模と予測 2024年~2029年
- 診断および外来手術センター:市場規模と予測 2024年~2029年
- 調査室および研究所:市場規模と予測 2024年~2029年
- 市場機会:エンドユーザー別
第10章 市場セグメンテーション:用途別
- 市場セグメント
- 比較:用途別
- 心臓血管造影検査:市場規模と予測 2024年~2029年
- 神経学血管造影:市場規模と予測 2024年~2029年
- 末梢血管造影:市場規模と予測 2024年~2029年
- 治療用ステント留置術:市場規模と予測 2024年~2029年
- その他:市場規模と予測 2024年~2029年
- 市場機会:用途別
第11章 顧客情勢
- 顧客情勢の概要
第12章 地域別情勢
- 地域別セグメンテーション
- 地域別比較
- 北米:市場規模と予測 2024年~2029年
- 欧州:市場規模と予測 2024年~2029年
- アジア:市場規模と予測 2024年~2029年
- 世界のその他の地域:市場規模と予測 2024年~2029年
- 米国:市場規模と予測 2024年~2029年
- 中国:市場規模と予測 2024年~2029年
- カナダ:市場規模と予測 2024年~2029年
- ドイツ:市場規模と予測 2024年~2029年
- 英国:市場規模と予測 2024年~2029年
- 日本:市場規模と予測 2024年~2029年
- フランス:市場規模と予測 2024年~2029年
- インド:市場規模と予測 2024年~2029年
- メキシコ:市場規模と予測 2024年~2029年
- イタリア:市場規模と予測 2024年~2029年
- 市場機会:地域情勢別
第13章 促進要因・課題・機会・抑制要因
- 市場促進要因
- 市場の課題
- 促進要因と課題の影響
- 市場の機会・抑制要因
第14章 競合情勢
- 概要
- 競合情勢
- 混乱の状況
- 業界のリスク
第15章 競合分析
- 企業プロファイル
- 企業ランキング指数
- 企業の市場ポジショニング
- Canon Inc.
- Carestream Health Inc.
- Carl Zeiss Stiftung
- Esaote Spa
- FUJIFILM Holdings Corp.
- General Electric Co.
- Hologic Inc.
- IMRIS Deerfield Imaging Inc.
- Koninklijke Philips NV
- Lam Vascular and Associates
- Planmeca Oy
- Shenzhen Mindray BioMedical Electronics Co. Ltd.
- Shimadzu Corp.
- Siemens AG
第16章 付録
Exhibits:
- Exhibits1: Executive Summary - Chart on Market Overview
- Exhibits2: Executive Summary - Data Table on Market Overview
- Exhibits3: Executive Summary - Chart on Global Market Characteristics
- Exhibits4: Executive Summary - Chart on Market By Geographical Landscape
- Exhibits5: Executive Summary - Chart on Market Segmentation by Type
- Exhibits6: Executive Summary - Chart on Market Segmentation by End-user
- Exhibits7: Executive Summary - Chart on Market Segmentation by Application
- Exhibits8: Executive Summary - Chart on Incremental Growth
- Exhibits9: Executive Summary - Data Table on Incremental Growth
- Exhibits10: Executive Summary - Chart on Company Market Positioning
- Exhibits11: Analysis of price sensitivity, lifecycle, customer purchase basket, adoption rates, and purchase criteria
- Exhibits12: Overview on criticality of inputs and factors of differentiation
- Exhibits13: Overview on factors of disruption
- Exhibits14: Impact of drivers and challenges in 2024 and 2029
- Exhibits15: Parent Market
- Exhibits16: Data Table on - Parent Market
- Exhibits17: Market characteristics analysis
- Exhibits18: Value chain analysis
- Exhibits19: Offerings of companies included in the market definition
- Exhibits20: Market segments
- Exhibits21: Chart on Global - Market size and forecast 2024-2029 ($ million)
- Exhibits22: Data Table on Global - Market size and forecast 2024-2029 ($ million)
- Exhibits23: Chart on Global Market: Year-over-year growth 2024-2029 (%)
- Exhibits24: Data Table on Global Market: Year-over-year growth 2024-2029 (%)
- Exhibits25: Historic Market Size - Data Table on Global Angio Suites Market 2019 - 2023 ($ million)
- Exhibits26: Historic Market Size - Type Segment 2019 - 2023 ($ million)
- Exhibits27: Historic Market Size - End-user Segment 2019 - 2023 ($ million)
- Exhibits28: Historic Market Size - Application Segment 2019 - 2023 ($ million)
- Exhibits29: Historic Market Size - Geography Segment 2019 - 2023 ($ million)
- Exhibits30: Historic Market Size - Country Segment 2019 - 2023 ($ million)
- Exhibits31: Five forces analysis - Comparison between 2024 and 2029
- Exhibits32: Bargaining power of buyers - Impact of key factors 2024 and 2029
- Exhibits33: Bargaining power of suppliers - Impact of key factors in 2024 and 2029
- Exhibits34: Threat of new entrants - Impact of key factors in 2024 and 2029
- Exhibits35: Threat of substitutes - Impact of key factors in 2024 and 2029
- Exhibits36: Threat of rivalry - Impact of key factors in 2024 and 2029
- Exhibits37: Chart on Market condition - Five forces 2024 and 2029
- Exhibits38: Chart on Type - Market share 2024-2029 (%)
- Exhibits39: Data Table on Type - Market share 2024-2029 (%)
- Exhibits40: Chart on Comparison by Type
- Exhibits41: Data Table on Comparison by Type
- Exhibits42: Chart on Biplane angio suite - Market size and forecast 2024-2029 ($ million)
- Exhibits43: Data Table on Biplane angio suite - Market size and forecast 2024-2029 ($ million)
- Exhibits44: Chart on Biplane angio suite - Year-over-year growth 2024-2029 (%)
- Exhibits45: Data Table on Biplane angio suite - Year-over-year growth 2024-2029 (%)
- Exhibits46: Chart on Single plane angio suite - Market size and forecast 2024-2029 ($ million)
- Exhibits47: Data Table on Single plane angio suite - Market size and forecast 2024-2029 ($ million)
- Exhibits48: Chart on Single plane angio suite - Year-over-year growth 2024-2029 (%)
- Exhibits49: Data Table on Single plane angio suite - Year-over-year growth 2024-2029 (%)
- Exhibits50: Market opportunity by Type ($ million)
- Exhibits51: Data Table on Market opportunity by Type ($ million)
- Exhibits52: Chart on End-user - Market share 2024-2029 (%)
- Exhibits53: Data Table on End-user - Market share 2024-2029 (%)
- Exhibits54: Chart on Comparison by End-user
- Exhibits55: Data Table on Comparison by End-user
- Exhibits56: Chart on Hospitals and clinics - Market size and forecast 2024-2029 ($ million)
- Exhibits57: Data Table on Hospitals and clinics - Market size and forecast 2024-2029 ($ million)
- Exhibits58: Chart on Hospitals and clinics - Year-over-year growth 2024-2029 (%)
- Exhibits59: Data Table on Hospitals and clinics - Year-over-year growth 2024-2029 (%)
- Exhibits60: Chart on Diagnostic and ambulatory surgery centers - Market size and forecast 2024-2029 ($ million)
- Exhibits61: Data Table on Diagnostic and ambulatory surgery centers - Market size and forecast 2024-2029 ($ million)
- Exhibits62: Chart on Diagnostic and ambulatory surgery centers - Year-over-year growth 2024-2029 (%)
- Exhibits63: Data Table on Diagnostic and ambulatory surgery centers - Year-over-year growth 2024-2029 (%)
- Exhibits64: Chart on Research laboratories and institutes - Market size and forecast 2024-2029 ($ million)
- Exhibits65: Data Table on Research laboratories and institutes - Market size and forecast 2024-2029 ($ million)
- Exhibits66: Chart on Research laboratories and institutes - Year-over-year growth 2024-2029 (%)
- Exhibits67: Data Table on Research laboratories and institutes - Year-over-year growth 2024-2029 (%)
- Exhibits68: Market opportunity by End-user ($ million)
- Exhibits69: Data Table on Market opportunity by End-user ($ million)
- Exhibits70: Chart on Application - Market share 2024-2029 (%)
- Exhibits71: Data Table on Application - Market share 2024-2029 (%)
- Exhibits72: Chart on Comparison by Application
- Exhibits73: Data Table on Comparison by Application
- Exhibits74: Chart on Cardiac angiography - Market size and forecast 2024-2029 ($ million)
- Exhibits75: Data Table on Cardiac angiography - Market size and forecast 2024-2029 ($ million)
- Exhibits76: Chart on Cardiac angiography - Year-over-year growth 2024-2029 (%)
- Exhibits77: Data Table on Cardiac angiography - Year-over-year growth 2024-2029 (%)
- Exhibits78: Chart on Neurology angiography - Market size and forecast 2024-2029 ($ million)
- Exhibits79: Data Table on Neurology angiography - Market size and forecast 2024-2029 ($ million)
- Exhibits80: Chart on Neurology angiography - Year-over-year growth 2024-2029 (%)
- Exhibits81: Data Table on Neurology angiography - Year-over-year growth 2024-2029 (%)
- Exhibits82: Chart on Peripheral vascular angiography - Market size and forecast 2024-2029 ($ million)
- Exhibits83: Data Table on Peripheral vascular angiography - Market size and forecast 2024-2029 ($ million)
- Exhibits84: Chart on Peripheral vascular angiography - Year-over-year growth 2024-2029 (%)
- Exhibits85: Data Table on Peripheral vascular angiography - Year-over-year growth 2024-2029 (%)
- Exhibits86: Chart on Therapeutic stenting - Market size and forecast 2024-2029 ($ million)
- Exhibits87: Data Table on Therapeutic stenting - Market size and forecast 2024-2029 ($ million)
- Exhibits88: Chart on Therapeutic stenting - Year-over-year growth 2024-2029 (%)
- Exhibits89: Data Table on Therapeutic stenting - Year-over-year growth 2024-2029 (%)
- Exhibits90: Chart on Others - Market size and forecast 2024-2029 ($ million)
- Exhibits91: Data Table on Others - Market size and forecast 2024-2029 ($ million)
- Exhibits92: Chart on Others - Year-over-year growth 2024-2029 (%)
- Exhibits93: Data Table on Others - Year-over-year growth 2024-2029 (%)
- Exhibits94: Market opportunity by Application ($ million)
- Exhibits95: Data Table on Market opportunity by Application ($ million)
- Exhibits96: Analysis of price sensitivity, lifecycle, customer purchase basket, adoption rates, and purchase criteria
- Exhibits97: Chart on Market share By Geographical Landscape 2024-2029 (%)
- Exhibits98: Data Table on Market share By Geographical Landscape 2024-2029 (%)
- Exhibits99: Chart on Geographic comparison
- Exhibits100: Data Table on Geographic comparison
- Exhibits101: Chart on North America - Market size and forecast 2024-2029 ($ million)
- Exhibits102: Data Table on North America - Market size and forecast 2024-2029 ($ million)
- Exhibits103: Chart on North America - Year-over-year growth 2024-2029 (%)
- Exhibits104: Data Table on North America - Year-over-year growth 2024-2029 (%)
- Exhibits105: Chart on Europe - Market size and forecast 2024-2029 ($ million)
- Exhibits106: Data Table on Europe - Market size and forecast 2024-2029 ($ million)
- Exhibits107: Chart on Europe - Year-over-year growth 2024-2029 (%)
- Exhibits108: Data Table on Europe - Year-over-year growth 2024-2029 (%)
- Exhibits109: Chart on Asia - Market size and forecast 2024-2029 ($ million)
- Exhibits110: Data Table on Asia - Market size and forecast 2024-2029 ($ million)
- Exhibits111: Chart on Asia - Year-over-year growth 2024-2029 (%)
- Exhibits112: Data Table on Asia - Year-over-year growth 2024-2029 (%)
- Exhibits113: Chart on Rest of World (ROW) - Market size and forecast 2024-2029 ($ million)
- Exhibits114: Data Table on Rest of World (ROW) - Market size and forecast 2024-2029 ($ million)
- Exhibits115: Chart on Rest of World (ROW) - Year-over-year growth 2024-2029 (%)
- Exhibits116: Data Table on Rest of World (ROW) - Year-over-year growth 2024-2029 (%)
- Exhibits117: Chart on US - Market size and forecast 2024-2029 ($ million)
- Exhibits118: Data Table on US - Market size and forecast 2024-2029 ($ million)
- Exhibits119: Chart on US - Year-over-year growth 2024-2029 (%)
- Exhibits120: Data Table on US - Year-over-year growth 2024-2029 (%)
- Exhibits121: Chart on China - Market size and forecast 2024-2029 ($ million)
- Exhibits122: Data Table on China - Market size and forecast 2024-2029 ($ million)
- Exhibits123: Chart on China - Year-over-year growth 2024-2029 (%)
- Exhibits124: Data Table on China - Year-over-year growth 2024-2029 (%)
- Exhibits125: Chart on Canada - Market size and forecast 2024-2029 ($ million)
- Exhibits126: Data Table on Canada - Market size and forecast 2024-2029 ($ million)
- Exhibits127: Chart on Canada - Year-over-year growth 2024-2029 (%)
- Exhibits128: Data Table on Canada - Year-over-year growth 2024-2029 (%)
- Exhibits129: Chart on Germany - Market size and forecast 2024-2029 ($ million)
- Exhibits130: Data Table on Germany - Market size and forecast 2024-2029 ($ million)
- Exhibits131: Chart on Germany - Year-over-year growth 2024-2029 (%)
- Exhibits132: Data Table on Germany - Year-over-year growth 2024-2029 (%)
- Exhibits133: Chart on UK - Market size and forecast 2024-2029 ($ million)
- Exhibits134: Data Table on UK - Market size and forecast 2024-2029 ($ million)
- Exhibits135: Chart on UK - Year-over-year growth 2024-2029 (%)
- Exhibits136: Data Table on UK - Year-over-year growth 2024-2029 (%)
- Exhibits137: Chart on Japan - Market size and forecast 2024-2029 ($ million)
- Exhibits138: Data Table on Japan - Market size and forecast 2024-2029 ($ million)
- Exhibits139: Chart on Japan - Year-over-year growth 2024-2029 (%)
- Exhibits140: Data Table on Japan - Year-over-year growth 2024-2029 (%)
- Exhibits141: Chart on France - Market size and forecast 2024-2029 ($ million)
- Exhibits142: Data Table on France - Market size and forecast 2024-2029 ($ million)
- Exhibits143: Chart on France - Year-over-year growth 2024-2029 (%)
- Exhibits144: Data Table on France - Year-over-year growth 2024-2029 (%)
- Exhibits145: Chart on India - Market size and forecast 2024-2029 ($ million)
- Exhibits146: Data Table on India - Market size and forecast 2024-2029 ($ million)
- Exhibits147: Chart on India - Year-over-year growth 2024-2029 (%)
- Exhibits148: Data Table on India - Year-over-year growth 2024-2029 (%)
- Exhibits149: Chart on Mexico - Market size and forecast 2024-2029 ($ million)
- Exhibits150: Data Table on Mexico - Market size and forecast 2024-2029 ($ million)
- Exhibits151: Chart on Mexico - Year-over-year growth 2024-2029 (%)
- Exhibits152: Data Table on Mexico - Year-over-year growth 2024-2029 (%)
- Exhibits153: Chart on Italy - Market size and forecast 2024-2029 ($ million)
- Exhibits154: Data Table on Italy - Market size and forecast 2024-2029 ($ million)
- Exhibits155: Chart on Italy - Year-over-year growth 2024-2029 (%)
- Exhibits156: Data Table on Italy - Year-over-year growth 2024-2029 (%)
- Exhibits157: Market opportunity By Geographical Landscape ($ million)
- Exhibits158: Data Tables on Market opportunity By Geographical Landscape ($ million)
- Exhibits159: Impact of drivers and challenges in 2024 and 2029
- Exhibits160: Overview on criticality of inputs and factors of differentiation
- Exhibits161: Overview on factors of disruption
- Exhibits162: Impact of key risks on business
- Exhibits163: Companies covered
- Exhibits164: Company ranking index
- Exhibits165: Matrix on companies position and classification
- Exhibits166: 3D Systems Corp. - Overview
- Exhibits167: 3D Systems Corp. - Business segments
- Exhibits168: 3D Systems Corp. - Key news
- Exhibits169: 3D Systems Corp. - Key offerings
- Exhibits170: 3D Systems Corp. - Segment focus
- Exhibits171: SWOT
- Exhibits172: Canon Inc. - Overview
- Exhibits173: Canon Inc. - Business segments
- Exhibits174: Canon Inc. - Key news
- Exhibits175: Canon Inc. - Key offerings
- Exhibits176: Canon Inc. - Segment focus
- Exhibits177: SWOT
- Exhibits178: Carestream Health Inc. - Overview
- Exhibits179: Carestream Health Inc. - Product / Service
- Exhibits180: Carestream Health Inc. - Key offerings
- Exhibits181: SWOT
- Exhibits182: Carl Zeiss Stiftung - Overview
- Exhibits183: Carl Zeiss Stiftung - Product / Service
- Exhibits184: Carl Zeiss Stiftung - Key offerings
- Exhibits185: SWOT
- Exhibits186: Esaote Spa - Overview
- Exhibits187: Esaote Spa - Product / Service
- Exhibits188: Esaote Spa - Key offerings
- Exhibits189: SWOT
- Exhibits190: FUJIFILM Holdings Corp. - Overview
- Exhibits191: FUJIFILM Holdings Corp. - Business segments
- Exhibits192: FUJIFILM Holdings Corp. - Key news
- Exhibits193: FUJIFILM Holdings Corp. - Key offerings
- Exhibits194: FUJIFILM Holdings Corp. - Segment focus
- Exhibits195: SWOT
- Exhibits196: General Electric Co. - Overview
- Exhibits197: General Electric Co. - Business segments
- Exhibits198: General Electric Co. - Key news
- Exhibits199: General Electric Co. - Key offerings
- Exhibits200: General Electric Co. - Segment focus
- Exhibits201: SWOT
- Exhibits202: Hologic Inc. - Overview
- Exhibits203: Hologic Inc. - Business segments
- Exhibits204: Hologic Inc. - Key news
- Exhibits205: Hologic Inc. - Key offerings
- Exhibits206: Hologic Inc. - Segment focus
- Exhibits207: SWOT
- Exhibits208: IMRIS Deerfield Imaging Inc. - Overview
- Exhibits209: IMRIS Deerfield Imaging Inc. - Product / Service
- Exhibits210: IMRIS Deerfield Imaging Inc. - Key offerings
- Exhibits211: SWOT
- Exhibits212: Koninklijke Philips NV - Overview
- Exhibits213: Koninklijke Philips NV - Business segments
- Exhibits214: Koninklijke Philips NV - Key news
- Exhibits215: Koninklijke Philips NV - Key offerings
- Exhibits216: Koninklijke Philips NV - Segment focus
- Exhibits217: SWOT
- Exhibits218: Lam Vascular and Associates - Overview
- Exhibits219: Lam Vascular and Associates - Product / Service
- Exhibits220: Lam Vascular and Associates - Key offerings
- Exhibits221: SWOT
- Exhibits222: Planmeca Oy - Overview
- Exhibits223: Planmeca Oy - Product / Service
- Exhibits224: Planmeca Oy - Key offerings
- Exhibits225: SWOT
- Exhibits226: Shenzhen Mindray BioMedical Electronics Co. Ltd. - Overview
- Exhibits227: Shenzhen Mindray BioMedical Electronics Co. Ltd. - Product / Service
- Exhibits228: Shenzhen Mindray BioMedical Electronics Co. Ltd. - Key news
- Exhibits229: Shenzhen Mindray BioMedical Electronics Co. Ltd. - Key offerings
- Exhibits230: SWOT
- Exhibits231: Shimadzu Corp. - Overview
- Exhibits232: Shimadzu Corp. - Business segments
- Exhibits233: Shimadzu Corp. - Key news
- Exhibits234: Shimadzu Corp. - Key offerings
- Exhibits235: Shimadzu Corp. - Segment focus
- Exhibits236: SWOT
- Exhibits237: Siemens AG - Overview
- Exhibits238: Siemens AG - Business segments
- Exhibits239: Siemens AG - Key news
- Exhibits240: Siemens AG - Key offerings
- Exhibits241: Siemens AG - Segment focus
- Exhibits242: SWOT
- Exhibits243: Inclusions checklist
- Exhibits244: Exclusions checklist
- Exhibits245: Currency conversion rates for US$
- Exhibits246: Research methodology
- Exhibits247: Information sources
- Exhibits248: Data validation
- Exhibits249: Validation techniques employed for market sizing
- Exhibits250: Data synthesis
- Exhibits251: 360 degree market analysis
- Exhibits252: List of abbreviations
The angio suites market is forecasted to grow by USD 959.4 mn during 2024-2029, accelerating at a CAGR of 5.9% during the forecast period. The report on the angio suites market provides a holistic analysis, market size and forecast, trends, growth drivers, and challenges, as well as vendor analysis covering around 25 vendors.
The report offers an up-to-date analysis regarding the current market scenario, the latest trends and drivers, and the overall market environment. The market is driven by rising prevalence of cardiac disorders, increasing product launches related to angio suite, and increased healthcare investments.
| Market Scope | |
|---|---|
| Base Year | 2025 |
| End Year | 2029 |
| Series Year | 2025-2029 |
| Growth Momentum | Accelerate |
| YOY 2025 | 5.5% |
| CAGR | 5.9% |
| Incremental Value | $959.4 mn |
The study was conducted using an objective combination of primary and secondary information including inputs from key participants in the industry. The report contains a comprehensive market size data, segment with regional analysis and vendor landscape in addition to an analysis of the key companies. Reports have historic and forecast data.
Technavio's angio suites market is segmented as below:
By Type
- Biplane angio suite
- Single plane angio suite
By End-user
- Hospitals and clinics
- Diagnostic and ambulatory surgery centers
- Research laboratories and institutes
By Application
- Cardiac angiography
- Neurology angiography
- Peripheral vascular angiography
- Therapeutic stenting
- Others
By Geographical Landscape
- North America
- Europe
- Asia
- Rest of World (ROW)
This study identifies the integration of artificial intelligence (AI) with diagnostic imaging as one of the prime reasons driving the angio suites market growth during the next few years. Also, growing number of mergers and acquisitions activities and advances in imaging technologies will lead to sizable demand in the market.
The report on the angio suites market covers the following areas:
- Angio Suites Market sizing
- Angio Suites Market forecast
- Angio Suites Market industry analysis
The robust vendor analysis is designed to help clients improve their market position, and in line with this, this report provides a detailed analysis of several leading angio suites market vendors that include 3D Systems Corp., B.Braun SE, Canon Inc., Carestream Health Inc., Carl Zeiss Stiftung, Esaote Spa, FUJIFILM Holdings Corp., General Electric Co., Guerbet, Hologic Inc., IMRIS Deerfield Imaging Inc., Koninklijke Philips NV, Lam Vascular and Associates, Mentice AB, Planmeca Oy, QMD, Shenzhen Mindray BioMedical Electronics Co. Ltd., Shimadzu Corp., Siemens AG, and Surgical Science Sweden AB. Also, the angio suites market analysis report includes information on upcoming trends and challenges that will influence market growth. This is to help companies strategize and leverage all forthcoming growth opportunities.
The publisher presents a detailed picture of the market by the way of study, synthesis, and summation of data from multiple sources by an analysis of key parameters such as profit, pricing, competition, and promotions. It presents various market facets by identifying the key industry influencers. The data presented is comprehensive, reliable, and a result of extensive primary and secondary research. The market research reports provide a complete competitive landscape and an in-depth vendor selection methodology and analysis using qualitative and quantitative research to forecast accurate market growth.
Table of Contents
1 Executive Summary
- 1.1 Market overview
- Executive Summary - Chart on Market Overview
- Executive Summary - Data Table on Market Overview
- Executive Summary - Chart on Global Market Characteristics
- Executive Summary - Chart on Market By Geographical Landscape
- Executive Summary - Chart on Market Segmentation by Type
- Executive Summary - Chart on Market Segmentation by End-user
- Executive Summary - Chart on Market Segmentation by Application
- Executive Summary - Chart on Incremental Growth
- Executive Summary - Data Table on Incremental Growth
- Executive Summary - Chart on Company Market Positioning
2 Technavio Analysis
- 2.1 Analysis of price sensitivity, lifecycle, customer purchase basket, adoption rates, and purchase criteria
- Analysis of price sensitivity, lifecycle, customer purchase basket, adoption rates, and purchase criteria
- 2.2 Criticality of inputs and Factors of differentiation
- Overview on criticality of inputs and factors of differentiation
- 2.3 Factors of disruption
- Overview on factors of disruption
- 2.4 Impact of drivers and challenges
- Impact of drivers and challenges in 2024 and 2029
3 Market Landscape
- 3.1 Market ecosystem
- Parent Market
- Data Table on - Parent Market
- 3.2 Market characteristics
- Market characteristics analysis
- 3.3 Value chain analysis
- Value chain analysis
4 Market Sizing
- 4.1 Market definition
- Offerings of companies included in the market definition
- 4.2 Market segment analysis
- Market segments
- 4.3 Market size 2024
- 4.4 Market outlook: Forecast for 2024-2029
- Chart on Global - Market size and forecast 2024-2029 ($ million)
- Data Table on Global - Market size and forecast 2024-2029 ($ million)
- Chart on Global Market: Year-over-year growth 2024-2029 (%)
- Data Table on Global Market: Year-over-year growth 2024-2029 (%)
5 Historic Market Size
- 5.1 Global Angio Suites Market 2019 - 2023
- Historic Market Size - Data Table on Global Angio Suites Market 2019 - 2023 ($ million)
- 5.2 Type segment analysis 2019 - 2023
- Historic Market Size - Type Segment 2019 - 2023 ($ million)
- 5.3 End-user segment analysis 2019 - 2023
- Historic Market Size - End-user Segment 2019 - 2023 ($ million)
- 5.4 Application segment analysis 2019 - 2023
- Historic Market Size - Application Segment 2019 - 2023 ($ million)
- 5.5 Geography segment analysis 2019 - 2023
- Historic Market Size - Geography Segment 2019 - 2023 ($ million)
- 5.6 Country segment analysis 2019 - 2023
- Historic Market Size - Country Segment 2019 - 2023 ($ million)
6 Qualitative Analysis
- 6.1 The impact of AI in the global angio suites market
7 Five Forces Analysis
- 7.1 Five forces summary
- Five forces analysis - Comparison between 2024 and 2029
- 7.2 Bargaining power of buyers
- Bargaining power of buyers - Impact of key factors 2024 and 2029
- 7.3 Bargaining power of suppliers
- Bargaining power of suppliers - Impact of key factors in 2024 and 2029
- 7.4 Threat of new entrants
- Threat of new entrants - Impact of key factors in 2024 and 2029
- 7.5 Threat of substitutes
- Threat of substitutes - Impact of key factors in 2024 and 2029
- 7.6 Threat of rivalry
- Threat of rivalry - Impact of key factors in 2024 and 2029
- 7.7 Market condition
- Chart on Market condition - Five forces 2024 and 2029
8 Market Segmentation by Type
- 8.1 Market segments
- Chart on Type - Market share 2024-2029 (%)
- Data Table on Type - Market share 2024-2029 (%)
- 8.2 Comparison by Type
- Chart on Comparison by Type
- Data Table on Comparison by Type
- 8.3 Biplane angio suite - Market size and forecast 2024-2029
- Chart on Biplane angio suite - Market size and forecast 2024-2029 ($ million)
- Data Table on Biplane angio suite - Market size and forecast 2024-2029 ($ million)
- Chart on Biplane angio suite - Year-over-year growth 2024-2029 (%)
- Data Table on Biplane angio suite - Year-over-year growth 2024-2029 (%)
- 8.4 Single plane angio suite - Market size and forecast 2024-2029
- Chart on Single plane angio suite - Market size and forecast 2024-2029 ($ million)
- Data Table on Single plane angio suite - Market size and forecast 2024-2029 ($ million)
- Chart on Single plane angio suite - Year-over-year growth 2024-2029 (%)
- Data Table on Single plane angio suite - Year-over-year growth 2024-2029 (%)
- 8.5 Market opportunity by Type
- Market opportunity by Type ($ million)
- Data Table on Market opportunity by Type ($ million)
9 Market Segmentation by End-user
- 9.1 Market segments
- Chart on End-user - Market share 2024-2029 (%)
- Data Table on End-user - Market share 2024-2029 (%)
- 9.2 Comparison by End-user
- Chart on Comparison by End-user
- Data Table on Comparison by End-user
- 9.3 Hospitals and clinics - Market size and forecast 2024-2029
- Chart on Hospitals and clinics - Market size and forecast 2024-2029 ($ million)
- Data Table on Hospitals and clinics - Market size and forecast 2024-2029 ($ million)
- Chart on Hospitals and clinics - Year-over-year growth 2024-2029 (%)
- Data Table on Hospitals and clinics - Year-over-year growth 2024-2029 (%)
- 9.4 Diagnostic and ambulatory surgery centers - Market size and forecast 2024-2029
- Chart on Diagnostic and ambulatory surgery centers - Market size and forecast 2024-2029 ($ million)
- Data Table on Diagnostic and ambulatory surgery centers - Market size and forecast 2024-2029 ($ million)
- Chart on Diagnostic and ambulatory surgery centers - Year-over-year growth 2024-2029 (%)
- Data Table on Diagnostic and ambulatory surgery centers - Year-over-year growth 2024-2029 (%)
- 9.5 Research laboratories and institutes - Market size and forecast 2024-2029
- Chart on Research laboratories and institutes - Market size and forecast 2024-2029 ($ million)
- Data Table on Research laboratories and institutes - Market size and forecast 2024-2029 ($ million)
- Chart on Research laboratories and institutes - Year-over-year growth 2024-2029 (%)
- Data Table on Research laboratories and institutes - Year-over-year growth 2024-2029 (%)
- 9.6 Market opportunity by End-user
- Market opportunity by End-user ($ million)
- Data Table on Market opportunity by End-user ($ million)
10 Market Segmentation by Application
- 10.1 Market segments
- Chart on Application - Market share 2024-2029 (%)
- Data Table on Application - Market share 2024-2029 (%)
- 10.2 Comparison by Application
- Chart on Comparison by Application
- Data Table on Comparison by Application
- 10.3 Cardiac angiography - Market size and forecast 2024-2029
- Chart on Cardiac angiography - Market size and forecast 2024-2029 ($ million)
- Data Table on Cardiac angiography - Market size and forecast 2024-2029 ($ million)
- Chart on Cardiac angiography - Year-over-year growth 2024-2029 (%)
- Data Table on Cardiac angiography - Year-over-year growth 2024-2029 (%)
- 10.4 Neurology angiography - Market size and forecast 2024-2029
- Chart on Neurology angiography - Market size and forecast 2024-2029 ($ million)
- Data Table on Neurology angiography - Market size and forecast 2024-2029 ($ million)
- Chart on Neurology angiography - Year-over-year growth 2024-2029 (%)
- Data Table on Neurology angiography - Year-over-year growth 2024-2029 (%)
- 10.5 Peripheral vascular angiography - Market size and forecast 2024-2029
- Chart on Peripheral vascular angiography - Market size and forecast 2024-2029 ($ million)
- Data Table on Peripheral vascular angiography - Market size and forecast 2024-2029 ($ million)
- Chart on Peripheral vascular angiography - Year-over-year growth 2024-2029 (%)
- Data Table on Peripheral vascular angiography - Year-over-year growth 2024-2029 (%)
- 10.6 Therapeutic stenting - Market size and forecast 2024-2029
- Chart on Therapeutic stenting - Market size and forecast 2024-2029 ($ million)
- Data Table on Therapeutic stenting - Market size and forecast 2024-2029 ($ million)
- Chart on Therapeutic stenting - Year-over-year growth 2024-2029 (%)
- Data Table on Therapeutic stenting - Year-over-year growth 2024-2029 (%)
- 10.7 Others - Market size and forecast 2024-2029
- Chart on Others - Market size and forecast 2024-2029 ($ million)
- Data Table on Others - Market size and forecast 2024-2029 ($ million)
- Chart on Others - Year-over-year growth 2024-2029 (%)
- Data Table on Others - Year-over-year growth 2024-2029 (%)
- 10.8 Market opportunity by Application
- Market opportunity by Application ($ million)
- Data Table on Market opportunity by Application ($ million)
11 Customer Landscape
- 11.1 Customer landscape overview
- Analysis of price sensitivity, lifecycle, customer purchase basket, adoption rates, and purchase criteria
12 Geographic Landscape
- 12.1 Geographic segmentation
- Chart on Market share By Geographical Landscape 2024-2029 (%)
- Data Table on Market share By Geographical Landscape 2024-2029 (%)
- 12.2 Geographic comparison
- Chart on Geographic comparison
- Data Table on Geographic comparison
- 12.3 North America - Market size and forecast 2024-2029
- Chart on North America - Market size and forecast 2024-2029 ($ million)
- Data Table on North America - Market size and forecast 2024-2029 ($ million)
- Chart on North America - Year-over-year growth 2024-2029 (%)
- Data Table on North America - Year-over-year growth 2024-2029 (%)
- 12.4 Europe - Market size and forecast 2024-2029
- Chart on Europe - Market size and forecast 2024-2029 ($ million)
- Data Table on Europe - Market size and forecast 2024-2029 ($ million)
- Chart on Europe - Year-over-year growth 2024-2029 (%)
- Data Table on Europe - Year-over-year growth 2024-2029 (%)
- 12.5 Asia - Market size and forecast 2024-2029
- Chart on Asia - Market size and forecast 2024-2029 ($ million)
- Data Table on Asia - Market size and forecast 2024-2029 ($ million)
- Chart on Asia - Year-over-year growth 2024-2029 (%)
- Data Table on Asia - Year-over-year growth 2024-2029 (%)
- 12.6 Rest of World (ROW) - Market size and forecast 2024-2029
- Chart on Rest of World (ROW) - Market size and forecast 2024-2029 ($ million)
- Data Table on Rest of World (ROW) - Market size and forecast 2024-2029 ($ million)
- Chart on Rest of World (ROW) - Year-over-year growth 2024-2029 (%)
- Data Table on Rest of World (ROW) - Year-over-year growth 2024-2029 (%)
- 12.7 US - Market size and forecast 2024-2029
- Chart on US - Market size and forecast 2024-2029 ($ million)
- Data Table on US - Market size and forecast 2024-2029 ($ million)
- Chart on US - Year-over-year growth 2024-2029 (%)
- Data Table on US - Year-over-year growth 2024-2029 (%)
- 12.8 China - Market size and forecast 2024-2029
- Chart on China - Market size and forecast 2024-2029 ($ million)
- Data Table on China - Market size and forecast 2024-2029 ($ million)
- Chart on China - Year-over-year growth 2024-2029 (%)
- Data Table on China - Year-over-year growth 2024-2029 (%)
- 12.9 Canada - Market size and forecast 2024-2029
- Chart on Canada - Market size and forecast 2024-2029 ($ million)
- Data Table on Canada - Market size and forecast 2024-2029 ($ million)
- Chart on Canada - Year-over-year growth 2024-2029 (%)
- Data Table on Canada - Year-over-year growth 2024-2029 (%)
- 12.10 Germany - Market size and forecast 2024-2029
- Chart on Germany - Market size and forecast 2024-2029 ($ million)
- Data Table on Germany - Market size and forecast 2024-2029 ($ million)
- Chart on Germany - Year-over-year growth 2024-2029 (%)
- Data Table on Germany - Year-over-year growth 2024-2029 (%)
- 12.11 UK - Market size and forecast 2024-2029
- Chart on UK - Market size and forecast 2024-2029 ($ million)
- Data Table on UK - Market size and forecast 2024-2029 ($ million)
- Chart on UK - Year-over-year growth 2024-2029 (%)
- Data Table on UK - Year-over-year growth 2024-2029 (%)
- 12.12 Japan - Market size and forecast 2024-2029
- Chart on Japan - Market size and forecast 2024-2029 ($ million)
- Data Table on Japan - Market size and forecast 2024-2029 ($ million)
- Chart on Japan - Year-over-year growth 2024-2029 (%)
- Data Table on Japan - Year-over-year growth 2024-2029 (%)
- 12.13 France - Market size and forecast 2024-2029
- Chart on France - Market size and forecast 2024-2029 ($ million)
- Data Table on France - Market size and forecast 2024-2029 ($ million)
- Chart on France - Year-over-year growth 2024-2029 (%)
- Data Table on France - Year-over-year growth 2024-2029 (%)
- 12.14 India - Market size and forecast 2024-2029
- Chart on India - Market size and forecast 2024-2029 ($ million)
- Data Table on India - Market size and forecast 2024-2029 ($ million)
- Chart on India - Year-over-year growth 2024-2029 (%)
- Data Table on India - Year-over-year growth 2024-2029 (%)
- 12.15 Mexico - Market size and forecast 2024-2029
- Chart on Mexico - Market size and forecast 2024-2029 ($ million)
- Data Table on Mexico - Market size and forecast 2024-2029 ($ million)
- Chart on Mexico - Year-over-year growth 2024-2029 (%)
- Data Table on Mexico - Year-over-year growth 2024-2029 (%)
- 12.16 Italy - Market size and forecast 2024-2029
- Chart on Italy - Market size and forecast 2024-2029 ($ million)
- Data Table on Italy - Market size and forecast 2024-2029 ($ million)
- Chart on Italy - Year-over-year growth 2024-2029 (%)
- Data Table on Italy - Year-over-year growth 2024-2029 (%)
- 12.17 Market opportunity By Geographical Landscape
- Market opportunity By Geographical Landscape ($ million)
- Data Tables on Market opportunity By Geographical Landscape ($ million)
13 Drivers, Challenges, and Opportunity/Restraints
- 13.1 Market drivers
- 13.2 Market challenges
- 13.3 Impact of drivers and challenges
- Impact of drivers and challenges in 2024 and 2029
- 13.4 Market opportunities/restraints
14 Competitive Landscape
- 14.1 Overview
- 14.2 Competitive Landscape
- Overview on criticality of inputs and factors of differentiation
- 14.3 Landscape disruption
- Overview on factors of disruption
- 14.4 Industry risks
- Impact of key risks on business
15 Competitive Analysis
- 15.1 Companies profiled
- Companies covered
- 15.2 Company ranking index
- Company ranking index
- 15.3 Market positioning of companies
- Matrix on companies position and classification
- 3D Systems Corp.
- 3D Systems Corp. - Overview
- 3D Systems Corp. - Business segments
- 3D Systems Corp. - Key news
- 3D Systems Corp. - Key offerings
- 3D Systems Corp. - Segment focus
- SWOT
- 15.5 Canon Inc.
- Canon Inc. - Overview
- Canon Inc. - Business segments
- Canon Inc. - Key news
- Canon Inc. - Key offerings
- Canon Inc. - Segment focus
- SWOT
- 15.6 Carestream Health Inc.
- Carestream Health Inc. - Overview
- Carestream Health Inc. - Product / Service
- Carestream Health Inc. - Key offerings
- SWOT
- 15.7 Carl Zeiss Stiftung
- Carl Zeiss Stiftung - Overview
- Carl Zeiss Stiftung - Product / Service
- Carl Zeiss Stiftung - Key offerings
- SWOT
- 15.8 Esaote Spa
- Esaote Spa - Overview
- Esaote Spa - Product / Service
- Esaote Spa - Key offerings
- SWOT
- 15.9 FUJIFILM Holdings Corp.
- FUJIFILM Holdings Corp. - Overview
- FUJIFILM Holdings Corp. - Business segments
- FUJIFILM Holdings Corp. - Key news
- FUJIFILM Holdings Corp. - Key offerings
- FUJIFILM Holdings Corp. - Segment focus
- SWOT
- 15.10 General Electric Co.
- General Electric Co. - Overview
- General Electric Co. - Business segments
- General Electric Co. - Key news
- General Electric Co. - Key offerings
- General Electric Co. - Segment focus
- SWOT
- 15.11 Hologic Inc.
- Hologic Inc. - Overview
- Hologic Inc. - Business segments
- Hologic Inc. - Key news
- Hologic Inc. - Key offerings
- Hologic Inc. - Segment focus
- SWOT
- 15.12 IMRIS Deerfield Imaging Inc.
- IMRIS Deerfield Imaging Inc. - Overview
- IMRIS Deerfield Imaging Inc. - Product / Service
- IMRIS Deerfield Imaging Inc. - Key offerings
- SWOT
- 15.13 Koninklijke Philips NV
- Koninklijke Philips NV - Overview
- Koninklijke Philips NV - Business segments
- Koninklijke Philips NV - Key news
- Koninklijke Philips NV - Key offerings
- Koninklijke Philips NV - Segment focus
- SWOT
- 15.14 Lam Vascular and Associates
- Lam Vascular and Associates - Overview
- Lam Vascular and Associates - Product / Service
- Lam Vascular and Associates - Key offerings
- SWOT
- 15.15 Planmeca Oy
- Planmeca Oy - Overview
- Planmeca Oy - Product / Service
- Planmeca Oy - Key offerings
- SWOT
- 15.16 Shenzhen Mindray BioMedical Electronics Co. Ltd.
- Shenzhen Mindray BioMedical Electronics Co. Ltd. - Overview
- Shenzhen Mindray BioMedical Electronics Co. Ltd. - Product / Service
- Shenzhen Mindray BioMedical Electronics Co. Ltd. - Key news
- Shenzhen Mindray BioMedical Electronics Co. Ltd. - Key offerings
- SWOT
- 15.17 Shimadzu Corp.
- Shimadzu Corp. - Overview
- Shimadzu Corp. - Business segments
- Shimadzu Corp. - Key news
- Shimadzu Corp. - Key offerings
- Shimadzu Corp. - Segment focus
- SWOT
- 15.18 Siemens AG
- Siemens AG - Overview
- Siemens AG - Business segments
- Siemens AG - Key news
- Siemens AG - Key offerings
- Siemens AG - Segment focus
- SWOT
16 Appendix
- 16.1 Scope of the report
- 16.2 Inclusions and exclusions checklist
- Inclusions checklist
- Exclusions checklist
- 16.3 Currency conversion rates for US$
- Currency conversion rates for US$
- 16.4 Research methodology
- Research methodology
- 16.5 Data procurement
- Information sources
- 16.6 Data validation
- Data validation
- 16.7 Validation techniques employed for market sizing
- Validation techniques employed for market sizing
- 16.8 Data synthesis
- Data synthesis
- 16.9 360 degree market analysis
- 360 degree market analysis
- 16.10 List of abbreviations
- List of abbreviations

