|
|
市場調査レポート
商品コード
1756539
段ボール箱製造機の世界市場 2025~2029年Global Corrugated Box Making Machine Market 2025-2029 |
||||||

|
|||||||
カスタマイズ可能
|
|||||||


| 段ボール箱製造機の世界市場 2025~2029年 |
|
出版日: 2025年06月18日
発行: TechNavio
ページ情報: 英文 227 Pages
納期: 即納可能
|

全表示
- 概要
- 図表
- 目次
段ボール箱製造機市場は2024年~2029年に8億2,120万米ドル、予測期間中のCAGRは5.4%で成長すると予測されます。
当レポートでは、段ボール箱製造機市場の全体的な分析、市場規模・予測、動向、成長促進要因、課題、約25のベンダーを網羅したベンダー分析などを掲載しています。
現在の市場シナリオ、最新動向と促進要因、市場環境全体に関する最新分析を提供しています。eコマース産業の急成長、自動化の台頭、アウトソーシングコストの削減ニーズなどが市場を牽引しています。
| 市場範囲 | |
|---|---|
| 基準年 | 2025 |
| 終了年 | 2029 |
| 予測期間 | 2025-2029 |
| 成長モメンタム | 加速 |
| 前年比 | 5% |
| CAGR | 5.4% |
| 増分額 | 8億2,120万米ドル |
本調査は、業界の主要参加者からのインプットを含め、一次情報と二次情報を客観的に組み合わせて実施しました。レポートには、主要企業の分析に加え、包括的な市場規模データ、地域別分析によるセグメント、ベンダー情勢が含まれています。レポートには過去データと予測データがあります。
本調査では、今後数年間の段ボール箱製造機市場の成長を促進する主な理由の一つとして、スマートパッケージングの採用増加を挙げています。また、環境に優しい段ボール箱製造機と軽量段ボール箱の生産は、市場の大きな需要につながります。
目次
第1章 エグゼクティブサマリー
- 市場概要
第2章 Technavio分析
- 価格・ライフサイクル・顧客購入バスケット・採用率・購入基準の分析
- インプットの重要性と差別化の要因
- 混乱の要因
- 促進要因と課題の影響
第3章 市場情勢
- 市場エコシステム
- 市場の特徴
- バリューチェーン分析
第4章 市場規模
- 市場の定義
- 市場セグメント分析
- 市場規模 2024
- 市場の見通し 2024年~2029年
第5章 市場規模実績
- 段ボール箱製造機の世界市場 2019年~2023年
- エンドユーザー別セグメント分析 2019年~2023年
- 技術別セグメント分析 2019年~2023年
- 製品タイプ別セグメント分析 2019年~2023年
- 地域別セグメント分析 2019年~2023年
- 国別セグメント分析 2019年~2023年
第6章 定性分析
- AIの影響:段ボール箱製造機の世界市場
第7章 ファイブフォース分析
- ファイブフォースの要約
- 買い手の交渉力
- 供給企業の交渉力
- 新規参入業者の脅威
- 代替品の脅威
- 競争の脅威
- 市況
第8章 市場セグメンテーション:エンドユーザー別
- 市場セグメント
- 比較:エンドユーザー別
- 飲食品:市場規模と予測 2024年~2029年
- 電子機器:市場規模と予測 2024年~2029年
- ホームケア用品:市場規模と予測 2024年~2029年
- 繊維製品:市場規模と予測 2024年~2029年
- その他:市場規模と予測 2024年~2029年
- 市場機会:エンドユーザー別
第9章 市場セグメンテーション:技術別
- 市場セグメント
- 比較:技術別
- 自動:市場規模と予測 2024年~2029年
- 半自動:市場規模と予測 2024年~2029年
- マニュアル:市場規模と予測 2024年~2029年
- 市場機会:技術別
第10章 市場セグメンテーション:製品タイプ別
- 市場セグメント
- 比較:製品タイプ別
- 大容量マシン:市場規模と予測 2024年~2029年
- 中容量マシン:市場規模と予測 2024年~2029年
- 低容量マシン:市場規模と予測 2024年~2029年
- 市場機会:製品タイプ別
第11章 顧客情勢
- 顧客情勢の概要
第12章 地域別情勢
- 地域別セグメンテーション
- 地域別比較
- アジア太平洋:市場規模と予測 2024年~2029年
- 北米:市場規模と予測 2024年~2029年
- 欧州:市場規模と予測 2024年~2029年
- 中東・アフリカ:市場規模と予測 2024年~2029年
- 南米:市場規模と予測 2024年~2029年
- 米国:市場規模と予測 2024年~2029年
- 中国:市場規模と予測 2024年~2029年
- インド:市場規模と予測 2024年~2029年
- 日本:市場規模と予測 2024年~2029年
- ドイツ:市場規模と予測 2024年~2029年
- カナダ:市場規模と予測 2024年~2029年
- 韓国:市場規模と予測 2024年~2029年
- オーストラリア:市場規模と予測 2024年~2029年
- 英国:市場規模と予測 2024年~2029年
- フランス:市場規模と予測 2024年~2029年
- 市場機会:地域情勢別
第13章 促進要因・課題・機会・抑制要因
- 市場促進要因
- 市場の課題
- 促進要因と課題の影響
- 市場の機会・抑制要因
第14章 競合情勢
- 概要
- 競合情勢
- 混乱の状況
- 業界のリスク
第15章 競合分析
- 企業プロファイル
- 企業ランキング指数
- 企業の市場ポジショニング
- Acme Machinery Co.
- Bobst Group SA
- EMBA Machinery AB
- Fosber Spa
- Guangdong Hongming Intelligent Joint Stock Co. Ltd.
- Hebei Shengli Carton Equipment Manufacturing Co. Ltd.
- ISOWA Corp.
- KOLBUS GmbH and Co. KG
- Mitsubishi Heavy Industries Ltd.
- Natraj Corrugating Machinery Co.
- Panotec Srl
- Serpa Packaging Solutions LLC
- Shanghai PrintYoung International Industry Co. Ltd.
- Shinko Machine Mfg. Co. Ltd.
- SUN Automation Group
第16章 付録
Exhibits:
- Exhibits1: Executive Summary - Chart on Market Overview
- Exhibits2: Executive Summary - Data Table on Market Overview
- Exhibits3: Executive Summary - Chart on Global Market Characteristics
- Exhibits4: Executive Summary - Chart on Market By Geographical Landscape
- Exhibits5: Executive Summary - Chart on Market Segmentation by End-user
- Exhibits6: Executive Summary - Chart on Market Segmentation by Technology
- Exhibits7: Executive Summary - Chart on Market Segmentation by Product Type
- Exhibits8: Executive Summary - Chart on Incremental Growth
- Exhibits9: Executive Summary - Data Table on Incremental Growth
- Exhibits10: Executive Summary - Chart on Company Market Positioning
- Exhibits11: Analysis of price sensitivity, lifecycle, customer purchase basket, adoption rates, and purchase criteria
- Exhibits12: Overview on criticality of inputs and factors of differentiation
- Exhibits13: Overview on factors of disruption
- Exhibits14: Impact of drivers and challenges in 2024 and 2029
- Exhibits15: Parent Market
- Exhibits16: Data Table on - Parent Market
- Exhibits17: Market characteristics analysis
- Exhibits18: Value chain analysis
- Exhibits19: Offerings of companies included in the market definition
- Exhibits20: Market segments
- Exhibits21: Chart on Global - Market size and forecast 2024-2029 ($ million)
- Exhibits22: Data Table on Global - Market size and forecast 2024-2029 ($ million)
- Exhibits23: Chart on Global Market: Year-over-year growth 2024-2029 (%)
- Exhibits24: Data Table on Global Market: Year-over-year growth 2024-2029 (%)
- Exhibits25: Historic Market Size - Data Table on Global Corrugated Box Making Machine Market 2019 - 2023 ($ million)
- Exhibits26: Historic Market Size - End-user Segment 2019 - 2023 ($ million)
- Exhibits27: Historic Market Size - Technology Segment 2019 - 2023 ($ million)
- Exhibits28: Historic Market Size - Product Type Segment 2019 - 2023 ($ million)
- Exhibits29: Historic Market Size - Geography Segment 2019 - 2023 ($ million)
- Exhibits30: Historic Market Size - Country Segment 2019 - 2023 ($ million)
- Exhibits31: Five forces analysis - Comparison between 2024 and 2029
- Exhibits32: Bargaining power of buyers - Impact of key factors 2024 and 2029
- Exhibits33: Bargaining power of suppliers - Impact of key factors in 2024 and 2029
- Exhibits34: Threat of new entrants - Impact of key factors in 2024 and 2029
- Exhibits35: Threat of substitutes - Impact of key factors in 2024 and 2029
- Exhibits36: Threat of rivalry - Impact of key factors in 2024 and 2029
- Exhibits37: Chart on Market condition - Five forces 2024 and 2029
- Exhibits38: Chart on End-user - Market share 2024-2029 (%)
- Exhibits39: Data Table on End-user - Market share 2024-2029 (%)
- Exhibits40: Chart on Comparison by End-user
- Exhibits41: Data Table on Comparison by End-user
- Exhibits42: Chart on Food and beverages - Market size and forecast 2024-2029 ($ million)
- Exhibits43: Data Table on Food and beverages - Market size and forecast 2024-2029 ($ million)
- Exhibits44: Chart on Food and beverages - Year-over-year growth 2024-2029 (%)
- Exhibits45: Data Table on Food and beverages - Year-over-year growth 2024-2029 (%)
- Exhibits46: Chart on Electronic goods - Market size and forecast 2024-2029 ($ million)
- Exhibits47: Data Table on Electronic goods - Market size and forecast 2024-2029 ($ million)
- Exhibits48: Chart on Electronic goods - Year-over-year growth 2024-2029 (%)
- Exhibits49: Data Table on Electronic goods - Year-over-year growth 2024-2029 (%)
- Exhibits50: Chart on Home and personal care goods - Market size and forecast 2024-2029 ($ million)
- Exhibits51: Data Table on Home and personal care goods - Market size and forecast 2024-2029 ($ million)
- Exhibits52: Chart on Home and personal care goods - Year-over-year growth 2024-2029 (%)
- Exhibits53: Data Table on Home and personal care goods - Year-over-year growth 2024-2029 (%)
- Exhibits54: Chart on Textile goods - Market size and forecast 2024-2029 ($ million)
- Exhibits55: Data Table on Textile goods - Market size and forecast 2024-2029 ($ million)
- Exhibits56: Chart on Textile goods - Year-over-year growth 2024-2029 (%)
- Exhibits57: Data Table on Textile goods - Year-over-year growth 2024-2029 (%)
- Exhibits58: Chart on Others - Market size and forecast 2024-2029 ($ million)
- Exhibits59: Data Table on Others - Market size and forecast 2024-2029 ($ million)
- Exhibits60: Chart on Others - Year-over-year growth 2024-2029 (%)
- Exhibits61: Data Table on Others - Year-over-year growth 2024-2029 (%)
- Exhibits62: Market opportunity by End-user ($ million)
- Exhibits63: Data Table on Market opportunity by End-user ($ million)
- Exhibits64: Chart on Technology - Market share 2024-2029 (%)
- Exhibits65: Data Table on Technology - Market share 2024-2029 (%)
- Exhibits66: Chart on Comparison by Technology
- Exhibits67: Data Table on Comparison by Technology
- Exhibits68: Chart on Automatic - Market size and forecast 2024-2029 ($ million)
- Exhibits69: Data Table on Automatic - Market size and forecast 2024-2029 ($ million)
- Exhibits70: Chart on Automatic - Year-over-year growth 2024-2029 (%)
- Exhibits71: Data Table on Automatic - Year-over-year growth 2024-2029 (%)
- Exhibits72: Chart on Semi-automatic - Market size and forecast 2024-2029 ($ million)
- Exhibits73: Data Table on Semi-automatic - Market size and forecast 2024-2029 ($ million)
- Exhibits74: Chart on Semi-automatic - Year-over-year growth 2024-2029 (%)
- Exhibits75: Data Table on Semi-automatic - Year-over-year growth 2024-2029 (%)
- Exhibits76: Chart on Manual - Market size and forecast 2024-2029 ($ million)
- Exhibits77: Data Table on Manual - Market size and forecast 2024-2029 ($ million)
- Exhibits78: Chart on Manual - Year-over-year growth 2024-2029 (%)
- Exhibits79: Data Table on Manual - Year-over-year growth 2024-2029 (%)
- Exhibits80: Market opportunity by Technology ($ million)
- Exhibits81: Data Table on Market opportunity by Technology ($ million)
- Exhibits82: Chart on Product Type - Market share 2024-2029 (%)
- Exhibits83: Data Table on Product Type - Market share 2024-2029 (%)
- Exhibits84: Chart on Comparison by Product Type
- Exhibits85: Data Table on Comparison by Product Type
- Exhibits86: Chart on High-capacity machines - Market size and forecast 2024-2029 ($ million)
- Exhibits87: Data Table on High-capacity machines - Market size and forecast 2024-2029 ($ million)
- Exhibits88: Chart on High-capacity machines - Year-over-year growth 2024-2029 (%)
- Exhibits89: Data Table on High-capacity machines - Year-over-year growth 2024-2029 (%)
- Exhibits90: Chart on Medium-capacity machines - Market size and forecast 2024-2029 ($ million)
- Exhibits91: Data Table on Medium-capacity machines - Market size and forecast 2024-2029 ($ million)
- Exhibits92: Chart on Medium-capacity machines - Year-over-year growth 2024-2029 (%)
- Exhibits93: Data Table on Medium-capacity machines - Year-over-year growth 2024-2029 (%)
- Exhibits94: Chart on Low-capacity machines - Market size and forecast 2024-2029 ($ million)
- Exhibits95: Data Table on Low-capacity machines - Market size and forecast 2024-2029 ($ million)
- Exhibits96: Chart on Low-capacity machines - Year-over-year growth 2024-2029 (%)
- Exhibits97: Data Table on Low-capacity machines - Year-over-year growth 2024-2029 (%)
- Exhibits98: Market opportunity by Product Type ($ million)
- Exhibits99: Data Table on Market opportunity by Product Type ($ million)
- Exhibits100: Analysis of price sensitivity, lifecycle, customer purchase basket, adoption rates, and purchase criteria
- Exhibits101: Chart on Market share By Geographical Landscape 2024-2029 (%)
- Exhibits102: Data Table on Market share By Geographical Landscape 2024-2029 (%)
- Exhibits103: Chart on Geographic comparison
- Exhibits104: Data Table on Geographic comparison
- Exhibits105: Chart on APAC - Market size and forecast 2024-2029 ($ million)
- Exhibits106: Data Table on APAC - Market size and forecast 2024-2029 ($ million)
- Exhibits107: Chart on APAC - Year-over-year growth 2024-2029 (%)
- Exhibits108: Data Table on APAC - Year-over-year growth 2024-2029 (%)
- Exhibits109: Chart on North America - Market size and forecast 2024-2029 ($ million)
- Exhibits110: Data Table on North America - Market size and forecast 2024-2029 ($ million)
- Exhibits111: Chart on North America - Year-over-year growth 2024-2029 (%)
- Exhibits112: Data Table on North America - Year-over-year growth 2024-2029 (%)
- Exhibits113: Chart on Europe - Market size and forecast 2024-2029 ($ million)
- Exhibits114: Data Table on Europe - Market size and forecast 2024-2029 ($ million)
- Exhibits115: Chart on Europe - Year-over-year growth 2024-2029 (%)
- Exhibits116: Data Table on Europe - Year-over-year growth 2024-2029 (%)
- Exhibits117: Chart on Middle East and Africa - Market size and forecast 2024-2029 ($ million)
- Exhibits118: Data Table on Middle East and Africa - Market size and forecast 2024-2029 ($ million)
- Exhibits119: Chart on Middle East and Africa - Year-over-year growth 2024-2029 (%)
- Exhibits120: Data Table on Middle East and Africa - Year-over-year growth 2024-2029 (%)
- Exhibits121: Chart on South America - Market size and forecast 2024-2029 ($ million)
- Exhibits122: Data Table on South America - Market size and forecast 2024-2029 ($ million)
- Exhibits123: Chart on South America - Year-over-year growth 2024-2029 (%)
- Exhibits124: Data Table on South America - Year-over-year growth 2024-2029 (%)
- Exhibits125: Chart on US - Market size and forecast 2024-2029 ($ million)
- Exhibits126: Data Table on US - Market size and forecast 2024-2029 ($ million)
- Exhibits127: Chart on US - Year-over-year growth 2024-2029 (%)
- Exhibits128: Data Table on US - Year-over-year growth 2024-2029 (%)
- Exhibits129: Chart on China - Market size and forecast 2024-2029 ($ million)
- Exhibits130: Data Table on China - Market size and forecast 2024-2029 ($ million)
- Exhibits131: Chart on China - Year-over-year growth 2024-2029 (%)
- Exhibits132: Data Table on China - Year-over-year growth 2024-2029 (%)
- Exhibits133: Chart on India - Market size and forecast 2024-2029 ($ million)
- Exhibits134: Data Table on India - Market size and forecast 2024-2029 ($ million)
- Exhibits135: Chart on India - Year-over-year growth 2024-2029 (%)
- Exhibits136: Data Table on India - Year-over-year growth 2024-2029 (%)
- Exhibits137: Chart on Japan - Market size and forecast 2024-2029 ($ million)
- Exhibits138: Data Table on Japan - Market size and forecast 2024-2029 ($ million)
- Exhibits139: Chart on Japan - Year-over-year growth 2024-2029 (%)
- Exhibits140: Data Table on Japan - Year-over-year growth 2024-2029 (%)
- Exhibits141: Chart on Germany - Market size and forecast 2024-2029 ($ million)
- Exhibits142: Data Table on Germany - Market size and forecast 2024-2029 ($ million)
- Exhibits143: Chart on Germany - Year-over-year growth 2024-2029 (%)
- Exhibits144: Data Table on Germany - Year-over-year growth 2024-2029 (%)
- Exhibits145: Chart on Canada - Market size and forecast 2024-2029 ($ million)
- Exhibits146: Data Table on Canada - Market size and forecast 2024-2029 ($ million)
- Exhibits147: Chart on Canada - Year-over-year growth 2024-2029 (%)
- Exhibits148: Data Table on Canada - Year-over-year growth 2024-2029 (%)
- Exhibits149: Chart on South Korea - Market size and forecast 2024-2029 ($ million)
- Exhibits150: Data Table on South Korea - Market size and forecast 2024-2029 ($ million)
- Exhibits151: Chart on South Korea - Year-over-year growth 2024-2029 (%)
- Exhibits152: Data Table on South Korea - Year-over-year growth 2024-2029 (%)
- Exhibits153: Chart on Australia - Market size and forecast 2024-2029 ($ million)
- Exhibits154: Data Table on Australia - Market size and forecast 2024-2029 ($ million)
- Exhibits155: Chart on Australia - Year-over-year growth 2024-2029 (%)
- Exhibits156: Data Table on Australia - Year-over-year growth 2024-2029 (%)
- Exhibits157: Chart on UK - Market size and forecast 2024-2029 ($ million)
- Exhibits158: Data Table on UK - Market size and forecast 2024-2029 ($ million)
- Exhibits159: Chart on UK - Year-over-year growth 2024-2029 (%)
- Exhibits160: Data Table on UK - Year-over-year growth 2024-2029 (%)
- Exhibits161: Chart on France - Market size and forecast 2024-2029 ($ million)
- Exhibits162: Data Table on France - Market size and forecast 2024-2029 ($ million)
- Exhibits163: Chart on France - Year-over-year growth 2024-2029 (%)
- Exhibits164: Data Table on France - Year-over-year growth 2024-2029 (%)
- Exhibits165: Market opportunity By Geographical Landscape ($ million)
- Exhibits166: Data Tables on Market opportunity By Geographical Landscape ($ million)
- Exhibits167: Impact of drivers and challenges in 2024 and 2029
- Exhibits168: Overview on criticality of inputs and factors of differentiation
- Exhibits169: Overview on factors of disruption
- Exhibits170: Impact of key risks on business
- Exhibits171: Companies covered
- Exhibits172: Company ranking index
- Exhibits173: Matrix on companies position and classification
- Exhibits174: Acme Machinery Co. - Overview
- Exhibits175: Acme Machinery Co. - Product / Service
- Exhibits176: Acme Machinery Co. - Key offerings
- Exhibits177: SWOT
- Exhibits178: Bobst Group SA - Overview
- Exhibits179: Bobst Group SA - Business segments
- Exhibits180: Bobst Group SA - Key news
- Exhibits181: Bobst Group SA - Key offerings
- Exhibits182: Bobst Group SA - Segment focus
- Exhibits183: SWOT
- Exhibits184: EMBA Machinery AB - Overview
- Exhibits185: EMBA Machinery AB - Product / Service
- Exhibits186: EMBA Machinery AB - Key offerings
- Exhibits187: SWOT
- Exhibits188: Fosber Spa - Overview
- Exhibits189: Fosber Spa - Product / Service
- Exhibits190: Fosber Spa - Key news
- Exhibits191: Fosber Spa - Key offerings
- Exhibits192: SWOT
- Exhibits193: Guangdong Hongming Intelligent Joint Stock Co. Ltd. - Overview
- Exhibits194: Guangdong Hongming Intelligent Joint Stock Co. Ltd. - Product / Service
- Exhibits195: Guangdong Hongming Intelligent Joint Stock Co. Ltd. - Key offerings
- Exhibits196: SWOT
- Exhibits197: Hebei Shengli Carton Equipment Manufacturing Co. Ltd. - Overview
- Exhibits198: Hebei Shengli Carton Equipment Manufacturing Co. Ltd. - Product / Service
- Exhibits199: Hebei Shengli Carton Equipment Manufacturing Co. Ltd. - Key offerings
- Exhibits200: SWOT
- Exhibits201: ISOWA Corp. - Overview
- Exhibits202: ISOWA Corp. - Product / Service
- Exhibits203: ISOWA Corp. - Key offerings
- Exhibits204: SWOT
- Exhibits205: KOLBUS GmbH and Co. KG - Overview
- Exhibits206: KOLBUS GmbH and Co. KG - Product / Service
- Exhibits207: KOLBUS GmbH and Co. KG - Key offerings
- Exhibits208: SWOT
- Exhibits209: Mitsubishi Heavy Industries Ltd. - Overview
- Exhibits210: Mitsubishi Heavy Industries Ltd. - Business segments
- Exhibits211: Mitsubishi Heavy Industries Ltd. - Key news
- Exhibits212: Mitsubishi Heavy Industries Ltd. - Key offerings
- Exhibits213: Mitsubishi Heavy Industries Ltd. - Segment focus
- Exhibits214: SWOT
- Exhibits215: Natraj Corrugating Machinery Co. - Overview
- Exhibits216: Natraj Corrugating Machinery Co. - Product / Service
- Exhibits217: Natraj Corrugating Machinery Co. - Key offerings
- Exhibits218: SWOT
- Exhibits219: Panotec Srl - Overview
- Exhibits220: Panotec Srl - Product / Service
- Exhibits221: Panotec Srl - Key offerings
- Exhibits222: SWOT
- Exhibits223: Serpa Packaging Solutions LLC - Overview
- Exhibits224: Serpa Packaging Solutions LLC - Product / Service
- Exhibits225: Serpa Packaging Solutions LLC - Key offerings
- Exhibits226: SWOT
- Exhibits227: Shanghai PrintYoung International Industry Co. Ltd. - Overview
- Exhibits228: Shanghai PrintYoung International Industry Co. Ltd. - Product / Service
- Exhibits229: Shanghai PrintYoung International Industry Co. Ltd. - Key offerings
- Exhibits230: SWOT
- Exhibits231: Shinko Machine Mfg. Co. Ltd. - Overview
- Exhibits232: Shinko Machine Mfg. Co. Ltd. - Product / Service
- Exhibits233: Shinko Machine Mfg. Co. Ltd. - Key offerings
- Exhibits234: SWOT
- Exhibits235: SUN Automation Group - Overview
- Exhibits236: SUN Automation Group - Product / Service
- Exhibits237: SUN Automation Group - Key offerings
- Exhibits238: SWOT
- Exhibits239: Inclusions checklist
- Exhibits240: Exclusions checklist
- Exhibits241: Currency conversion rates for US$
- Exhibits242: Research methodology
- Exhibits243: Information sources
- Exhibits244: Data validation
- Exhibits245: Validation techniques employed for market sizing
- Exhibits246: Data synthesis
- Exhibits247: 360 degree market analysis
- Exhibits248: List of abbreviations
The corrugated box making machine market is forecasted to grow by USD 821.2 mn during 2024-2029, accelerating at a CAGR of 5.4% during the forecast period. The report on the corrugated box making machine market provides a holistic analysis, market size and forecast, trends, growth drivers, and challenges, as well as vendor analysis covering around 25 vendors.
The report offers an up-to-date analysis regarding the current market scenario, the latest trends and drivers, and the overall market environment. The market is driven by exponential growth in e-commerce industry, emergence of automation, and need to reduce outsourcing costs.
| Market Scope | |
|---|---|
| Base Year | 2025 |
| End Year | 2029 |
| Series Year | 2025-2029 |
| Growth Momentum | Accelerate |
| YOY 2025 | 5% |
| CAGR | 5.4% |
| Incremental Value | $821.2 mn |
The study was conducted using an objective combination of primary and secondary information including inputs from key participants in the industry. The report contains a comprehensive market size data, segment with regional analysis and vendor landscape in addition to an analysis of the key companies. Reports have historic and forecast data.
Technavio's corrugated box making machine market is segmented as below:
By End-user
- Food and beverages
- Electronic goods
- Home and personal care goods
- Textile goods
- Others
By Technology
- Automatic
- Semi-automatic
- Manual
By Product Type
- High-capacity machines
- Medium-capacity machines
- Low-capacity machines
By Geographical Landscape
- APAC
- North America
- Europe
- Middle East and Africa
- South America
This study identifies the increase in adoption of smart packaging as one of the prime reasons driving the corrugated box making machine market growth during the next few years. Also, environment-friendly corrugated box-making machines and production of lightweight corrugated boxes will lead to sizable demand in the market.
The report on the corrugated box making machine market covers the following areas:
- Corrugated Box Making Machine Market sizing
- Corrugated Box Making Machine Market forecast
- Corrugated Box Making Machine Market industry analysis
The robust vendor analysis is designed to help clients improve their market position, and in line with this, this report provides a detailed analysis of several leading corrugated box making machine market vendors that include Acme Machinery Co., Bobst Group SA, EMBA Machinery AB, Fosber Spa, Guangdong Hongming Intelligent Joint Stock Co. Ltd., Hebei Shengli Carton Equipment Manufacturing Co. Ltd., ISOWA Corp., KOLBUS GmbH and Co. KG, Mitsubishi Heavy Industries Ltd., Natraj Corrugating Machinery Co., Panotec Srl, Serpa Packaging Solutions LLC, Shanghai PrintYoung International Industry Co. Ltd., Shinko Machine Mfg. Co. Ltd., SUN Automation Group, Sunrise Pacific Co. Ltd., Valco Cincinnati Inc., Wenzhou Zhongke Packaging Machinery Co. Ltd., and Zemat Technology Group Ltd.. Also, the corrugated box making machine market analysis report includes information on upcoming trends and challenges that will influence market growth. This is to help companies strategize and leverage all forthcoming growth opportunities.
The publisher presents a detailed picture of the market by the way of study, synthesis, and summation of data from multiple sources by an analysis of key parameters such as profit, pricing, competition, and promotions. It presents various market facets by identifying the key industry influencers. The data presented is comprehensive, reliable, and a result of extensive primary and secondary research. The market research reports provide a complete competitive landscape and an in-depth vendor selection methodology and analysis using qualitative and quantitative research to forecast accurate market growth.
Table of Contents
1 Executive Summary
- 1.1 Market overview
- Executive Summary - Chart on Market Overview
- Executive Summary - Data Table on Market Overview
- Executive Summary - Chart on Global Market Characteristics
- Executive Summary - Chart on Market By Geographical Landscape
- Executive Summary - Chart on Market Segmentation by End-user
- Executive Summary - Chart on Market Segmentation by Technology
- Executive Summary - Chart on Market Segmentation by Product Type
- Executive Summary - Chart on Incremental Growth
- Executive Summary - Data Table on Incremental Growth
- Executive Summary - Chart on Company Market Positioning
2 Technavio Analysis
- 2.1 Analysis of price sensitivity, lifecycle, customer purchase basket, adoption rates, and purchase criteria
- Analysis of price sensitivity, lifecycle, customer purchase basket, adoption rates, and purchase criteria
- 2.2 Criticality of inputs and Factors of differentiation
- Overview on criticality of inputs and factors of differentiation
- 2.3 Factors of disruption
- Overview on factors of disruption
- 2.4 Impact of drivers and challenges
- Impact of drivers and challenges in 2024 and 2029
3 Market Landscape
- 3.1 Market ecosystem
- Parent Market
- Data Table on - Parent Market
- 3.2 Market characteristics
- Market characteristics analysis
- 3.3 Value chain analysis
- Value chain analysis
4 Market Sizing
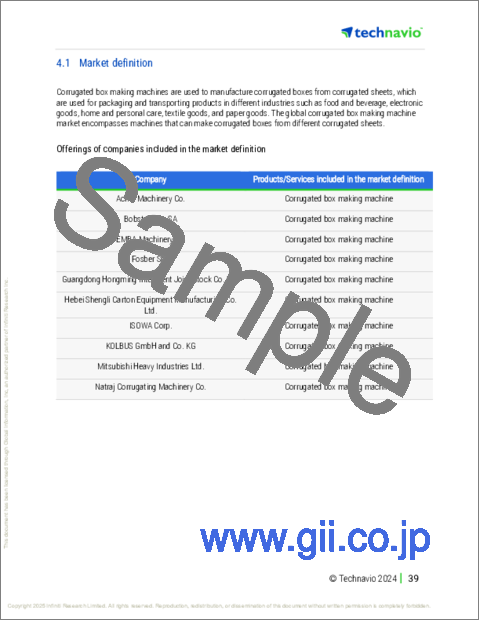
- 4.1 Market definition
- Offerings of companies included in the market definition
- 4.2 Market segment analysis
- Market segments
- 4.3 Market size 2024
- 4.4 Market outlook: Forecast for 2024-2029
- Chart on Global - Market size and forecast 2024-2029 ($ million)
- Data Table on Global - Market size and forecast 2024-2029 ($ million)
- Chart on Global Market: Year-over-year growth 2024-2029 (%)
- Data Table on Global Market: Year-over-year growth 2024-2029 (%)
5 Historic Market Size
- 5.1 Global Corrugated Box Making Machine Market 2019 - 2023
- Historic Market Size - Data Table on Global Corrugated Box Making Machine Market 2019 - 2023 ($ million)
- 5.2 End-user segment analysis 2019 - 2023
- Historic Market Size - End-user Segment 2019 - 2023 ($ million)
- 5.3 Technology segment analysis 2019 - 2023
- Historic Market Size - Technology Segment 2019 - 2023 ($ million)
- 5.4 Product Type segment analysis 2019 - 2023
- Historic Market Size - Product Type Segment 2019 - 2023 ($ million)
- 5.5 Geography segment analysis 2019 - 2023
- Historic Market Size - Geography Segment 2019 - 2023 ($ million)
- 5.6 Country segment analysis 2019 - 2023
- Historic Market Size - Country Segment 2019 - 2023 ($ million)
6 Qualitative Analysis
- 6.1 Impact of AI on Global Corrugated Box Making Machine Market
7 Five Forces Analysis
- 7.1 Five forces summary
- Five forces analysis - Comparison between 2024 and 2029
- 7.2 Bargaining power of buyers
- Bargaining power of buyers - Impact of key factors 2024 and 2029
- 7.3 Bargaining power of suppliers
- Bargaining power of suppliers - Impact of key factors in 2024 and 2029
- 7.4 Threat of new entrants
- Threat of new entrants - Impact of key factors in 2024 and 2029
- 7.5 Threat of substitutes
- Threat of substitutes - Impact of key factors in 2024 and 2029
- 7.6 Threat of rivalry
- Threat of rivalry - Impact of key factors in 2024 and 2029
- 7.7 Market condition
- Chart on Market condition - Five forces 2024 and 2029
8 Market Segmentation by End-user
- 8.1 Market segments
- Chart on End-user - Market share 2024-2029 (%)
- Data Table on End-user - Market share 2024-2029 (%)
- 8.2 Comparison by End-user
- Chart on Comparison by End-user
- Data Table on Comparison by End-user
- 8.3 Food and beverages - Market size and forecast 2024-2029
- Chart on Food and beverages - Market size and forecast 2024-2029 ($ million)
- Data Table on Food and beverages - Market size and forecast 2024-2029 ($ million)
- Chart on Food and beverages - Year-over-year growth 2024-2029 (%)
- Data Table on Food and beverages - Year-over-year growth 2024-2029 (%)
- 8.4 Electronic goods - Market size and forecast 2024-2029
- Chart on Electronic goods - Market size and forecast 2024-2029 ($ million)
- Data Table on Electronic goods - Market size and forecast 2024-2029 ($ million)
- Chart on Electronic goods - Year-over-year growth 2024-2029 (%)
- Data Table on Electronic goods - Year-over-year growth 2024-2029 (%)
- 8.5 Home and personal care goods - Market size and forecast 2024-2029
- Chart on Home and personal care goods - Market size and forecast 2024-2029 ($ million)
- Data Table on Home and personal care goods - Market size and forecast 2024-2029 ($ million)
- Chart on Home and personal care goods - Year-over-year growth 2024-2029 (%)
- Data Table on Home and personal care goods - Year-over-year growth 2024-2029 (%)
- 8.6 Textile goods - Market size and forecast 2024-2029
- Chart on Textile goods - Market size and forecast 2024-2029 ($ million)
- Data Table on Textile goods - Market size and forecast 2024-2029 ($ million)
- Chart on Textile goods - Year-over-year growth 2024-2029 (%)
- Data Table on Textile goods - Year-over-year growth 2024-2029 (%)
- 8.7 Others - Market size and forecast 2024-2029
- Chart on Others - Market size and forecast 2024-2029 ($ million)
- Data Table on Others - Market size and forecast 2024-2029 ($ million)
- Chart on Others - Year-over-year growth 2024-2029 (%)
- Data Table on Others - Year-over-year growth 2024-2029 (%)
- 8.8 Market opportunity by End-user
- Market opportunity by End-user ($ million)
- Data Table on Market opportunity by End-user ($ million)
9 Market Segmentation by Technology
- 9.1 Market segments
- Chart on Technology - Market share 2024-2029 (%)
- Data Table on Technology - Market share 2024-2029 (%)
- 9.2 Comparison by Technology
- Chart on Comparison by Technology
- Data Table on Comparison by Technology
- 9.3 Automatic - Market size and forecast 2024-2029
- Chart on Automatic - Market size and forecast 2024-2029 ($ million)
- Data Table on Automatic - Market size and forecast 2024-2029 ($ million)
- Chart on Automatic - Year-over-year growth 2024-2029 (%)
- Data Table on Automatic - Year-over-year growth 2024-2029 (%)
- 9.4 Semi-automatic - Market size and forecast 2024-2029
- Chart on Semi-automatic - Market size and forecast 2024-2029 ($ million)
- Data Table on Semi-automatic - Market size and forecast 2024-2029 ($ million)
- Chart on Semi-automatic - Year-over-year growth 2024-2029 (%)
- Data Table on Semi-automatic - Year-over-year growth 2024-2029 (%)
- 9.5 Manual - Market size and forecast 2024-2029
- Chart on Manual - Market size and forecast 2024-2029 ($ million)
- Data Table on Manual - Market size and forecast 2024-2029 ($ million)
- Chart on Manual - Year-over-year growth 2024-2029 (%)
- Data Table on Manual - Year-over-year growth 2024-2029 (%)
- 9.6 Market opportunity by Technology
- Market opportunity by Technology ($ million)
- Data Table on Market opportunity by Technology ($ million)
10 Market Segmentation by Product Type
- 10.1 Market segments
- Chart on Product Type - Market share 2024-2029 (%)
- Data Table on Product Type - Market share 2024-2029 (%)
- 10.2 Comparison by Product Type
- Chart on Comparison by Product Type
- Data Table on Comparison by Product Type
- 10.3 High-capacity machines - Market size and forecast 2024-2029
- Chart on High-capacity machines - Market size and forecast 2024-2029 ($ million)
- Data Table on High-capacity machines - Market size and forecast 2024-2029 ($ million)
- Chart on High-capacity machines - Year-over-year growth 2024-2029 (%)
- Data Table on High-capacity machines - Year-over-year growth 2024-2029 (%)
- 10.4 Medium-capacity machines - Market size and forecast 2024-2029
- Chart on Medium-capacity machines - Market size and forecast 2024-2029 ($ million)
- Data Table on Medium-capacity machines - Market size and forecast 2024-2029 ($ million)
- Chart on Medium-capacity machines - Year-over-year growth 2024-2029 (%)
- Data Table on Medium-capacity machines - Year-over-year growth 2024-2029 (%)
- 10.5 Low-capacity machines - Market size and forecast 2024-2029
- Chart on Low-capacity machines - Market size and forecast 2024-2029 ($ million)
- Data Table on Low-capacity machines - Market size and forecast 2024-2029 ($ million)
- Chart on Low-capacity machines - Year-over-year growth 2024-2029 (%)
- Data Table on Low-capacity machines - Year-over-year growth 2024-2029 (%)
- 10.6 Market opportunity by Product Type
- Market opportunity by Product Type ($ million)
- Data Table on Market opportunity by Product Type ($ million)
11 Customer Landscape
- 11.1 Customer landscape overview
- Analysis of price sensitivity, lifecycle, customer purchase basket, adoption rates, and purchase criteria
12 Geographic Landscape
- 12.1 Geographic segmentation
- Chart on Market share By Geographical Landscape 2024-2029 (%)
- Data Table on Market share By Geographical Landscape 2024-2029 (%)
- 12.2 Geographic comparison
- Chart on Geographic comparison
- Data Table on Geographic comparison
- 12.3 APAC - Market size and forecast 2024-2029
- Chart on APAC - Market size and forecast 2024-2029 ($ million)
- Data Table on APAC - Market size and forecast 2024-2029 ($ million)
- Chart on APAC - Year-over-year growth 2024-2029 (%)
- Data Table on APAC - Year-over-year growth 2024-2029 (%)
- 12.4 North America - Market size and forecast 2024-2029
- Chart on North America - Market size and forecast 2024-2029 ($ million)
- Data Table on North America - Market size and forecast 2024-2029 ($ million)
- Chart on North America - Year-over-year growth 2024-2029 (%)
- Data Table on North America - Year-over-year growth 2024-2029 (%)
- 12.5 Europe - Market size and forecast 2024-2029
- Chart on Europe - Market size and forecast 2024-2029 ($ million)
- Data Table on Europe - Market size and forecast 2024-2029 ($ million)
- Chart on Europe - Year-over-year growth 2024-2029 (%)
- Data Table on Europe - Year-over-year growth 2024-2029 (%)
- 12.6 Middle East and Africa - Market size and forecast 2024-2029
- Chart on Middle East and Africa - Market size and forecast 2024-2029 ($ million)
- Data Table on Middle East and Africa - Market size and forecast 2024-2029 ($ million)
- Chart on Middle East and Africa - Year-over-year growth 2024-2029 (%)
- Data Table on Middle East and Africa - Year-over-year growth 2024-2029 (%)
- 12.7 South America - Market size and forecast 2024-2029
- Chart on South America - Market size and forecast 2024-2029 ($ million)
- Data Table on South America - Market size and forecast 2024-2029 ($ million)
- Chart on South America - Year-over-year growth 2024-2029 (%)
- Data Table on South America - Year-over-year growth 2024-2029 (%)
- 12.8 US - Market size and forecast 2024-2029
- Chart on US - Market size and forecast 2024-2029 ($ million)
- Data Table on US - Market size and forecast 2024-2029 ($ million)
- Chart on US - Year-over-year growth 2024-2029 (%)
- Data Table on US - Year-over-year growth 2024-2029 (%)
- 12.9 China - Market size and forecast 2024-2029
- Chart on China - Market size and forecast 2024-2029 ($ million)
- Data Table on China - Market size and forecast 2024-2029 ($ million)
- Chart on China - Year-over-year growth 2024-2029 (%)
- Data Table on China - Year-over-year growth 2024-2029 (%)
- 12.10 India - Market size and forecast 2024-2029
- Chart on India - Market size and forecast 2024-2029 ($ million)
- Data Table on India - Market size and forecast 2024-2029 ($ million)
- Chart on India - Year-over-year growth 2024-2029 (%)
- Data Table on India - Year-over-year growth 2024-2029 (%)
- 12.11 Japan - Market size and forecast 2024-2029
- Chart on Japan - Market size and forecast 2024-2029 ($ million)
- Data Table on Japan - Market size and forecast 2024-2029 ($ million)
- Chart on Japan - Year-over-year growth 2024-2029 (%)
- Data Table on Japan - Year-over-year growth 2024-2029 (%)
- 12.12 Germany - Market size and forecast 2024-2029
- Chart on Germany - Market size and forecast 2024-2029 ($ million)
- Data Table on Germany - Market size and forecast 2024-2029 ($ million)
- Chart on Germany - Year-over-year growth 2024-2029 (%)
- Data Table on Germany - Year-over-year growth 2024-2029 (%)
- 12.13 Canada - Market size and forecast 2024-2029
- Chart on Canada - Market size and forecast 2024-2029 ($ million)
- Data Table on Canada - Market size and forecast 2024-2029 ($ million)
- Chart on Canada - Year-over-year growth 2024-2029 (%)
- Data Table on Canada - Year-over-year growth 2024-2029 (%)
- 12.14 South Korea - Market size and forecast 2024-2029
- Chart on South Korea - Market size and forecast 2024-2029 ($ million)
- Data Table on South Korea - Market size and forecast 2024-2029 ($ million)
- Chart on South Korea - Year-over-year growth 2024-2029 (%)
- Data Table on South Korea - Year-over-year growth 2024-2029 (%)
- 12.15 Australia - Market size and forecast 2024-2029
- Chart on Australia - Market size and forecast 2024-2029 ($ million)
- Data Table on Australia - Market size and forecast 2024-2029 ($ million)
- Chart on Australia - Year-over-year growth 2024-2029 (%)
- Data Table on Australia - Year-over-year growth 2024-2029 (%)
- 12.16 UK - Market size and forecast 2024-2029
- Chart on UK - Market size and forecast 2024-2029 ($ million)
- Data Table on UK - Market size and forecast 2024-2029 ($ million)
- Chart on UK - Year-over-year growth 2024-2029 (%)
- Data Table on UK - Year-over-year growth 2024-2029 (%)
- 12.17 France - Market size and forecast 2024-2029
- Chart on France - Market size and forecast 2024-2029 ($ million)
- Data Table on France - Market size and forecast 2024-2029 ($ million)
- Chart on France - Year-over-year growth 2024-2029 (%)
- Data Table on France - Year-over-year growth 2024-2029 (%)
- 12.18 Market opportunity By Geographical Landscape
- Market opportunity By Geographical Landscape ($ million)
- Data Tables on Market opportunity By Geographical Landscape ($ million)
13 Drivers, Challenges, and Opportunity/Restraints
- 13.1 Market drivers
- 13.2 Market challenges
- 13.3 Impact of drivers and challenges
- Impact of drivers and challenges in 2024 and 2029
- 13.4 Market opportunities/restraints
14 Competitive Landscape
- 14.1 Overview
- 14.2 Competitive Landscape
- Overview on criticality of inputs and factors of differentiation
- 14.3 Landscape disruption
- Overview on factors of disruption
- 14.4 Industry risks
- Impact of key risks on business
15 Competitive Analysis
- 15.1 Companies profiled
- Companies covered
- 15.2 Company ranking index
- Company ranking index
- 15.3 Market positioning of companies
- Matrix on companies position and classification
- 15.4 Acme Machinery Co.
- Acme Machinery Co. - Overview
- Acme Machinery Co. - Product / Service
- Acme Machinery Co. - Key offerings
- SWOT
- 15.5 Bobst Group SA
- Bobst Group SA - Overview
- Bobst Group SA - Business segments
- Bobst Group SA - Key news
- Bobst Group SA - Key offerings
- Bobst Group SA - Segment focus
- SWOT
- 15.6 EMBA Machinery AB
- EMBA Machinery AB - Overview
- EMBA Machinery AB - Product / Service
- EMBA Machinery AB - Key offerings
- SWOT
- 15.7 Fosber Spa
- Fosber Spa - Overview
- Fosber Spa - Product / Service
- Fosber Spa - Key news
- Fosber Spa - Key offerings
- SWOT
- 15.8 Guangdong Hongming Intelligent Joint Stock Co. Ltd.
- Guangdong Hongming Intelligent Joint Stock Co. Ltd. - Overview
- Guangdong Hongming Intelligent Joint Stock Co. Ltd. - Product / Service
- Guangdong Hongming Intelligent Joint Stock Co. Ltd. - Key offerings
- SWOT
- 15.9 Hebei Shengli Carton Equipment Manufacturing Co. Ltd.
- Hebei Shengli Carton Equipment Manufacturing Co. Ltd. - Overview
- Hebei Shengli Carton Equipment Manufacturing Co. Ltd. - Product / Service
- Hebei Shengli Carton Equipment Manufacturing Co. Ltd. - Key offerings
- SWOT
- 15.10 ISOWA Corp.
- ISOWA Corp. - Overview
- ISOWA Corp. - Product / Service
- ISOWA Corp. - Key offerings
- SWOT
- 15.11 KOLBUS GmbH and Co. KG
- KOLBUS GmbH and Co. KG - Overview
- KOLBUS GmbH and Co. KG - Product / Service
- KOLBUS GmbH and Co. KG - Key offerings
- SWOT
- 15.12 Mitsubishi Heavy Industries Ltd.
- Mitsubishi Heavy Industries Ltd. - Overview
- Mitsubishi Heavy Industries Ltd. - Business segments
- Mitsubishi Heavy Industries Ltd. - Key news
- Mitsubishi Heavy Industries Ltd. - Key offerings
- Mitsubishi Heavy Industries Ltd. - Segment focus
- SWOT
- 15.13 Natraj Corrugating Machinery Co.
- Natraj Corrugating Machinery Co. - Overview
- Natraj Corrugating Machinery Co. - Product / Service
- Natraj Corrugating Machinery Co. - Key offerings
- SWOT
- 15.14 Panotec Srl
- Panotec Srl - Overview
- Panotec Srl - Product / Service
- Panotec Srl - Key offerings
- SWOT
- 15.15 Serpa Packaging Solutions LLC
- Serpa Packaging Solutions LLC - Overview
- Serpa Packaging Solutions LLC - Product / Service
- Serpa Packaging Solutions LLC - Key offerings
- SWOT
- 15.16 Shanghai PrintYoung International Industry Co. Ltd.
- Shanghai PrintYoung International Industry Co. Ltd. - Overview
- Shanghai PrintYoung International Industry Co. Ltd. - Product / Service
- Shanghai PrintYoung International Industry Co. Ltd. - Key offerings
- SWOT
- 15.17 Shinko Machine Mfg. Co. Ltd.
- Shinko Machine Mfg. Co. Ltd. - Overview
- Shinko Machine Mfg. Co. Ltd. - Product / Service
- Shinko Machine Mfg. Co. Ltd. - Key offerings
- SWOT
- 15.18 SUN Automation Group
- SUN Automation Group - Overview
- SUN Automation Group - Product / Service
- SUN Automation Group - Key offerings
- SWOT
16 Appendix
- 16.1 Scope of the report
- 16.2 Inclusions and exclusions checklist
- Inclusions checklist
- Exclusions checklist
- 16.3 Currency conversion rates for US$
- Currency conversion rates for US$
- 16.4 Research methodology
- Research methodology
- 16.5 Data procurement
- Information sources
- 16.6 Data validation
- Data validation
- 16.7 Validation techniques employed for market sizing
- Validation techniques employed for market sizing
- 16.8 Data synthesis
- Data synthesis
- 16.9 360 degree market analysis
- 360 degree market analysis
- 16.10 List of abbreviations
- List of abbreviations

