|
|
市場調査レポート
商品コード
1748555
竹製プレートの世界市場、2025~2029年Global Bamboo Plate Market 2025-2029 |
||||||
|
|||||||
カスタマイズ可能
|
|||||||


| 竹製プレートの世界市場、2025~2029年 |
|
出版日: 2025年06月07日
発行: TechNavio
ページ情報: 英文 202 Pages
納期: 即納可能
|

全表示
- 概要
- 図表
- 目次
竹製プレート市場は2024~2029年に1億1,380万米ドル、予測期間中のCAGRは4.7%で成長すると予測されます。
当レポートでは、竹製プレート市場の全体的な分析、市場規模・予測、動向、成長促進要因、課題、約25のベンダーを網羅したベンダー分析などを掲載しています。
現在の市場シナリオ、最新動向と促進要因、市場環境全体に関する最新分析を提供しています。市場は、オンラインフードケータリングへの竹製プレートの採用増加、企業がサステイナブル竹製プレートに注力していること、政府の規制などが牽引しています。
| 市場範囲 | |
|---|---|
| 基準年 | 2025年 |
| 終了年 | 2029年 |
| 予測期間 | 2025~2029年 |
| 成長モメンタム | 加速 |
| 前年比 | 4.5% |
| CAGR | 4.7% |
| 増分額 | 1億1,380万米ドル |
本調査は、産業の主要参加者からのインプットを含め、一次情報と二次情報を客観的に組み合わせて実施しました。レポートには、主要企業の分析に加え、包括的な市場規模データ、地域分析によるセグメント、ベンダー情勢が含まれています。レポートには過去データと予測データがあります。
本調査では、今後数年間の竹製プレート市場の成長を促進する主要因の一つとして、オンラインショッピングの台頭を挙げています。また、消費者の健康意識の高まりや最近の竹製プレートの開発は、市場の大きな需要につながります。
目次
第1章 エグゼクティブサマリー
- 市場概要
第2章 Technavio分析
- 価格・ライフサイクル・顧客購入バスケット・採用率・購入基準の分析
- インプットの重要性と差別化の要因
- 混乱の要因
- 促進要因と課題の影響
第3章 市場情勢
- 市場エコシステム
- 市場の特徴
- バリューチェーン分析
第4章 市場規模
- 市場の定義
- 市場セグメント分析
- 市場規模 2024年
- 市場の展望 2024~2029年
第5章 市場規模実績
- 竹製プレートの世界市場 2019~2023年
- 製品別セグメント分析 2019~2023年
- エンドユーザー別セグメント分析 2019~2023年
- 流通チャネル別セグメント分析 2019~2023年
- 地域別セグメント分析 2019~2023年
- 国別セグメント分析 2019~2023年
第6章 定性分析
- AIの影響:竹製プレートの世界市場
第7章 ファイブフォース分析
- ファイブフォースの要約
- 買い手の交渉力
- 供給企業の交渉力
- 新規参入業者の脅威
- 代替品の脅威
- 競争の脅威
- 市況
第8章 市場セグメンテーション:製品別
- 市場セグメント
- 比較:製品別
- 使い捨て:市場規模と予測 2024~2029年
- 再利用可能:市場規模と予測 2024~2029年
- 市場機会:製品別
第9章 市場セグメンテーション:エンドユーザー別
- 市場セグメント
- 比較:エンドユーザー別
- 家庭:市場規模と予測 2024~2029年
- レストランとカフェ:市場規模と予測 2024~2029年
- ケータリングサービス:市場規模と予測 2024~2029年
- 業務バイヤー:市場規模と予測 2024~2029年
- 市場機会:エンドユーザー別
第10章 市場セグメンテーション:流通チャネル別
- 市場セグメント
- 比較:流通チャネル別
- オフライン:市場規模と予測 2024~2029年
- オンライン:市場規模と予測 2024~2029年
- 市場機会:流通チャネル別
第11章 顧客情勢
- 顧客情勢概要
第12章 地域別情勢
- 地域別セグメンテーション
- 比較:地域別
- アジア太平洋:市場規模と予測 2024~2029年
- 南米:市場規模と予測 2024~2029年
- 北米:市場規模と予測 2024~2029年
- 欧州:市場規模と予測 2024~2029年
- 中東・アフリカ:市場規模と予測 2024~2029年
- 中国:市場規模と予測 2024~2029年
- インド:市場規模と予測 2024~2029年
- インドネシア:市場規模と予測 2024~2029年
- 日本:市場規模と予測 2024~2029年
- 米国:市場規模と予測 2024~2029年
- ベトナム:市場規模と予測 2024~2029年
- 韓国:市場規模と予測 2024~2029年
- ドイツ:市場規模と予測 2024~2029年
- アルゼンチン:市場規模と予測 2024~2029年
- ブラジル:市場規模と予測 2024~2029年
- 地域情勢による市場機会
第13章 促進要因・課題・機会・抑制要因
- 市場促進要因
- 市場課題
- 促進要因と課題の影響
- 市場機会・抑制要因
第14章 競合情勢
- 概要
- 競合情勢
- 混乱の状況
- 産業のリスク
第15章 競合分析
- 企業プロファイル
- 企業ランキング指数
- 企業の市場ポジショニング
- Anhui Bochen Eco Co.
- Bamboo Bamboo
- bambu LLC
- Earths Dreams SRL
- Eco-Products Inc.
- Get Fresh
- Guadua Bamboo
- Lekoch
- Mann Bamboo Fiber Ware Co. Ltd
- Morgiana
- Pefso Co. Ltd
- Red Butler
- The Mane Lion
- Tulipop
- Xiamen Ebei Import and Export Co. Ltd
第16章 付録
Exhibits:
- Exhibits1: Executive Summary - Chart on Market Overview
- Exhibits2: Executive Summary - Data Table on Market Overview
- Exhibits3: Executive Summary - Chart on Global Market Characteristics
- Exhibits4: Executive Summary - Chart on Market By Geographical Landscape
- Exhibits5: Executive Summary - Chart on Market Segmentation by Product
- Exhibits6: Executive Summary - Chart on Market Segmentation by End-user
- Exhibits7: Executive Summary - Chart on Market Segmentation by Distribution Channel
- Exhibits8: Executive Summary - Chart on Incremental Growth
- Exhibits9: Executive Summary - Data Table on Incremental Growth
- Exhibits10: Executive Summary - Chart on Company Market Positioning
- Exhibits11: Analysis of price sensitivity, lifecycle, customer purchase basket, adoption rates, and purchase criteria
- Exhibits12: Overview on criticality of inputs and factors of differentiation
- Exhibits13: Overview on factors of disruption
- Exhibits14: Impact of drivers and challenges in 2024 and 2029
- Exhibits15: Parent Market
- Exhibits16: Data Table on - Parent Market
- Exhibits17: Market characteristics analysis
- Exhibits18: Value chain analysis
- Exhibits19: Offerings of companies included in the market definition
- Exhibits20: Market segments
- Exhibits21: Chart on Global - Market size and forecast 2024-2029 ($ million)
- Exhibits22: Data Table on Global - Market size and forecast 2024-2029 ($ million)
- Exhibits23: Chart on Global Market: Year-over-year growth 2024-2029 (%)
- Exhibits24: Data Table on Global Market: Year-over-year growth 2024-2029 (%)
- Exhibits25: Historic Market Size - Data Table on Global Bamboo Plate Market 2019 - 2023 ($ million)
- Exhibits26: Historic Market Size - Product Segment 2019 - 2023 ($ million)
- Exhibits27: Historic Market Size - End-user Segment 2019 - 2023 ($ million)
- Exhibits28: Historic Market Size - Distribution Channel Segment 2019 - 2023 ($ million)
- Exhibits29: Historic Market Size - Geography Segment 2019 - 2023 ($ million)
- Exhibits30: Historic Market Size - Country Segment 2019 - 2023 ($ million)
- Exhibits31: Five forces analysis - Comparison between 2024 and 2029
- Exhibits32: Bargaining power of buyers - Impact of key factors 2024 and 2029
- Exhibits33: Bargaining power of suppliers - Impact of key factors in 2024 and 2029
- Exhibits34: Threat of new entrants - Impact of key factors in 2024 and 2029
- Exhibits35: Threat of substitutes - Impact of key factors in 2024 and 2029
- Exhibits36: Threat of rivalry - Impact of key factors in 2024 and 2029
- Exhibits37: Chart on Market condition - Five forces 2024 and 2029
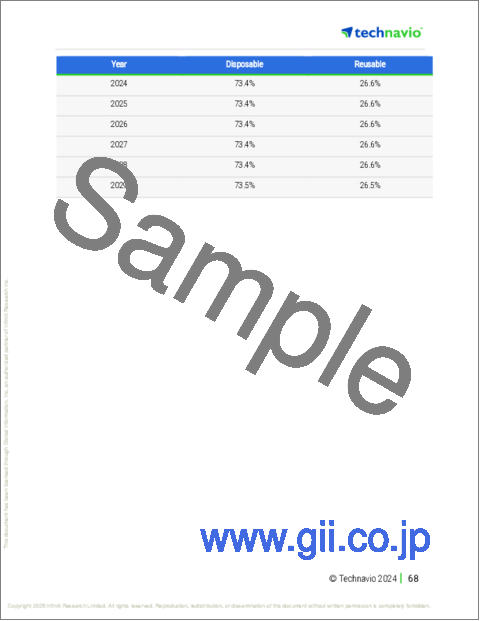
- Exhibits38: Chart on Product - Market share 2024-2029 (%)
- Exhibits39: Data Table on Product - Market share 2024-2029 (%)
- Exhibits40: Chart on Comparison by Product
- Exhibits41: Data Table on Comparison by Product
- Exhibits42: Chart on Disposable - Market size and forecast 2024-2029 ($ million)
- Exhibits43: Data Table on Disposable - Market size and forecast 2024-2029 ($ million)
- Exhibits44: Chart on Disposable - Year-over-year growth 2024-2029 (%)
- Exhibits45: Data Table on Disposable - Year-over-year growth 2024-2029 (%)
- Exhibits46: Chart on Reusable - Market size and forecast 2024-2029 ($ million)
- Exhibits47: Data Table on Reusable - Market size and forecast 2024-2029 ($ million)
- Exhibits48: Chart on Reusable - Year-over-year growth 2024-2029 (%)
- Exhibits49: Data Table on Reusable - Year-over-year growth 2024-2029 (%)
- Exhibits50: Market opportunity by Product ($ million)
- Exhibits51: Data Table on Market opportunity by Product ($ million)
- Exhibits52: Chart on End-user - Market share 2024-2029 (%)
- Exhibits53: Data Table on End-user - Market share 2024-2029 (%)
- Exhibits54: Chart on Comparison by End-user
- Exhibits55: Data Table on Comparison by End-user
- Exhibits56: Chart on Households - Market size and forecast 2024-2029 ($ million)
- Exhibits57: Data Table on Households - Market size and forecast 2024-2029 ($ million)
- Exhibits58: Chart on Households - Year-over-year growth 2024-2029 (%)
- Exhibits59: Data Table on Households - Year-over-year growth 2024-2029 (%)
- Exhibits60: Chart on Restaurants and cafes - Market size and forecast 2024-2029 ($ million)
- Exhibits61: Data Table on Restaurants and cafes - Market size and forecast 2024-2029 ($ million)
- Exhibits62: Chart on Restaurants and cafes - Year-over-year growth 2024-2029 (%)
- Exhibits63: Data Table on Restaurants and cafes - Year-over-year growth 2024-2029 (%)
- Exhibits64: Chart on Catering services - Market size and forecast 2024-2029 ($ million)
- Exhibits65: Data Table on Catering services - Market size and forecast 2024-2029 ($ million)
- Exhibits66: Chart on Catering services - Year-over-year growth 2024-2029 (%)
- Exhibits67: Data Table on Catering services - Year-over-year growth 2024-2029 (%)
- Exhibits68: Chart on Institutional buyers - Market size and forecast 2024-2029 ($ million)
- Exhibits69: Data Table on Institutional buyers - Market size and forecast 2024-2029 ($ million)
- Exhibits70: Chart on Institutional buyers - Year-over-year growth 2024-2029 (%)
- Exhibits71: Data Table on Institutional buyers - Year-over-year growth 2024-2029 (%)
- Exhibits72: Market opportunity by End-user ($ million)
- Exhibits73: Data Table on Market opportunity by End-user ($ million)
- Exhibits74: Chart on Distribution Channel - Market share 2024-2029 (%)
- Exhibits75: Data Table on Distribution Channel - Market share 2024-2029 (%)
- Exhibits76: Chart on Comparison by Distribution Channel
- Exhibits77: Data Table on Comparison by Distribution Channel
- Exhibits78: Chart on Offline - Market size and forecast 2024-2029 ($ million)
- Exhibits79: Data Table on Offline - Market size and forecast 2024-2029 ($ million)
- Exhibits80: Chart on Offline - Year-over-year growth 2024-2029 (%)
- Exhibits81: Data Table on Offline - Year-over-year growth 2024-2029 (%)
- Exhibits82: Chart on Online - Market size and forecast 2024-2029 ($ million)
- Exhibits83: Data Table on Online - Market size and forecast 2024-2029 ($ million)
- Exhibits84: Chart on Online - Year-over-year growth 2024-2029 (%)
- Exhibits85: Data Table on Online - Year-over-year growth 2024-2029 (%)
- Exhibits86: Market opportunity by Distribution Channel ($ million)
- Exhibits87: Data Table on Market opportunity by Distribution Channel ($ million)
- Exhibits88: Analysis of price sensitivity, lifecycle, customer purchase basket, adoption rates, and purchase criteria
- Exhibits89: Chart on Market share By Geographical Landscape 2024-2029 (%)
- Exhibits90: Data Table on Market share By Geographical Landscape 2024-2029 (%)
- Exhibits91: Chart on Geographic comparison
- Exhibits92: Data Table on Geographic comparison
- Exhibits93: Chart on APAC - Market size and forecast 2024-2029 ($ million)
- Exhibits94: Data Table on APAC - Market size and forecast 2024-2029 ($ million)
- Exhibits95: Chart on APAC - Year-over-year growth 2024-2029 (%)
- Exhibits96: Data Table on APAC - Year-over-year growth 2024-2029 (%)
- Exhibits97: Chart on South America - Market size and forecast 2024-2029 ($ million)
- Exhibits98: Data Table on South America - Market size and forecast 2024-2029 ($ million)
- Exhibits99: Chart on South America - Year-over-year growth 2024-2029 (%)
- Exhibits100: Data Table on South America - Year-over-year growth 2024-2029 (%)
- Exhibits101: Chart on North America - Market size and forecast 2024-2029 ($ million)
- Exhibits102: Data Table on North America - Market size and forecast 2024-2029 ($ million)
- Exhibits103: Chart on North America - Year-over-year growth 2024-2029 (%)
- Exhibits104: Data Table on North America - Year-over-year growth 2024-2029 (%)
- Exhibits105: Chart on Europe - Market size and forecast 2024-2029 ($ million)
- Exhibits106: Data Table on Europe - Market size and forecast 2024-2029 ($ million)
- Exhibits107: Chart on Europe - Year-over-year growth 2024-2029 (%)
- Exhibits108: Data Table on Europe - Year-over-year growth 2024-2029 (%)
- Exhibits109: Chart on Middle East and Africa - Market size and forecast 2024-2029 ($ million)
- Exhibits110: Data Table on Middle East and Africa - Market size and forecast 2024-2029 ($ million)
- Exhibits111: Chart on Middle East and Africa - Year-over-year growth 2024-2029 (%)
- Exhibits112: Data Table on Middle East and Africa - Year-over-year growth 2024-2029 (%)
- Exhibits113: Chart on China - Market size and forecast 2024-2029 ($ million)
- Exhibits114: Data Table on China - Market size and forecast 2024-2029 ($ million)
- Exhibits115: Chart on China - Year-over-year growth 2024-2029 (%)
- Exhibits116: Data Table on China - Year-over-year growth 2024-2029 (%)
- Exhibits117: Chart on India - Market size and forecast 2024-2029 ($ million)
- Exhibits118: Data Table on India - Market size and forecast 2024-2029 ($ million)
- Exhibits119: Chart on India - Year-over-year growth 2024-2029 (%)
- Exhibits120: Data Table on India - Year-over-year growth 2024-2029 (%)
- Exhibits121: Chart on Indonesia - Market size and forecast 2024-2029 ($ million)
- Exhibits122: Data Table on Indonesia - Market size and forecast 2024-2029 ($ million)
- Exhibits123: Chart on Indonesia - Year-over-year growth 2024-2029 (%)
- Exhibits124: Data Table on Indonesia - Year-over-year growth 2024-2029 (%)
- Exhibits125: Chart on Japan - Market size and forecast 2024-2029 ($ million)
- Exhibits126: Data Table on Japan - Market size and forecast 2024-2029 ($ million)
- Exhibits127: Chart on Japan - Year-over-year growth 2024-2029 (%)
- Exhibits128: Data Table on Japan - Year-over-year growth 2024-2029 (%)
- Exhibits129: Chart on US - Market size and forecast 2024-2029 ($ million)
- Exhibits130: Data Table on US - Market size and forecast 2024-2029 ($ million)
- Exhibits131: Chart on US - Year-over-year growth 2024-2029 (%)
- Exhibits132: Data Table on US - Year-over-year growth 2024-2029 (%)
- Exhibits133: Chart on Vietnam - Market size and forecast 2024-2029 ($ million)
- Exhibits134: Data Table on Vietnam - Market size and forecast 2024-2029 ($ million)
- Exhibits135: Chart on Vietnam - Year-over-year growth 2024-2029 (%)
- Exhibits136: Data Table on Vietnam - Year-over-year growth 2024-2029 (%)
- Exhibits137: Chart on South Korea - Market size and forecast 2024-2029 ($ million)
- Exhibits138: Data Table on South Korea - Market size and forecast 2024-2029 ($ million)
- Exhibits139: Chart on South Korea - Year-over-year growth 2024-2029 (%)
- Exhibits140: Data Table on South Korea - Year-over-year growth 2024-2029 (%)
- Exhibits141: Chart on Germany - Market size and forecast 2024-2029 ($ million)
- Exhibits142: Data Table on Germany - Market size and forecast 2024-2029 ($ million)
- Exhibits143: Chart on Germany - Year-over-year growth 2024-2029 (%)
- Exhibits144: Data Table on Germany - Year-over-year growth 2024-2029 (%)
- Exhibits145: Chart on Argentina - Market size and forecast 2024-2029 ($ million)
- Exhibits146: Data Table on Argentina - Market size and forecast 2024-2029 ($ million)
- Exhibits147: Chart on Argentina - Year-over-year growth 2024-2029 (%)
- Exhibits148: Data Table on Argentina - Year-over-year growth 2024-2029 (%)
- Exhibits149: Chart on Brazil - Market size and forecast 2024-2029 ($ million)
- Exhibits150: Data Table on Brazil - Market size and forecast 2024-2029 ($ million)
- Exhibits151: Chart on Brazil - Year-over-year growth 2024-2029 (%)
- Exhibits152: Data Table on Brazil - Year-over-year growth 2024-2029 (%)
- Exhibits153: Market opportunity By Geographical Landscape ($ million)
- Exhibits154: Data Tables on Market opportunity By Geographical Landscape ($ million)
- Exhibits155: Impact of drivers and challenges in 2024 and 2029
- Exhibits156: Overview on criticality of inputs and factors of differentiation
- Exhibits157: Overview on factors of disruption
- Exhibits158: Impact of key risks on business
- Exhibits159: Companies covered
- Exhibits160: Company ranking index
- Exhibits161: Matrix on companies position and classification
- Exhibits162: Anhui Bochen Eco Co. - Overview
- Exhibits163: Anhui Bochen Eco Co. - Product / Service
- Exhibits164: Anhui Bochen Eco Co. - Key offerings
- Exhibits165: SWOT
- Exhibits166: Bamboo Bamboo - Overview
- Exhibits167: Bamboo Bamboo - Product / Service
- Exhibits168: Bamboo Bamboo - Key offerings
- Exhibits169: SWOT
- Exhibits170: bambu LLC - Overview
- Exhibits171: bambu LLC - Product / Service
- Exhibits172: bambu LLC - Key offerings
- Exhibits173: SWOT
- Exhibits174: Earths Dreams SRL - Overview
- Exhibits175: Earths Dreams SRL - Product / Service
- Exhibits176: Earths Dreams SRL - Key offerings
- Exhibits177: SWOT
- Exhibits178: Eco-Products Inc. - Overview
- Exhibits179: Eco-Products Inc. - Product / Service
- Exhibits180: Eco-Products Inc. - Key offerings
- Exhibits181: SWOT
- Exhibits182: Get Fresh - Overview
- Exhibits183: Get Fresh - Product / Service
- Exhibits184: Get Fresh - Key offerings
- Exhibits185: SWOT
- Exhibits186: Guadua Bamboo - Overview
- Exhibits187: Guadua Bamboo - Product / Service
- Exhibits188: Guadua Bamboo - Key offerings
- Exhibits189: SWOT
- Exhibits190: Lekoch - Overview
- Exhibits191: Lekoch - Product / Service
- Exhibits192: Lekoch - Key offerings
- Exhibits193: SWOT
- Exhibits194: Mann Bamboo Fiber Ware Co. Ltd - Overview
- Exhibits195: Mann Bamboo Fiber Ware Co. Ltd - Product / Service
- Exhibits196: Mann Bamboo Fiber Ware Co. Ltd - Key offerings
- Exhibits197: SWOT
- Exhibits198: Morgiana - Overview
- Exhibits199: Morgiana - Product / Service
- Exhibits200: Morgiana - Key offerings
- Exhibits201: SWOT
- Exhibits202: Pefso Co. Ltd - Overview
- Exhibits203: Pefso Co. Ltd - Product / Service
- Exhibits204: Pefso Co. Ltd - Key offerings
- Exhibits205: SWOT
- Exhibits206: Red Butler - Overview
- Exhibits207: Red Butler - Product / Service
- Exhibits208: Red Butler - Key offerings
- Exhibits209: SWOT
- Exhibits210: The Mane Lion - Overview
- Exhibits211: The Mane Lion - Product / Service
- Exhibits212: The Mane Lion - Key offerings
- Exhibits213: SWOT
- Exhibits214: Tulipop - Overview
- Exhibits215: Tulipop - Product / Service
- Exhibits216: Tulipop - Key offerings
- Exhibits217: SWOT
- Exhibits218: Xiamen Ebei Import and Export Co. Ltd - Overview
- Exhibits219: Xiamen Ebei Import and Export Co. Ltd - Product / Service
- Exhibits220: Xiamen Ebei Import and Export Co. Ltd - Key offerings
- Exhibits221: SWOT
- Exhibits222: Inclusions checklist
- Exhibits223: Exclusions checklist
- Exhibits224: Currency conversion rates for US$
- Exhibits225: Research methodology
- Exhibits226: Information sources
- Exhibits227: Data validation
- Exhibits228: Validation techniques employed for market sizing
- Exhibits229: Data synthesis
- Exhibits230: 360 degree market analysis
- Exhibits231: List of abbreviations
The bamboo plate market is forecasted to grow by USD 113.8 mn during 2024-2029, accelerating at a CAGR of 4.7% during the forecast period. The report on the bamboo plate market provides a holistic analysis, market size and forecast, trends, growth drivers, and challenges, as well as vendor analysis covering around 25 vendors.
The report offers an up-to-date analysis regarding the current market scenario, the latest trends and drivers, and the overall market environment. The market is driven by increase in adoption of bamboo plates for online food catering, companies are focusing on sustainable bamboo plates, and government regulations.
| Market Scope | |
|---|---|
| Base Year | 2025 |
| End Year | 2029 |
| Series Year | 2025-2029 |
| Growth Momentum | Accelerate |
| YOY 2025 | 4.5% |
| CAGR | 4.7% |
| Incremental Value | $113.8 mn |
The study was conducted using an objective combination of primary and secondary information including inputs from key participants in the industry. The report contains a comprehensive market size data, segment with regional analysis and vendor landscape in addition to an analysis of the key companies. Reports have historic and forecast data.
Technavio's bamboo plate market is segmented as below:
By Product
- Disposable
- Reusable
By End-user
- Households
- Restaurants and cafes
- Catering services
- Institutional buyers
By Distribution Channel
- Offline
- Online
By Geographical Landscape
- APAC
- South America
- North America
- Europe
- Middle East and Africa
This study identifies the growing prominence of online shopping as one of the prime reasons driving the bamboo plate market growth during the next few years. Also, rising health awareness among consumers and recent development in bamboo plates will lead to sizable demand in the market.
The report on the bamboo plate market covers the following areas:
- Bamboo Plate Market sizing
- Bamboo Plate Market forecast
- Bamboo Plate Market industry analysis
The robust vendor analysis is designed to help clients improve their market position, and in line with this, this report provides a detailed analysis of several leading bamboo plate market vendors that include Anhui Bochen Eco Co., Audenza Ltd., Bamboo Bamboo, bambu LLC, Brand Stock Box Ltd, Earths Dreams SRL, Eatwell UK, Eco-Products Inc., Get Fresh, Guadua Bamboo, Lekoch, Little Cherry, Mann Bamboo Fiber Ware Co. Ltd, Morgiana, PacknWood, Pefso Co. Ltd, Red Butler, The Mane Lion, Tulipop, and Xiamen Ebei Import and Export Co. Ltd. Also, the bamboo plate market analysis report includes information on upcoming trends and challenges that will influence market growth. This is to help companies strategize and leverage all forthcoming growth opportunities.
The publisher presents a detailed picture of the market by the way of study, synthesis, and summation of data from multiple sources by an analysis of key parameters such as profit, pricing, competition, and promotions. It presents various market facets by identifying the key industry influencers. The data presented is comprehensive, reliable, and a result of extensive primary and secondary research. The market research reports provide a complete competitive landscape and an in-depth vendor selection methodology and analysis using qualitative and quantitative research to forecast accurate market growth.
Table of Contents
1 Executive Summary
- 1.1 Market overview
- Executive Summary - Chart on Market Overview
- Executive Summary - Data Table on Market Overview
- Executive Summary - Chart on Global Market Characteristics
- Executive Summary - Chart on Market By Geographical Landscape
- Executive Summary - Chart on Market Segmentation by Product
- Executive Summary - Chart on Market Segmentation by End-user
- Executive Summary - Chart on Market Segmentation by Distribution Channel
- Executive Summary - Chart on Incremental Growth
- Executive Summary - Data Table on Incremental Growth
- Executive Summary - Chart on Company Market Positioning
2 Technavio Analysis
- 2.1 Analysis of price sensitivity, lifecycle, customer purchase basket, adoption rates, and purchase criteria
- Analysis of price sensitivity, lifecycle, customer purchase basket, adoption rates, and purchase criteria
- 2.2 Criticality of inputs and Factors of differentiation
- Overview on criticality of inputs and factors of differentiation
- 2.3 Factors of disruption
- Overview on factors of disruption
- 2.4 Impact of drivers and challenges
- Impact of drivers and challenges in 2024 and 2029
3 Market Landscape
- 3.1 Market ecosystem
- Parent Market
- Data Table on - Parent Market
- 3.2 Market characteristics
- Market characteristics analysis
- 3.3 Value chain analysis
- Value chain analysis
4 Market Sizing
- 4.1 Market definition
- Offerings of companies included in the market definition
- 4.2 Market segment analysis
- Market segments
- 4.3 Market size 2024
- 4.4 Market outlook: Forecast for 2024-2029
- Chart on Global - Market size and forecast 2024-2029 ($ million)
- Data Table on Global - Market size and forecast 2024-2029 ($ million)
- Chart on Global Market: Year-over-year growth 2024-2029 (%)
- Data Table on Global Market: Year-over-year growth 2024-2029 (%)
5 Historic Market Size
- 5.1 Global Bamboo Plate Market 2019 - 2023
- Historic Market Size - Data Table on Global Bamboo Plate Market 2019 - 2023 ($ million)
- 5.2 Product segment analysis 2019 - 2023
- Historic Market Size - Product Segment 2019 - 2023 ($ million)
- 5.3 End-user segment analysis 2019 - 2023
- Historic Market Size - End-user Segment 2019 - 2023 ($ million)
- 5.4 Distribution Channel segment analysis 2019 - 2023
- Historic Market Size - Distribution Channel Segment 2019 - 2023 ($ million)
- 5.5 Geography segment analysis 2019 - 2023
- Historic Market Size - Geography Segment 2019 - 2023 ($ million)
- 5.6 Country segment analysis 2019 - 2023
- Historic Market Size - Country Segment 2019 - 2023 ($ million)
6 Qualitative Analysis
- 6.1 The impact of AI in the global bamboo plate market
7 Five Forces Analysis
- 7.1 Five forces summary
- Five forces analysis - Comparison between 2024 and 2029
- 7.2 Bargaining power of buyers
- Bargaining power of buyers - Impact of key factors 2024 and 2029
- 7.3 Bargaining power of suppliers
- Bargaining power of suppliers - Impact of key factors in 2024 and 2029
- 7.4 Threat of new entrants
- Threat of new entrants - Impact of key factors in 2024 and 2029
- 7.5 Threat of substitutes
- Threat of substitutes - Impact of key factors in 2024 and 2029
- 7.6 Threat of rivalry
- Threat of rivalry - Impact of key factors in 2024 and 2029
- 7.7 Market condition
- Chart on Market condition - Five forces 2024 and 2029
8 Market Segmentation by Product
- 8.1 Market segments
- Chart on Product - Market share 2024-2029 (%)
- Data Table on Product - Market share 2024-2029 (%)
- 8.2 Comparison by Product
- Chart on Comparison by Product
- Data Table on Comparison by Product
- 8.3 Disposable - Market size and forecast 2024-2029
- Chart on Disposable - Market size and forecast 2024-2029 ($ million)
- Data Table on Disposable - Market size and forecast 2024-2029 ($ million)
- Chart on Disposable - Year-over-year growth 2024-2029 (%)
- Data Table on Disposable - Year-over-year growth 2024-2029 (%)
- 8.4 Reusable - Market size and forecast 2024-2029
- Chart on Reusable - Market size and forecast 2024-2029 ($ million)
- Data Table on Reusable - Market size and forecast 2024-2029 ($ million)
- Chart on Reusable - Year-over-year growth 2024-2029 (%)
- Data Table on Reusable - Year-over-year growth 2024-2029 (%)
- 8.5 Market opportunity by Product
- Market opportunity by Product ($ million)
- Data Table on Market opportunity by Product ($ million)
9 Market Segmentation by End-user
- 9.1 Market segments
- Chart on End-user - Market share 2024-2029 (%)
- Data Table on End-user - Market share 2024-2029 (%)
- 9.2 Comparison by End-user
- Chart on Comparison by End-user
- Data Table on Comparison by End-user
- 9.3 Households - Market size and forecast 2024-2029
- Chart on Households - Market size and forecast 2024-2029 ($ million)
- Data Table on Households - Market size and forecast 2024-2029 ($ million)
- Chart on Households - Year-over-year growth 2024-2029 (%)
- Data Table on Households - Year-over-year growth 2024-2029 (%)
- 9.4 Restaurants and cafes - Market size and forecast 2024-2029
- Chart on Restaurants and cafes - Market size and forecast 2024-2029 ($ million)
- Data Table on Restaurants and cafes - Market size and forecast 2024-2029 ($ million)
- Chart on Restaurants and cafes - Year-over-year growth 2024-2029 (%)
- Data Table on Restaurants and cafes - Year-over-year growth 2024-2029 (%)
- 9.5 Catering services - Market size and forecast 2024-2029
- Chart on Catering services - Market size and forecast 2024-2029 ($ million)
- Data Table on Catering services - Market size and forecast 2024-2029 ($ million)
- Chart on Catering services - Year-over-year growth 2024-2029 (%)
- Data Table on Catering services - Year-over-year growth 2024-2029 (%)
- 9.6 Institutional buyers - Market size and forecast 2024-2029
- Chart on Institutional buyers - Market size and forecast 2024-2029 ($ million)
- Data Table on Institutional buyers - Market size and forecast 2024-2029 ($ million)
- Chart on Institutional buyers - Year-over-year growth 2024-2029 (%)
- Data Table on Institutional buyers - Year-over-year growth 2024-2029 (%)
- 9.7 Market opportunity by End-user
- Market opportunity by End-user ($ million)
- Data Table on Market opportunity by End-user ($ million)
10 Market Segmentation by Distribution Channel
- 10.1 Market segments
- Chart on Distribution Channel - Market share 2024-2029 (%)
- Data Table on Distribution Channel - Market share 2024-2029 (%)
- 10.2 Comparison by Distribution Channel
- Chart on Comparison by Distribution Channel
- Data Table on Comparison by Distribution Channel
- 10.3 Offline - Market size and forecast 2024-2029
- Chart on Offline - Market size and forecast 2024-2029 ($ million)
- Data Table on Offline - Market size and forecast 2024-2029 ($ million)
- Chart on Offline - Year-over-year growth 2024-2029 (%)
- Data Table on Offline - Year-over-year growth 2024-2029 (%)
- 10.4 Online - Market size and forecast 2024-2029
- Chart on Online - Market size and forecast 2024-2029 ($ million)
- Data Table on Online - Market size and forecast 2024-2029 ($ million)
- Chart on Online - Year-over-year growth 2024-2029 (%)
- Data Table on Online - Year-over-year growth 2024-2029 (%)
- 10.5 Market opportunity by Distribution Channel
- Market opportunity by Distribution Channel ($ million)
- Data Table on Market opportunity by Distribution Channel ($ million)
11 Customer Landscape
- 11.1 Customer landscape overview
- Analysis of price sensitivity, lifecycle, customer purchase basket, adoption rates, and purchase criteria
12 Geographic Landscape
- 12.1 Geographic segmentation
- Chart on Market share By Geographical Landscape 2024-2029 (%)
- Data Table on Market share By Geographical Landscape 2024-2029 (%)
- 12.2 Geographic comparison
- Chart on Geographic comparison
- Data Table on Geographic comparison
- 12.3 APAC - Market size and forecast 2024-2029
- Chart on APAC - Market size and forecast 2024-2029 ($ million)
- Data Table on APAC - Market size and forecast 2024-2029 ($ million)
- Chart on APAC - Year-over-year growth 2024-2029 (%)
- Data Table on APAC - Year-over-year growth 2024-2029 (%)
- 12.4 South America - Market size and forecast 2024-2029
- Chart on South America - Market size and forecast 2024-2029 ($ million)
- Data Table on South America - Market size and forecast 2024-2029 ($ million)
- Chart on South America - Year-over-year growth 2024-2029 (%)
- Data Table on South America - Year-over-year growth 2024-2029 (%)
- 12.5 North America - Market size and forecast 2024-2029
- Chart on North America - Market size and forecast 2024-2029 ($ million)
- Data Table on North America - Market size and forecast 2024-2029 ($ million)
- Chart on North America - Year-over-year growth 2024-2029 (%)
- Data Table on North America - Year-over-year growth 2024-2029 (%)
- 12.6 Europe - Market size and forecast 2024-2029
- Chart on Europe - Market size and forecast 2024-2029 ($ million)
- Data Table on Europe - Market size and forecast 2024-2029 ($ million)
- Chart on Europe - Year-over-year growth 2024-2029 (%)
- Data Table on Europe - Year-over-year growth 2024-2029 (%)
- 12.7 Middle East and Africa - Market size and forecast 2024-2029
- Chart on Middle East and Africa - Market size and forecast 2024-2029 ($ million)
- Data Table on Middle East and Africa - Market size and forecast 2024-2029 ($ million)
- Chart on Middle East and Africa - Year-over-year growth 2024-2029 (%)
- Data Table on Middle East and Africa - Year-over-year growth 2024-2029 (%)
- 12.8 China - Market size and forecast 2024-2029
- Chart on China - Market size and forecast 2024-2029 ($ million)
- Data Table on China - Market size and forecast 2024-2029 ($ million)
- Chart on China - Year-over-year growth 2024-2029 (%)
- Data Table on China - Year-over-year growth 2024-2029 (%)
- 12.9 India - Market size and forecast 2024-2029
- Chart on India - Market size and forecast 2024-2029 ($ million)
- Data Table on India - Market size and forecast 2024-2029 ($ million)
- Chart on India - Year-over-year growth 2024-2029 (%)
- Data Table on India - Year-over-year growth 2024-2029 (%)
- 12.10 Indonesia - Market size and forecast 2024-2029
- Chart on Indonesia - Market size and forecast 2024-2029 ($ million)
- Data Table on Indonesia - Market size and forecast 2024-2029 ($ million)
- Chart on Indonesia - Year-over-year growth 2024-2029 (%)
- Data Table on Indonesia - Year-over-year growth 2024-2029 (%)
- 12.11 Japan - Market size and forecast 2024-2029
- Chart on Japan - Market size and forecast 2024-2029 ($ million)
- Data Table on Japan - Market size and forecast 2024-2029 ($ million)
- Chart on Japan - Year-over-year growth 2024-2029 (%)
- Data Table on Japan - Year-over-year growth 2024-2029 (%)
- 12.12 US - Market size and forecast 2024-2029
- Chart on US - Market size and forecast 2024-2029 ($ million)
- Data Table on US - Market size and forecast 2024-2029 ($ million)
- Chart on US - Year-over-year growth 2024-2029 (%)
- Data Table on US - Year-over-year growth 2024-2029 (%)
- 12.13 Vietnam - Market size and forecast 2024-2029
- Chart on Vietnam - Market size and forecast 2024-2029 ($ million)
- Data Table on Vietnam - Market size and forecast 2024-2029 ($ million)
- Chart on Vietnam - Year-over-year growth 2024-2029 (%)
- Data Table on Vietnam - Year-over-year growth 2024-2029 (%)
- 12.14 South Korea - Market size and forecast 2024-2029
- Chart on South Korea - Market size and forecast 2024-2029 ($ million)
- Data Table on South Korea - Market size and forecast 2024-2029 ($ million)
- Chart on South Korea - Year-over-year growth 2024-2029 (%)
- Data Table on South Korea - Year-over-year growth 2024-2029 (%)
- 12.15 Germany - Market size and forecast 2024-2029
- Chart on Germany - Market size and forecast 2024-2029 ($ million)
- Data Table on Germany - Market size and forecast 2024-2029 ($ million)
- Chart on Germany - Year-over-year growth 2024-2029 (%)
- Data Table on Germany - Year-over-year growth 2024-2029 (%)
- 12.16 Argentina - Market size and forecast 2024-2029
- Chart on Argentina - Market size and forecast 2024-2029 ($ million)
- Data Table on Argentina - Market size and forecast 2024-2029 ($ million)
- Chart on Argentina - Year-over-year growth 2024-2029 (%)
- Data Table on Argentina - Year-over-year growth 2024-2029 (%)
- 12.17 Brazil - Market size and forecast 2024-2029
- Chart on Brazil - Market size and forecast 2024-2029 ($ million)
- Data Table on Brazil - Market size and forecast 2024-2029 ($ million)
- Chart on Brazil - Year-over-year growth 2024-2029 (%)
- Data Table on Brazil - Year-over-year growth 2024-2029 (%)
- 12.18 Market opportunity By Geographical Landscape
- Market opportunity By Geographical Landscape ($ million)
- Data Tables on Market opportunity By Geographical Landscape ($ million)
13 Drivers, Challenges, and Opportunity/Restraints
- 13.1 Market drivers
- 13.2 Market challenges
- 13.3 Impact of drivers and challenges
- Impact of drivers and challenges in 2024 and 2029
- 13.4 Market opportunities/restraints
14 Competitive Landscape
- 14.1 Overview
- 14.2 Competitive Landscape
- Overview on criticality of inputs and factors of differentiation
- 14.3 Landscape disruption
- Overview on factors of disruption
- 14.4 Industry risks
- Impact of key risks on business
15 Competitive Analysis
- 15.1 Companies profiled
- Companies covered
- 15.2 Company ranking index
- Company ranking index
- 15.3 Market positioning of companies
- Matrix on companies position and classification
- 15.4 Anhui Bochen Eco Co.
- Anhui Bochen Eco Co. - Overview
- Anhui Bochen Eco Co. - Product / Service
- Anhui Bochen Eco Co. - Key offerings
- SWOT
- 15.5 Bamboo Bamboo
- Bamboo Bamboo - Overview
- Bamboo Bamboo - Product / Service
- Bamboo Bamboo - Key offerings
- SWOT
- 15.6 bambu LLC
- bambu LLC - Overview
- bambu LLC - Product / Service
- bambu LLC - Key offerings
- SWOT
- 15.7 Earths Dreams SRL
- Earths Dreams SRL - Overview
- Earths Dreams SRL - Product / Service
- Earths Dreams SRL - Key offerings
- SWOT
- 15.8 Eco-Products Inc.
- Eco-Products Inc. - Overview
- Eco-Products Inc. - Product / Service
- Eco-Products Inc. - Key offerings
- SWOT
- 15.9 Get Fresh
- Get Fresh - Overview
- Get Fresh - Product / Service
- Get Fresh - Key offerings
- SWOT
- 15.10 Guadua Bamboo
- Guadua Bamboo - Overview
- Guadua Bamboo - Product / Service
- Guadua Bamboo - Key offerings
- SWOT
- 15.11 Lekoch
- Lekoch - Overview
- Lekoch - Product / Service
- Lekoch - Key offerings
- SWOT
- 15.12 Mann Bamboo Fiber Ware Co. Ltd
- Mann Bamboo Fiber Ware Co. Ltd - Overview
- Mann Bamboo Fiber Ware Co. Ltd - Product / Service
- Mann Bamboo Fiber Ware Co. Ltd - Key offerings
- SWOT
- 15.13 Morgiana
- Morgiana - Overview
- Morgiana - Product / Service
- Morgiana - Key offerings
- SWOT
- 15.14 Pefso Co. Ltd
- Pefso Co. Ltd - Overview
- Pefso Co. Ltd - Product / Service
- Pefso Co. Ltd - Key offerings
- SWOT
- 15.15 Red Butler
- Red Butler - Overview
- Red Butler - Product / Service
- Red Butler - Key offerings
- SWOT
- 15.16 The Mane Lion
- The Mane Lion - Overview
- The Mane Lion - Product / Service
- The Mane Lion - Key offerings
- SWOT
- 15.17 Tulipop
- Tulipop - Overview
- Tulipop - Product / Service
- Tulipop - Key offerings
- SWOT
- 15.18 Xiamen Ebei Import and Export Co. Ltd
- Xiamen Ebei Import and Export Co. Ltd - Overview
- Xiamen Ebei Import and Export Co. Ltd - Product / Service
- Xiamen Ebei Import and Export Co. Ltd - Key offerings
- SWOT
16 Appendix
- 16.1 Scope of the report
- 16.2 Inclusions and exclusions checklist
- Inclusions checklist
- Exclusions checklist
- 16.3 Currency conversion rates for US$
- Currency conversion rates for US$
- 16.4 Research methodology
- Research methodology
- 16.5 Data procurement
- Information sources
- 16.6 Data validation
- Data validation
- 16.7 Validation techniques employed for market sizing
- Validation techniques employed for market sizing
- 16.8 Data synthesis
- Data synthesis
- 16.9 360 degree market analysis
- 360 degree market analysis
- 16.10 List of abbreviations
- List of abbreviations
