|
|
市場調査レポート
商品コード
1748536
スチールの世界市場(2025年~2029年)Global Steel Market 2025-2029 |
||||||

|
|||||||
カスタマイズ可能
|
|||||||

| スチールの世界市場(2025年~2029年) |
|
出版日: 2025年06月07日
発行: TechNavio
ページ情報: 英文 252 Pages
納期: 即納可能
|

全表示
- 概要
- 図表
- 目次
世界のスチールの市場規模は、2024年~2029年に3,074億米ドルに成長し、予測期間中のCAGRは4.5%になると予測されます。
当レポートでは、スチール市場の全体的な分析、市場規模・予測、動向、成長促進要因、課題、約25のベンダーを網羅したベンダー分析などを掲載しています。
当レポートは、現在の市場シナリオ、最新動向と促進要因、市場環境全体に関する最新分析を提供しています。市場は、都市化とインフラ開発、新興経済諸国における工業化、自動車産業の成長によって牽引されています。
| 市場範囲 | |
|---|---|
| 基準年 | 2025年 |
| 終了年 | 2029年 |
| 予測期間 | 2025年~2029年 |
| 成長モメンタム | 加速 |
| 前年比 | 4.3% |
| CAGR | 4.5% |
| 増分額 | 3,074億米ドル |
本調査は、業界の主要参加者からのインプットを含め、一次情報と二次情報を客観的に組み合わせて実施しました。本レポートには、主要企業の分析に加え、包括的な市場規模データ、地域分析によるセグメント、ベンダー情勢が含まれています。レポートには過去データと予測データがあります。
本調査では、持続可能な生産へのシフトが今後数年間のスチール市場の成長を促進する主要な理由の1つであると特定しています。また、積層造形への注力やM&Aの増加も、市場の大きな需要につながると思われます。
目次
第1章 エグゼクティブサマリー
- 市場概要
第2章 Technavioの分析
- 価格感度・ライフサイクル・顧客購入バスケット・採用率・購入基準の分析
- インプットの重要性と差別化の要因
- ディスラプションの要因
- 促進要因と課題の影響
第3章 市場情勢
- 市場エコシステム
- 市場の特徴
- バリューチェーン分析
第4章 市場規模
- 市場の定義
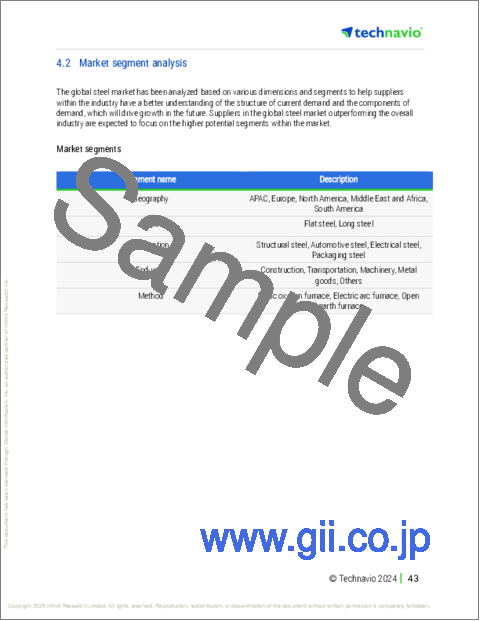
- 市場セグメント分析
- 市場規模(2024年)
- 市場の見通し(2024年~2029年)
第5章 市場規模実績
- 世界のスチール市場(2019年~2023年)
- タイプセグメント分析(2019年~2023年)
- 用途セグメント分析(2019年~2023年)
- エンドユーザーセグメント分析(2019年~2023年)
- 方法セグメント分析(2019年~2023年)
- 地域セグメント分析(2019年~2023年)
- 国セグメント分析(2019年~2023年)
第6章 定性分析
- 米国関税の影響分析:世界のスチール市場
第7章 ファイブフォース分析
- ファイブフォースの要約
- 買い手の交渉力
- 供給企業の交渉力
- 新規参入業者の脅威
- 代替品の脅威
- 競争の脅威
- 市況
第8章 市場セグメンテーション:タイプ別
- 市場セグメント
- 比較:タイプ別
- フラットスチール:市場規模と予測(2024年~2029年)
- ロングスチール:市場規模と予測(2024年~2029年)
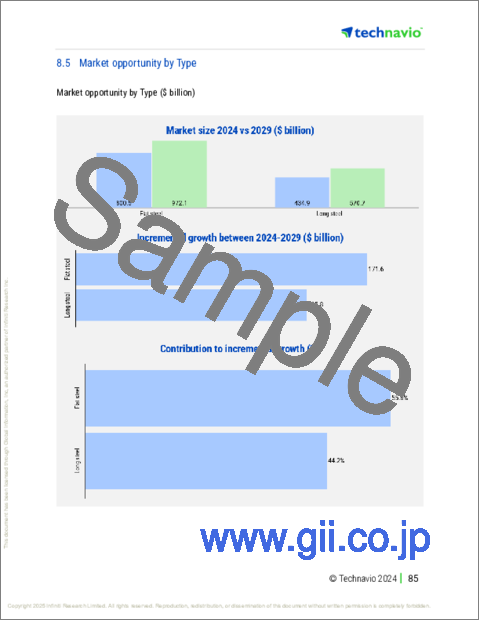
- 市場機会:タイプ別
第9章 市場セグメンテーション:用途別
- 市場セグメント
- 比較:用途別
- 構造用スチール:市場規模と予測(2024年~2029年)
- 自動車用スチール:市場規模と予測(2024年~2029年)
- 電気用スチール:市場規模と予測(2024年~2029年)
- 包装用スチール:市場規模と予測(2024年~2029年)
- 市場機会:用途別
第10章 市場セグメンテーション:エンドユーザー別
- 市場セグメント
- 比較:エンドユーザー別
- 建設:市場規模と予測(2024年~2029年)
- 輸送:市場規模と予測(2024年~2029年)
- 機械:市場規模と予測(2024年~2029年)
- 金属製品:市場規模と予測(2024年~2029年)
- その他:市場規模と予測(2024年~2029年)
- 市場機会:エンドユーザー別
第11章 市場セグメンテーション:方法別
- 市場セグメント
- 比較:方法別
- 塩基性酸素炉:市場規模と予測(2024年~2029年)
- 電気アーク炉:市場規模と予測(2024年~2029年)
- 平炉:市場規模と予測(2024年~2029年)
- 市場機会:方法別
第12章 顧客情勢
- 顧客情勢の概要
第13章 地域別情勢
- 地域別セグメンテーション
- 地域別比較
- アジア太平洋:市場規模と予測(2024年~2029年)
- 欧州:市場規模と予測(2024年~2029年)
- 北米:市場規模と予測(2024年~2029年)
- 中東・アフリカ:市場規模と予測(2024年~2029年)
- 南米:市場規模と予測(2024年~2029年)
- 中国:市場規模と予測(2024年~2029年)
- インド:市場規模と予測(2024年~2029年)
- 米国:市場規模と予測(2024年~2029年)
- 日本:市場規模と予測(2024年~2029年)
- 韓国:市場規模と予測(2024年~2029年)
- ロシア:市場規模と予測(2024年~2029年)
- トルコ:市場規模と予測(2024年~2029年)
- ドイツ:市場規模と予測(2024年~2029年)
- メキシコ:市場規模と予測(2024年~2029年)
- イタリア:市場規模と予測(2024年~2029年)
- 市場機会:地域情勢別
第14章 促進要因・課題・機会・抑制要因
- 市場促進要因
- 市場の課題
- 促進要因と課題の影響
- 市場の機会・抑制要因
第15章 競合情勢
- 概要
- 競合情勢
- ディスラプションの状況
- 業界のリスク
第16章 競合分析
- 企業プロファイル
- 企業ランキング指数
- 企業の市場ポジショニング
- Ansteel Group Corp. Ltd.
- ArcelorMittal SA
- Baosteel Group Corp.
- Beijing Shougang Co. Ltd.
- Gerdau SA
- HBIS Group Co. Ltd.
- JFE Holdings Inc.
- JSW Steel
- Nippon Steel Corp.
- Nucor Corp.
- PAO Severstal
- POSCO holdings Inc.
- Shagang Group Inc.
- Steel Dynamics Inc
- Tata Steel Ltd.
第17章 付録
Exhibits:
- Exhibits1: Executive Summary - Chart on Market Overview
- Exhibits2: Executive Summary - Data Table on Market Overview
- Exhibits3: Executive Summary - Chart on Global Market Characteristics
- Exhibits4: Executive Summary - Chart on Market By Geographical Landscape
- Exhibits5: Executive Summary - Chart on Market Segmentation by Type
- Exhibits6: Executive Summary - Chart on Market Segmentation by Application
- Exhibits7: Executive Summary - Chart on Market Segmentation by End-user
- Exhibits8: Executive Summary - Chart on Market Segmentation by Method
- Exhibits9: Executive Summary - Chart on Incremental Growth
- Exhibits10: Executive Summary - Data Table on Incremental Growth
- Exhibits11: Executive Summary - Chart on Company Market Positioning
- Exhibits12: Analysis of price sensitivity, lifecycle, customer purchase basket, adoption rates, and purchase criteria
- Exhibits13: Overview on criticality of inputs and factors of differentiation
- Exhibits14: Overview on factors of disruption
- Exhibits15: Impact of drivers and challenges in 2024 and 2029
- Exhibits16: Parent Market
- Exhibits17: Data Table on - Parent Market
- Exhibits18: Market characteristics analysis
- Exhibits19: Value chain analysis
- Exhibits20: Offerings of companies included in the market definition
- Exhibits21: Market segments
- Exhibits22: Chart on Global - Market size and forecast 2024-2029 ($ billion)
- Exhibits23: Data Table on Global - Market size and forecast 2024-2029 ($ billion)
- Exhibits24: Chart on Global Market: Year-over-year growth 2024-2029 (%)
- Exhibits25: Data Table on Global Market: Year-over-year growth 2024-2029 (%)
- Exhibits26: Historic Market Size - Data Table on Global Steel Market 2019 - 2023 ($ billion)
- Exhibits27: Historic Market Size - Type Segment 2019 - 2023 ($ billion)
- Exhibits28: Historic Market Size - Application Segment 2019 - 2023 ($ billion)
- Exhibits29: Historic Market Size - End-user Segment 2019 - 2023 ($ billion)
- Exhibits30: Historic Market Size - Method Segment 2019 - 2023 ($ billion)
- Exhibits31: Historic Market Size - Geography Segment 2019 - 2023 ($ billion)
- Exhibits32: Historic Market Size - Country Segment 2019 - 2023 ($ billion)
- Exhibits33: Five forces analysis - Comparison between 2024 and 2029
- Exhibits34: Bargaining power of buyers - Impact of key factors 2024 and 2029
- Exhibits35: Bargaining power of suppliers - Impact of key factors in 2024 and 2029
- Exhibits36: Threat of new entrants - Impact of key factors in 2024 and 2029
- Exhibits37: Threat of substitutes - Impact of key factors in 2024 and 2029
- Exhibits38: Threat of rivalry - Impact of key factors in 2024 and 2029
- Exhibits39: Chart on Market condition - Five forces 2024 and 2029
- Exhibits40: Chart on Type - Market share 2024-2029 (%)
- Exhibits41: Data Table on Type - Market share 2024-2029 (%)
- Exhibits42: Chart on Comparison by Type
- Exhibits43: Data Table on Comparison by Type
- Exhibits44: Chart on Flat steel - Market size and forecast 2024-2029 ($ billion)
- Exhibits45: Data Table on Flat steel - Market size and forecast 2024-2029 ($ billion)
- Exhibits46: Chart on Flat steel - Year-over-year growth 2024-2029 (%)
- Exhibits47: Data Table on Flat steel - Year-over-year growth 2024-2029 (%)
- Exhibits48: Chart on Long steel - Market size and forecast 2024-2029 ($ billion)
- Exhibits49: Data Table on Long steel - Market size and forecast 2024-2029 ($ billion)
- Exhibits50: Chart on Long steel - Year-over-year growth 2024-2029 (%)
- Exhibits51: Data Table on Long steel - Year-over-year growth 2024-2029 (%)
- Exhibits52: Market opportunity by Type ($ billion)
- Exhibits53: Data Table on Market opportunity by Type ($ billion)
- Exhibits54: Chart on Application - Market share 2024-2029 (%)
- Exhibits55: Data Table on Application - Market share 2024-2029 (%)
- Exhibits56: Chart on Comparison by Application
- Exhibits57: Data Table on Comparison by Application
- Exhibits58: Chart on Structural steel - Market size and forecast 2024-2029 ($ billion)
- Exhibits59: Data Table on Structural steel - Market size and forecast 2024-2029 ($ billion)
- Exhibits60: Chart on Structural steel - Year-over-year growth 2024-2029 (%)
- Exhibits61: Data Table on Structural steel - Year-over-year growth 2024-2029 (%)
- Exhibits62: Chart on Automotive steel - Market size and forecast 2024-2029 ($ billion)
- Exhibits63: Data Table on Automotive steel - Market size and forecast 2024-2029 ($ billion)
- Exhibits64: Chart on Automotive steel - Year-over-year growth 2024-2029 (%)
- Exhibits65: Data Table on Automotive steel - Year-over-year growth 2024-2029 (%)
- Exhibits66: Chart on Electrical steel - Market size and forecast 2024-2029 ($ billion)
- Exhibits67: Data Table on Electrical steel - Market size and forecast 2024-2029 ($ billion)
- Exhibits68: Chart on Electrical steel - Year-over-year growth 2024-2029 (%)
- Exhibits69: Data Table on Electrical steel - Year-over-year growth 2024-2029 (%)
- Exhibits70: Chart on Packaging steel - Market size and forecast 2024-2029 ($ billion)
- Exhibits71: Data Table on Packaging steel - Market size and forecast 2024-2029 ($ billion)
- Exhibits72: Chart on Packaging steel - Year-over-year growth 2024-2029 (%)
- Exhibits73: Data Table on Packaging steel - Year-over-year growth 2024-2029 (%)
- Exhibits74: Market opportunity by Application ($ billion)
- Exhibits75: Data Table on Market opportunity by Application ($ billion)
- Exhibits76: Chart on End-user - Market share 2024-2029 (%)
- Exhibits77: Data Table on End-user - Market share 2024-2029 (%)
- Exhibits78: Chart on Comparison by End-user
- Exhibits79: Data Table on Comparison by End-user
- Exhibits80: Chart on Construction - Market size and forecast 2024-2029 ($ billion)
- Exhibits81: Data Table on Construction - Market size and forecast 2024-2029 ($ billion)
- Exhibits82: Chart on Construction - Year-over-year growth 2024-2029 (%)
- Exhibits83: Data Table on Construction - Year-over-year growth 2024-2029 (%)
- Exhibits84: Chart on Transportation - Market size and forecast 2024-2029 ($ billion)
- Exhibits85: Data Table on Transportation - Market size and forecast 2024-2029 ($ billion)
- Exhibits86: Chart on Transportation - Year-over-year growth 2024-2029 (%)
- Exhibits87: Data Table on Transportation - Year-over-year growth 2024-2029 (%)
- Exhibits88: Chart on Machinery - Market size and forecast 2024-2029 ($ billion)
- Exhibits89: Data Table on Machinery - Market size and forecast 2024-2029 ($ billion)
- Exhibits90: Chart on Machinery - Year-over-year growth 2024-2029 (%)
- Exhibits91: Data Table on Machinery - Year-over-year growth 2024-2029 (%)
- Exhibits92: Chart on Metal goods - Market size and forecast 2024-2029 ($ billion)
- Exhibits93: Data Table on Metal goods - Market size and forecast 2024-2029 ($ billion)
- Exhibits94: Chart on Metal goods - Year-over-year growth 2024-2029 (%)
- Exhibits95: Data Table on Metal goods - Year-over-year growth 2024-2029 (%)
- Exhibits96: Chart on Others - Market size and forecast 2024-2029 ($ billion)
- Exhibits97: Data Table on Others - Market size and forecast 2024-2029 ($ billion)
- Exhibits98: Chart on Others - Year-over-year growth 2024-2029 (%)
- Exhibits99: Data Table on Others - Year-over-year growth 2024-2029 (%)
- Exhibits100: Market opportunity by End-user ($ billion)
- Exhibits101: Data Table on Market opportunity by End-user ($ billion)
- Exhibits102: Chart on Method - Market share 2024-2029 (%)
- Exhibits103: Data Table on Method - Market share 2024-2029 (%)
- Exhibits104: Chart on Comparison by Method
- Exhibits105: Data Table on Comparison by Method
- Exhibits106: Chart on Basic oxygen furnace - Market size and forecast 2024-2029 ($ billion)
- Exhibits107: Data Table on Basic oxygen furnace - Market size and forecast 2024-2029 ($ billion)
- Exhibits108: Chart on Basic oxygen furnace - Year-over-year growth 2024-2029 (%)
- Exhibits109: Data Table on Basic oxygen furnace - Year-over-year growth 2024-2029 (%)
- Exhibits110: Chart on Electric arc furnace - Market size and forecast 2024-2029 ($ billion)
- Exhibits111: Data Table on Electric arc furnace - Market size and forecast 2024-2029 ($ billion)
- Exhibits112: Chart on Electric arc furnace - Year-over-year growth 2024-2029 (%)
- Exhibits113: Data Table on Electric arc furnace - Year-over-year growth 2024-2029 (%)
- Exhibits114: Chart on Open hearth furnace - Market size and forecast 2024-2029 ($ billion)
- Exhibits115: Data Table on Open hearth furnace - Market size and forecast 2024-2029 ($ billion)
- Exhibits116: Chart on Open hearth furnace - Year-over-year growth 2024-2029 (%)
- Exhibits117: Data Table on Open hearth furnace - Year-over-year growth 2024-2029 (%)
- Exhibits118: Market opportunity by Method ($ billion)
- Exhibits119: Data Table on Market opportunity by Method ($ billion)
- Exhibits120: Analysis of price sensitivity, lifecycle, customer purchase basket, adoption rates, and purchase criteria
- Exhibits121: Chart on Market share By Geographical Landscape 2024-2029 (%)
- Exhibits122: Data Table on Market share By Geographical Landscape 2024-2029 (%)
- Exhibits123: Chart on Geographic comparison
- Exhibits124: Data Table on Geographic comparison
- Exhibits125: Chart on APAC - Market size and forecast 2024-2029 ($ billion)
- Exhibits126: Data Table on APAC - Market size and forecast 2024-2029 ($ billion)
- Exhibits127: Chart on APAC - Year-over-year growth 2024-2029 (%)
- Exhibits128: Data Table on APAC - Year-over-year growth 2024-2029 (%)
- Exhibits129: Chart on Europe - Market size and forecast 2024-2029 ($ billion)
- Exhibits130: Data Table on Europe - Market size and forecast 2024-2029 ($ billion)
- Exhibits131: Chart on Europe - Year-over-year growth 2024-2029 (%)
- Exhibits132: Data Table on Europe - Year-over-year growth 2024-2029 (%)
- Exhibits133: Chart on North America - Market size and forecast 2024-2029 ($ billion)
- Exhibits134: Data Table on North America - Market size and forecast 2024-2029 ($ billion)
- Exhibits135: Chart on North America - Year-over-year growth 2024-2029 (%)
- Exhibits136: Data Table on North America - Year-over-year growth 2024-2029 (%)
- Exhibits137: Chart on Middle East and Africa - Market size and forecast 2024-2029 ($ billion)
- Exhibits138: Data Table on Middle East and Africa - Market size and forecast 2024-2029 ($ billion)
- Exhibits139: Chart on Middle East and Africa - Year-over-year growth 2024-2029 (%)
- Exhibits140: Data Table on Middle East and Africa - Year-over-year growth 2024-2029 (%)
- Exhibits141: Chart on South America - Market size and forecast 2024-2029 ($ billion)
- Exhibits142: Data Table on South America - Market size and forecast 2024-2029 ($ billion)
- Exhibits143: Chart on South America - Year-over-year growth 2024-2029 (%)
- Exhibits144: Data Table on South America - Year-over-year growth 2024-2029 (%)
- Exhibits145: Chart on China - Market size and forecast 2024-2029 ($ billion)
- Exhibits146: Data Table on China - Market size and forecast 2024-2029 ($ billion)
- Exhibits147: Chart on China - Year-over-year growth 2024-2029 (%)
- Exhibits148: Data Table on China - Year-over-year growth 2024-2029 (%)
- Exhibits149: Chart on India - Market size and forecast 2024-2029 ($ billion)
- Exhibits150: Data Table on India - Market size and forecast 2024-2029 ($ billion)
- Exhibits151: Chart on India - Year-over-year growth 2024-2029 (%)
- Exhibits152: Data Table on India - Year-over-year growth 2024-2029 (%)
- Exhibits153: Chart on US - Market size and forecast 2024-2029 ($ billion)
- Exhibits154: Data Table on US - Market size and forecast 2024-2029 ($ billion)
- Exhibits155: Chart on US - Year-over-year growth 2024-2029 (%)
- Exhibits156: Data Table on US - Year-over-year growth 2024-2029 (%)
- Exhibits157: Chart on Japan - Market size and forecast 2024-2029 ($ billion)
- Exhibits158: Data Table on Japan - Market size and forecast 2024-2029 ($ billion)
- Exhibits159: Chart on Japan - Year-over-year growth 2024-2029 (%)
- Exhibits160: Data Table on Japan - Year-over-year growth 2024-2029 (%)
- Exhibits161: Chart on South Korea - Market size and forecast 2024-2029 ($ billion)
- Exhibits162: Data Table on South Korea - Market size and forecast 2024-2029 ($ billion)
- Exhibits163: Chart on South Korea - Year-over-year growth 2024-2029 (%)
- Exhibits164: Data Table on South Korea - Year-over-year growth 2024-2029 (%)
- Exhibits165: Chart on Russia - Market size and forecast 2024-2029 ($ billion)
- Exhibits166: Data Table on Russia - Market size and forecast 2024-2029 ($ billion)
- Exhibits167: Chart on Russia - Year-over-year growth 2024-2029 (%)
- Exhibits168: Data Table on Russia - Year-over-year growth 2024-2029 (%)
- Exhibits169: Chart on Turkey - Market size and forecast 2024-2029 ($ billion)
- Exhibits170: Data Table on Turkey - Market size and forecast 2024-2029 ($ billion)
- Exhibits171: Chart on Turkey - Year-over-year growth 2024-2029 (%)
- Exhibits172: Data Table on Turkey - Year-over-year growth 2024-2029 (%)
- Exhibits173: Chart on Germany - Market size and forecast 2024-2029 ($ billion)
- Exhibits174: Data Table on Germany - Market size and forecast 2024-2029 ($ billion)
- Exhibits175: Chart on Germany - Year-over-year growth 2024-2029 (%)
- Exhibits176: Data Table on Germany - Year-over-year growth 2024-2029 (%)
- Exhibits177: Chart on Mexico - Market size and forecast 2024-2029 ($ billion)
- Exhibits178: Data Table on Mexico - Market size and forecast 2024-2029 ($ billion)
- Exhibits179: Chart on Mexico - Year-over-year growth 2024-2029 (%)
- Exhibits180: Data Table on Mexico - Year-over-year growth 2024-2029 (%)
- Exhibits181: Chart on Italy - Market size and forecast 2024-2029 ($ billion)
- Exhibits182: Data Table on Italy - Market size and forecast 2024-2029 ($ billion)
- Exhibits183: Chart on Italy - Year-over-year growth 2024-2029 (%)
- Exhibits184: Data Table on Italy - Year-over-year growth 2024-2029 (%)
- Exhibits185: Market opportunity By Geographical Landscape ($ billion)
- Exhibits186: Data Tables on Market opportunity By Geographical Landscape ($ billion)
- Exhibits187: Impact of drivers and challenges in 2024 and 2029
- Exhibits188: Overview on criticality of inputs and factors of differentiation
- Exhibits189: Overview on factors of disruption
- Exhibits190: Impact of key risks on business
- Exhibits191: Companies covered
- Exhibits192: Company ranking index
- Exhibits193: Matrix on companies position and classification
- Exhibits194: Ansteel Group Corp. Ltd. - Overview
- Exhibits195: Ansteel Group Corp. Ltd. - Product / Service
- Exhibits196: Ansteel Group Corp. Ltd. - Key offerings
- Exhibits197: SWOT
- Exhibits198: ArcelorMittal SA - Overview
- Exhibits199: ArcelorMittal SA - Business segments
- Exhibits200: ArcelorMittal SA - Key news
- Exhibits201: ArcelorMittal SA - Key offerings
- Exhibits202: ArcelorMittal SA - Segment focus
- Exhibits203: SWOT
- Exhibits204: Baosteel Group Corp. - Overview
- Exhibits205: Baosteel Group Corp. - Product / Service
- Exhibits206: Baosteel Group Corp. - Key offerings
- Exhibits207: SWOT
- Exhibits208: Beijing Shougang Co. Ltd. - Overview
- Exhibits209: Beijing Shougang Co. Ltd. - Product / Service
- Exhibits210: Beijing Shougang Co. Ltd. - Key offerings
- Exhibits211: SWOT
- Exhibits212: Gerdau SA - Overview
- Exhibits213: Gerdau SA - Business segments
- Exhibits214: Gerdau SA - Key offerings
- Exhibits215: Gerdau SA - Segment focus
- Exhibits216: SWOT
- Exhibits217: HBIS Group Co. Ltd. - Overview
- Exhibits218: HBIS Group Co. Ltd. - Product / Service
- Exhibits219: HBIS Group Co. Ltd. - Key offerings
- Exhibits220: SWOT
- Exhibits221: JFE Holdings Inc. - Overview
- Exhibits222: JFE Holdings Inc. - Business segments
- Exhibits223: JFE Holdings Inc. - Key news
- Exhibits224: JFE Holdings Inc. - Key offerings
- Exhibits225: JFE Holdings Inc. - Segment focus
- Exhibits226: SWOT
- Exhibits227: JSW Steel - Overview
- Exhibits228: JSW Steel - Product / Service
- Exhibits229: JSW Steel - Key offerings
- Exhibits230: SWOT
- Exhibits231: Nippon Steel Corp. - Overview
- Exhibits232: Nippon Steel Corp. - Business segments
- Exhibits233: Nippon Steel Corp. - Key news
- Exhibits234: Nippon Steel Corp. - Key offerings
- Exhibits235: Nippon Steel Corp. - Segment focus
- Exhibits236: SWOT
- Exhibits237: Nucor Corp. - Overview
- Exhibits238: Nucor Corp. - Business segments
- Exhibits239: Nucor Corp. - Key news
- Exhibits240: Nucor Corp. - Key offerings
- Exhibits241: Nucor Corp. - Segment focus
- Exhibits242: SWOT
- Exhibits243: PAO Severstal - Overview
- Exhibits244: PAO Severstal - Business segments
- Exhibits245: PAO Severstal - Key offerings
- Exhibits246: PAO Severstal - Segment focus
- Exhibits247: SWOT
- Exhibits248: POSCO holdings Inc. - Overview
- Exhibits249: POSCO holdings Inc. - Product / Service
- Exhibits250: POSCO holdings Inc. - Key offerings
- Exhibits251: SWOT
- Exhibits252: Shagang Group Inc. - Overview
- Exhibits253: Shagang Group Inc. - Product / Service
- Exhibits254: Shagang Group Inc. - Key offerings
- Exhibits255: SWOT
- Exhibits256: Steel Dynamics Inc - Overview
- Exhibits257: Steel Dynamics Inc - Product / Service
- Exhibits258: Steel Dynamics Inc - Key offerings
- Exhibits259: SWOT
- Exhibits260: Tata Steel Ltd. - Overview
- Exhibits261: Tata Steel Ltd. - Business segments
- Exhibits262: Tata Steel Ltd. - Key news
- Exhibits263: Tata Steel Ltd. - Key offerings
- Exhibits264: Tata Steel Ltd. - Segment focus
- Exhibits265: SWOT
- Exhibits266: Inclusions checklist
- Exhibits267: Exclusions checklist
- Exhibits268: Currency conversion rates for US$
- Exhibits269: Research methodology
- Exhibits270: Information sources
- Exhibits271: Data validation
- Exhibits272: Validation techniques employed for market sizing
- Exhibits273: Data synthesis
- Exhibits274: 360 degree market analysis
- Exhibits275: List of abbreviations
The steel market is forecasted to grow by USD 307.4 bn during 2024-2029, accelerating at a CAGR of 4.5% during the forecast period. The report on the steel market provides a holistic analysis, market size and forecast, trends, growth drivers, and challenges, as well as vendor analysis covering around 25 vendors.
The report offers an up-to-date analysis regarding the current market scenario, the latest trends and drivers, and the overall market environment. The market is driven by urbanization and infrastructure development, industrialization in emerging economies, and automotive industry growth.
| Market Scope | |
|---|---|
| Base Year | 2025 |
| End Year | 2029 |
| Series Year | 2025-2029 |
| Growth Momentum | Accelerate |
| YOY 2025 | 4.3% |
| CAGR | 4.5% |
| Incremental Value | $307.4 bn |
The study was conducted using an objective combination of primary and secondary information including inputs from key participants in the industry. The report contains a comprehensive market size data, segment with regional analysis and vendor landscape in addition to an analysis of the key companies. Reports have historic and forecast data.
Technavio's steel market is segmented as below:
By Type
- Flat steel
- Long steel
By Application
- Structural steel
- Automotive steel
- Electrical steel
- Packaging steel
By End-user
- Construction
- Transportation
- Machinery
- Metal goods
- Others
By Method
- Basic oxygen furnace
- Electric arc furnace
- Open hearth furnace
By Geographical Landscape
- APAC
- Europe
- North America
- Middle East and Africa
- South America
This study identifies the shift toward sustainable production as one of the prime reasons driving the steel market growth during the next few years. Also, focus on additive manufacturing and increasing number of mergers and acquisitions will lead to sizable demand in the market.
The report on the steel market covers the following areas:
- Steel Market sizing
- Steel Market forecast
- Steel Market industry analysis
The robust vendor analysis is designed to help clients improve their market position, and in line with this, this report provides a detailed analysis of several leading steel market vendors that include Ansteel Group Corp. Ltd., ArcelorMittal SA, Baosteel Group Corp., Beijing Shougang Co. Ltd., Gerdau SA, HBIS Group Co. Ltd., JFE Holdings Inc., JSW Steel, Nippon Steel Corp., Nucor Corp., PAO Severstal, POSCO holdings Inc., Salzgitter AG, Shagang Group Inc., SSAB AB, Steel Dynamics Inc, Tata Steel Ltd., Tenaris SA, thyssenkrupp AG, and United States Steel Corp.. Also, the steel market analysis report includes information on upcoming trends and challenges that will influence market growth. This is to help companies strategize and leverage all forthcoming growth opportunities.
The publisher presents a detailed picture of the market by the way of study, synthesis, and summation of data from multiple sources by an analysis of key parameters such as profit, pricing, competition, and promotions. It presents various market facets by identifying the key industry influencers. The data presented is comprehensive, reliable, and a result of extensive primary and secondary research. The market research reports provide a complete competitive landscape and an in-depth vendor selection methodology and analysis using qualitative and quantitative research to forecast accurate market growth.
Table of Contents
1 Executive Summary
- 1.1 Market overview
- Executive Summary - Chart on Market Overview
- Executive Summary - Data Table on Market Overview
- Executive Summary - Chart on Global Market Characteristics
- Executive Summary - Chart on Market By Geographical Landscape
- Executive Summary - Chart on Market Segmentation by Type
- Executive Summary - Chart on Market Segmentation by Application
- Executive Summary - Chart on Market Segmentation by End-user
- Executive Summary - Chart on Market Segmentation by Method
- Executive Summary - Chart on Incremental Growth
- Executive Summary - Data Table on Incremental Growth
- Executive Summary - Chart on Company Market Positioning
2 Technavio Analysis
- 2.1 Analysis of price sensitivity, lifecycle, customer purchase basket, adoption rates, and purchase criteria
- Analysis of price sensitivity, lifecycle, customer purchase basket, adoption rates, and purchase criteria
- 2.2 Criticality of inputs and Factors of differentiation
- Overview on criticality of inputs and factors of differentiation
- 2.3 Factors of disruption
- Overview on factors of disruption
- 2.4 Impact of drivers and challenges
- Impact of drivers and challenges in 2024 and 2029
3 Market Landscape
- 3.1 Market ecosystem
- Parent Market
- Data Table on - Parent Market
- 3.2 Market characteristics
- Market characteristics analysis
- 3.3 Value chain analysis
- Value chain analysis
4 Market Sizing
- 4.1 Market definition
- Offerings of companies included in the market definition
- 4.2 Market segment analysis
- Market segments
- 4.3 Market size 2024
- 4.4 Market outlook: Forecast for 2024-2029
- Chart on Global - Market size and forecast 2024-2029 ($ billion)
- Data Table on Global - Market size and forecast 2024-2029 ($ billion)
- Chart on Global Market: Year-over-year growth 2024-2029 (%)
- Data Table on Global Market: Year-over-year growth 2024-2029 (%)
5 Historic Market Size
- 5.1 Global Steel Market 2019 - 2023
- Historic Market Size - Data Table on Global Steel Market 2019 - 2023 ($ billion)
- 5.2 Type segment analysis 2019 - 2023
- Historic Market Size - Type Segment 2019 - 2023 ($ billion)
- 5.3 Application segment analysis 2019 - 2023
- Historic Market Size - Application Segment 2019 - 2023 ($ billion)
- 5.4 End-user segment analysis 2019 - 2023
- Historic Market Size - End-user Segment 2019 - 2023 ($ billion)
- 5.5 Method segment analysis 2019 - 2023
- Historic Market Size - Method Segment 2019 - 2023 ($ billion)
- 5.6 Geography segment analysis 2019 - 2023
- Historic Market Size - Geography Segment 2019 - 2023 ($ billion)
- 5.7 Country segment analysis 2019 - 2023
- Historic Market Size - Country Segment 2019 - 2023 ($ billion)
6 Qualitative Analysis
- 6.1 Impact Analysis of U.S. Tariffs on Global Steel Market
7 Five Forces Analysis
- 7.1 Five forces summary
- Five forces analysis - Comparison between 2024 and 2029
- 7.2 Bargaining power of buyers
- Bargaining power of buyers - Impact of key factors 2024 and 2029
- 7.3 Bargaining power of suppliers
- Bargaining power of suppliers - Impact of key factors in 2024 and 2029
- 7.4 Threat of new entrants
- Threat of new entrants - Impact of key factors in 2024 and 2029
- 7.5 Threat of substitutes
- Threat of substitutes - Impact of key factors in 2024 and 2029
- 7.6 Threat of rivalry
- Threat of rivalry - Impact of key factors in 2024 and 2029
- 7.7 Market condition
- Chart on Market condition - Five forces 2024 and 2029
8 Market Segmentation by Type
- 8.1 Market segments
- Chart on Type - Market share 2024-2029 (%)
- Data Table on Type - Market share 2024-2029 (%)
- 8.2 Comparison by Type
- Chart on Comparison by Type
- Data Table on Comparison by Type
- 8.3 Flat steel - Market size and forecast 2024-2029
- Chart on Flat steel - Market size and forecast 2024-2029 ($ billion)
- Data Table on Flat steel - Market size and forecast 2024-2029 ($ billion)
- Chart on Flat steel - Year-over-year growth 2024-2029 (%)
- Data Table on Flat steel - Year-over-year growth 2024-2029 (%)
- 8.4 Long steel - Market size and forecast 2024-2029
- Chart on Long steel - Market size and forecast 2024-2029 ($ billion)
- Data Table on Long steel - Market size and forecast 2024-2029 ($ billion)
- Chart on Long steel - Year-over-year growth 2024-2029 (%)
- Data Table on Long steel - Year-over-year growth 2024-2029 (%)
- 8.5 Market opportunity by Type
- Market opportunity by Type ($ billion)
- Data Table on Market opportunity by Type ($ billion)
9 Market Segmentation by Application
- 9.1 Market segments
- Chart on Application - Market share 2024-2029 (%)
- Data Table on Application - Market share 2024-2029 (%)
- 9.2 Comparison by Application
- Chart on Comparison by Application
- Data Table on Comparison by Application
- 9.3 Structural steel - Market size and forecast 2024-2029
- Chart on Structural steel - Market size and forecast 2024-2029 ($ billion)
- Data Table on Structural steel - Market size and forecast 2024-2029 ($ billion)
- Chart on Structural steel - Year-over-year growth 2024-2029 (%)
- Data Table on Structural steel - Year-over-year growth 2024-2029 (%)
- 9.4 Automotive steel - Market size and forecast 2024-2029
- Chart on Automotive steel - Market size and forecast 2024-2029 ($ billion)
- Data Table on Automotive steel - Market size and forecast 2024-2029 ($ billion)
- Chart on Automotive steel - Year-over-year growth 2024-2029 (%)
- Data Table on Automotive steel - Year-over-year growth 2024-2029 (%)
- 9.5 Electrical steel - Market size and forecast 2024-2029
- Chart on Electrical steel - Market size and forecast 2024-2029 ($ billion)
- Data Table on Electrical steel - Market size and forecast 2024-2029 ($ billion)
- Chart on Electrical steel - Year-over-year growth 2024-2029 (%)
- Data Table on Electrical steel - Year-over-year growth 2024-2029 (%)
- 9.6 Packaging steel - Market size and forecast 2024-2029
- Chart on Packaging steel - Market size and forecast 2024-2029 ($ billion)
- Data Table on Packaging steel - Market size and forecast 2024-2029 ($ billion)
- Chart on Packaging steel - Year-over-year growth 2024-2029 (%)
- Data Table on Packaging steel - Year-over-year growth 2024-2029 (%)
- 9.7 Market opportunity by Application
- Market opportunity by Application ($ billion)
- Data Table on Market opportunity by Application ($ billion)
10 Market Segmentation by End-user
- 10.1 Market segments
- Chart on End-user - Market share 2024-2029 (%)
- Data Table on End-user - Market share 2024-2029 (%)
- 10.2 Comparison by End-user
- Chart on Comparison by End-user
- Data Table on Comparison by End-user
- 10.3 Construction - Market size and forecast 2024-2029
- Chart on Construction - Market size and forecast 2024-2029 ($ billion)
- Data Table on Construction - Market size and forecast 2024-2029 ($ billion)
- Chart on Construction - Year-over-year growth 2024-2029 (%)
- Data Table on Construction - Year-over-year growth 2024-2029 (%)
- 10.4 Transportation - Market size and forecast 2024-2029
- Chart on Transportation - Market size and forecast 2024-2029 ($ billion)
- Data Table on Transportation - Market size and forecast 2024-2029 ($ billion)
- Chart on Transportation - Year-over-year growth 2024-2029 (%)
- Data Table on Transportation - Year-over-year growth 2024-2029 (%)
- 10.5 Machinery - Market size and forecast 2024-2029
- Chart on Machinery - Market size and forecast 2024-2029 ($ billion)
- Data Table on Machinery - Market size and forecast 2024-2029 ($ billion)
- Chart on Machinery - Year-over-year growth 2024-2029 (%)
- Data Table on Machinery - Year-over-year growth 2024-2029 (%)
- 10.6 Metal goods - Market size and forecast 2024-2029
- Chart on Metal goods - Market size and forecast 2024-2029 ($ billion)
- Data Table on Metal goods - Market size and forecast 2024-2029 ($ billion)
- Chart on Metal goods - Year-over-year growth 2024-2029 (%)
- Data Table on Metal goods - Year-over-year growth 2024-2029 (%)
- 10.7 Others - Market size and forecast 2024-2029
- Chart on Others - Market size and forecast 2024-2029 ($ billion)
- Data Table on Others - Market size and forecast 2024-2029 ($ billion)
- Chart on Others - Year-over-year growth 2024-2029 (%)
- Data Table on Others - Year-over-year growth 2024-2029 (%)
- 10.8 Market opportunity by End-user
- Market opportunity by End-user ($ billion)
- Data Table on Market opportunity by End-user ($ billion)
11 Market Segmentation by Method
- 11.1 Market segments
- Chart on Method - Market share 2024-2029 (%)
- Data Table on Method - Market share 2024-2029 (%)
- 11.2 Comparison by Method
- Chart on Comparison by Method
- Data Table on Comparison by Method
- 11.3 Basic oxygen furnace - Market size and forecast 2024-2029
- Chart on Basic oxygen furnace - Market size and forecast 2024-2029 ($ billion)
- Data Table on Basic oxygen furnace - Market size and forecast 2024-2029 ($ billion)
- Chart on Basic oxygen furnace - Year-over-year growth 2024-2029 (%)
- Data Table on Basic oxygen furnace - Year-over-year growth 2024-2029 (%)
- 11.4 Electric arc furnace - Market size and forecast 2024-2029
- Chart on Electric arc furnace - Market size and forecast 2024-2029 ($ billion)
- Data Table on Electric arc furnace - Market size and forecast 2024-2029 ($ billion)
- Chart on Electric arc furnace - Year-over-year growth 2024-2029 (%)
- Data Table on Electric arc furnace - Year-over-year growth 2024-2029 (%)
- 11.5 Open hearth furnace - Market size and forecast 2024-2029
- Chart on Open hearth furnace - Market size and forecast 2024-2029 ($ billion)
- Data Table on Open hearth furnace - Market size and forecast 2024-2029 ($ billion)
- Chart on Open hearth furnace - Year-over-year growth 2024-2029 (%)
- Data Table on Open hearth furnace - Year-over-year growth 2024-2029 (%)
- 11.6 Market opportunity by Method
- Market opportunity by Method ($ billion)
- Data Table on Market opportunity by Method ($ billion)
12 Customer Landscape
- 12.1 Customer landscape overview
- Analysis of price sensitivity, lifecycle, customer purchase basket, adoption rates, and purchase criteria
13 Geographic Landscape
- 13.1 Geographic segmentation
- Chart on Market share By Geographical Landscape 2024-2029 (%)
- Data Table on Market share By Geographical Landscape 2024-2029 (%)
- 13.2 Geographic comparison
- Chart on Geographic comparison
- Data Table on Geographic comparison
- 13.3 APAC - Market size and forecast 2024-2029
- Chart on APAC - Market size and forecast 2024-2029 ($ billion)
- Data Table on APAC - Market size and forecast 2024-2029 ($ billion)
- Chart on APAC - Year-over-year growth 2024-2029 (%)
- Data Table on APAC - Year-over-year growth 2024-2029 (%)
- 13.4 Europe - Market size and forecast 2024-2029
- Chart on Europe - Market size and forecast 2024-2029 ($ billion)
- Data Table on Europe - Market size and forecast 2024-2029 ($ billion)
- Chart on Europe - Year-over-year growth 2024-2029 (%)
- Data Table on Europe - Year-over-year growth 2024-2029 (%)
- 13.5 North America - Market size and forecast 2024-2029
- Chart on North America - Market size and forecast 2024-2029 ($ billion)
- Data Table on North America - Market size and forecast 2024-2029 ($ billion)
- Chart on North America - Year-over-year growth 2024-2029 (%)
- Data Table on North America - Year-over-year growth 2024-2029 (%)
- 13.6 Middle East and Africa - Market size and forecast 2024-2029
- Chart on Middle East and Africa - Market size and forecast 2024-2029 ($ billion)
- Data Table on Middle East and Africa - Market size and forecast 2024-2029 ($ billion)
- Chart on Middle East and Africa - Year-over-year growth 2024-2029 (%)
- Data Table on Middle East and Africa - Year-over-year growth 2024-2029 (%)
- 13.7 South America - Market size and forecast 2024-2029
- Chart on South America - Market size and forecast 2024-2029 ($ billion)
- Data Table on South America - Market size and forecast 2024-2029 ($ billion)
- Chart on South America - Year-over-year growth 2024-2029 (%)
- Data Table on South America - Year-over-year growth 2024-2029 (%)
- 13.8 China - Market size and forecast 2024-2029
- Chart on China - Market size and forecast 2024-2029 ($ billion)
- Data Table on China - Market size and forecast 2024-2029 ($ billion)
- Chart on China - Year-over-year growth 2024-2029 (%)
- Data Table on China - Year-over-year growth 2024-2029 (%)
- 13.9 India - Market size and forecast 2024-2029
- Chart on India - Market size and forecast 2024-2029 ($ billion)
- Data Table on India - Market size and forecast 2024-2029 ($ billion)
- Chart on India - Year-over-year growth 2024-2029 (%)
- Data Table on India - Year-over-year growth 2024-2029 (%)
- 13.10 US - Market size and forecast 2024-2029
- Chart on US - Market size and forecast 2024-2029 ($ billion)
- Data Table on US - Market size and forecast 2024-2029 ($ billion)
- Chart on US - Year-over-year growth 2024-2029 (%)
- Data Table on US - Year-over-year growth 2024-2029 (%)
- 13.11 Japan - Market size and forecast 2024-2029
- Chart on Japan - Market size and forecast 2024-2029 ($ billion)
- Data Table on Japan - Market size and forecast 2024-2029 ($ billion)
- Chart on Japan - Year-over-year growth 2024-2029 (%)
- Data Table on Japan - Year-over-year growth 2024-2029 (%)
- 13.12 South Korea - Market size and forecast 2024-2029
- Chart on South Korea - Market size and forecast 2024-2029 ($ billion)
- Data Table on South Korea - Market size and forecast 2024-2029 ($ billion)
- Chart on South Korea - Year-over-year growth 2024-2029 (%)
- Data Table on South Korea - Year-over-year growth 2024-2029 (%)
- 13.13 Russia - Market size and forecast 2024-2029
- Chart on Russia - Market size and forecast 2024-2029 ($ billion)
- Data Table on Russia - Market size and forecast 2024-2029 ($ billion)
- Chart on Russia - Year-over-year growth 2024-2029 (%)
- Data Table on Russia - Year-over-year growth 2024-2029 (%)
- 13.14 Turkey - Market size and forecast 2024-2029
- Chart on Turkey - Market size and forecast 2024-2029 ($ billion)
- Data Table on Turkey - Market size and forecast 2024-2029 ($ billion)
- Chart on Turkey - Year-over-year growth 2024-2029 (%)
- Data Table on Turkey - Year-over-year growth 2024-2029 (%)
- 13.15 Germany - Market size and forecast 2024-2029
- Chart on Germany - Market size and forecast 2024-2029 ($ billion)
- Data Table on Germany - Market size and forecast 2024-2029 ($ billion)
- Chart on Germany - Year-over-year growth 2024-2029 (%)
- Data Table on Germany - Year-over-year growth 2024-2029 (%)
- 13.16 Mexico - Market size and forecast 2024-2029
- Chart on Mexico - Market size and forecast 2024-2029 ($ billion)
- Data Table on Mexico - Market size and forecast 2024-2029 ($ billion)
- Chart on Mexico - Year-over-year growth 2024-2029 (%)
- Data Table on Mexico - Year-over-year growth 2024-2029 (%)
- 13.17 Italy - Market size and forecast 2024-2029
- Chart on Italy - Market size and forecast 2024-2029 ($ billion)
- Data Table on Italy - Market size and forecast 2024-2029 ($ billion)
- Chart on Italy - Year-over-year growth 2024-2029 (%)
- Data Table on Italy - Year-over-year growth 2024-2029 (%)
- 13.18 Market opportunity By Geographical Landscape
- Market opportunity By Geographical Landscape ($ billion)
- Data Tables on Market opportunity By Geographical Landscape ($ billion)
14 Drivers, Challenges, and Opportunity/Restraints
- 14.1 Market drivers
- 14.2 Market challenges
- 14.3 Impact of drivers and challenges
- Impact of drivers and challenges in 2024 and 2029
- 14.4 Market opportunities/restraints
15 Competitive Landscape
- 15.1 Overview
- 15.2 Competitive Landscape
- Overview on criticality of inputs and factors of differentiation
- 15.3 Landscape disruption
- Overview on factors of disruption
- 15.4 Industry risks
- Impact of key risks on business
16 Competitive Analysis
- 16.1 Companies profiled
- Companies covered
- 16.2 Company ranking index
- Company ranking index
- 16.3 Market positioning of companies
- Matrix on companies position and classification
- 16.4 Ansteel Group Corp. Ltd.
- Ansteel Group Corp. Ltd. - Overview
- Ansteel Group Corp. Ltd. - Product / Service
- Ansteel Group Corp. Ltd. - Key offerings
- SWOT
- 16.5 ArcelorMittal SA
- ArcelorMittal SA - Overview
- ArcelorMittal SA - Business segments
- ArcelorMittal SA - Key news
- ArcelorMittal SA - Key offerings
- ArcelorMittal SA - Segment focus
- SWOT
- 16.6 Baosteel Group Corp.
- Baosteel Group Corp. - Overview
- Baosteel Group Corp. - Product / Service
- Baosteel Group Corp. - Key offerings
- SWOT
- 16.7 Beijing Shougang Co. Ltd.
- Beijing Shougang Co. Ltd. - Overview
- Beijing Shougang Co. Ltd. - Product / Service
- Beijing Shougang Co. Ltd. - Key offerings
- SWOT
- 16.8 Gerdau SA
- Gerdau SA - Overview
- Gerdau SA - Business segments
- Gerdau SA - Key offerings
- Gerdau SA - Segment focus
- SWOT
- 16.9 HBIS Group Co. Ltd.
- HBIS Group Co. Ltd. - Overview
- HBIS Group Co. Ltd. - Product / Service
- HBIS Group Co. Ltd. - Key offerings
- SWOT
- 16.10 JFE Holdings Inc.
- JFE Holdings Inc. - Overview
- JFE Holdings Inc. - Business segments
- JFE Holdings Inc. - Key news
- JFE Holdings Inc. - Key offerings
- JFE Holdings Inc. - Segment focus
- SWOT
- 16.11 JSW Steel
- JSW Steel - Overview
- JSW Steel - Product / Service
- JSW Steel - Key offerings
- SWOT
- 16.12 Nippon Steel Corp.
- Nippon Steel Corp. - Overview
- Nippon Steel Corp. - Business segments
- Nippon Steel Corp. - Key news
- Nippon Steel Corp. - Key offerings
- Nippon Steel Corp. - Segment focus
- SWOT
- 16.13 Nucor Corp.
- Nucor Corp. - Overview
- Nucor Corp. - Business segments
- Nucor Corp. - Key news
- Nucor Corp. - Key offerings
- Nucor Corp. - Segment focus
- SWOT
- 16.14 PAO Severstal
- PAO Severstal - Overview
- PAO Severstal - Business segments
- PAO Severstal - Key offerings
- PAO Severstal - Segment focus
- SWOT
- 16.15 POSCO holdings Inc.
- POSCO holdings Inc. - Overview
- POSCO holdings Inc. - Product / Service
- POSCO holdings Inc. - Key offerings
- SWOT
- 16.16 Shagang Group Inc.
- Shagang Group Inc. - Overview
- Shagang Group Inc. - Product / Service
- Shagang Group Inc. - Key offerings
- SWOT
- 16.17 Steel Dynamics Inc
- Steel Dynamics Inc - Overview
- Steel Dynamics Inc - Product / Service
- Steel Dynamics Inc - Key offerings
- SWOT
- 16.18 Tata Steel Ltd.
- Tata Steel Ltd. - Overview
- Tata Steel Ltd. - Business segments
- Tata Steel Ltd. - Key news
- Tata Steel Ltd. - Key offerings
- Tata Steel Ltd. - Segment focus
- SWOT
17 Appendix
- 17.1 Scope of the report
- 17.2 Inclusions and exclusions checklist
- Inclusions checklist
- Exclusions checklist
- 17.3 Currency conversion rates for US$
- Currency conversion rates for US$
- 17.4 Research methodology
- Research methodology
- 17.5 Data procurement
- Information sources
- 17.6 Data validation
- Data validation
- 17.7 Validation techniques employed for market sizing
- Validation techniques employed for market sizing
- 17.8 Data synthesis
- Data synthesis
- 17.9 360 degree market analysis
- 360 degree market analysis
- 17.10 List of abbreviations
- List of abbreviations

