|
|
市場調査レポート
商品コード
1723077
タワークレーンの世界市場 2025~2029年Global Tower Crane Market 2025-2029 |
||||||

|
|||||||
カスタマイズ可能
|
|||||||


| タワークレーンの世界市場 2025~2029年 |
|
出版日: 2025年05月01日
発行: TechNavio
ページ情報: 英文 225 Pages
納期: 即納可能
|

全表示
- 概要
- 図表
- 目次
タワークレーン市場は2024-2029年に14億9,130万米ドル、予測期間中のCAGRは4.7%で成長すると予測されます。
当レポートでは、タワークレーン市場の全体的な分析、市場規模・予測、動向、成長促進要因、課題、約25のベンダーを網羅したベンダー分析などを掲載しています。
現在の市場シナリオ、最新動向と促進要因、市場環境全体に関する最新分析を提供しています。市場は、高層ビル需要の増加、タワークレーンのレンタル需要の高まり、インフラ整備などの市場開拓によって牽引されています。
| 市場範囲 | |
|---|---|
| 基準年 | 2025 |
| 終了年 | 2029 |
| 予測期間 | 2025-2029 |
| 成長モメンタム | 加速 |
| 前年比2025年 | 4.6% |
| CAGR | 4.7% |
| 増分額 | 14億9,130万米ドル |
本調査は、業界の主要参加者からのインプットを含め、一次情報と二次情報を客観的に組み合わせて実施しました。レポートには、主要企業の分析に加え、包括的な市場規模データ、地域別分析によるセグメント、ベンダー情勢が含まれています。レポートには過去データと予測データがあります。
本調査では、ラフィングジブタワークレーンの導入が、今後数年間のタワークレーン市場の成長を促進する主要な理由の1つであると特定しています。また、高容量タワークレーンへの需要の増加や、先進的で燃費効率の良いタワークレーンへの需要の高まりは、市場の大きな需要につながります。
目次
第1章 エグゼクティブサマリー
- 市場概要
第2章 Technavio分析
- 価格・ライフサイクル・顧客購入バスケット・採用率・購入基準の分析
- インプットの重要性と差別化の要因
- 混乱の要因
- 促進要因と課題の影響
第3章 市場情勢
- 市場エコシステム
- 市場の特徴
- バリューチェーン分析
第4章 市場規模
- 市場の定義
- 市場セグメント分析
- 市場規模 2024
- 市場の見通し 2024-2029
第5章 市場規模実績
- タワークレーンの世界市場 2019-2023
- エンドユーザー別セグメント分析 2019-2023
- タイプ別セグメント分析 2019-2023
- 容量別セグメント分析 2019-2023
- 地域別セグメント分析 2019-2023
- 国別セグメント分析 2019-2023
第6章 定性分析
- AIの影響:タワークレーンの世界市場
第7章 ファイブフォース分析
- ファイブフォースの要約
- 買い手の交渉力
- 供給企業の交渉力
- 新規参入業者の脅威
- 代替品の脅威
- 競争の脅威
- 市況
第8章 市場セグメンテーション:エンドユーザー別
- 市場セグメント
- 比較:エンドユーザー別
- インフラストラクチャー:市場規模と予測 2024-2029
- 住宅用:市場規模と予測 2024-2029
- 商業用:市場規模と予測 2024-2029
- 市場機会:エンドユーザー別
第9章 市場セグメンテーション:タイプ別
- 市場セグメント
- 比較:タイプ別
- ハンマーヘッドタワークレーン:市場規模と予測 2024-2029
- ラフィングタワークレーン:市場規模と予測 2024-2029
- 自立式タワークレーン:市場規模と予測 2024-2029
- 市場機会:タイプ別
第10章 市場セグメンテーション:容量別
- 市場セグメント
- 比較:容量別
- 最大5トン:市場規模と予測 2024-2029
- 25トン以上:市場規模と予測 2024-2029
- 市場機会:容量別
第11章 顧客情勢
- 顧客情勢の概要
第12章 地域別情勢
- 地域別セグメンテーション
- 地域別比較
- アジア太平洋:市場規模と予測 2024-2029
- 北米:市場規模と予測 2024-2029
- 欧州:市場規模と予測 2024-2029
- 中東・アフリカ:市場規模と予測 2024-2029
- 南米:市場規模と予測 2024-2029
- 米国:市場規模と予測 2024-2029
- 中国:市場規模と予測 2024-2029
- カナダ:市場規模と予測 2024-2029
- 日本:市場規模と予測 2024-2029
- インド:市場規模と予測 2024-2029
- 韓国:市場規模と予測 2024-2029
- サウジアラビア:市場規模と予測 2024-2029
- オーストラリア:市場規模と予測 2024-2029
- ドイツ:市場規模と予測 2024-2029
- メキシコ:市場規模と予測 2024-2029
- 市場機会:地域情勢別
第13章 促進要因・課題・機会・抑制要因
- 市場促進要因
- 市場の課題
- 促進要因と課題の影響
- 市場の機会・抑制要因
第14章 競合情勢
- 概要
- 競合情勢
- 混乱の状況
- 業界のリスク
第15章 競合分析
- 企業プロファイル
- 企業ランキング指数
- 企業の市場ポジショニング
- Action Construction Equipment Ltd.
- Fangyuan Group Co. Ltd.
- FMGru srl
- Hyundai Everdigm Corp.
- Konecranes
- Liebherr International AG
- Linden Comansa S.L.
- Muhibbah Engineering M Bhd.
- Sany Group
- Terex Corp.
- The Manitowoc Co. Inc.
- WOLFFKRAN International AG
- Xuzhou Construction Machinery Group Co. Ltd.
- Zhejiang Huba Construction Machinery Co. Ltd.
- Zoomlion Heavy Industry Science and Technology Co. Ltd.
第16章 付録
Exhibits:
- Exhibits1: Executive Summary - Chart on Market Overview
- Exhibits2: Executive Summary - Data Table on Market Overview
- Exhibits3: Executive Summary - Chart on Global Market Characteristics
- Exhibits4: Executive Summary - Chart on Market By Geographical Landscape
- Exhibits5: Executive Summary - Chart on Market Segmentation by End-user
- Exhibits6: Executive Summary - Chart on Market Segmentation by Type
- Exhibits7: Executive Summary - Chart on Market Segmentation by Capacity
- Exhibits8: Executive Summary - Chart on Incremental Growth
- Exhibits9: Executive Summary - Data Table on Incremental Growth
- Exhibits10: Executive Summary - Chart on Company Market Positioning
- Exhibits11: Analysis of price sensitivity, lifecycle, customer purchase basket, adoption rates, and purchase criteria
- Exhibits12: Overview on criticality of inputs and factors of differentiation
- Exhibits13: Overview on factors of disruption
- Exhibits14: Impact of drivers and challenges in 2024 and 2029
- Exhibits15: Parent Market
- Exhibits16: Data Table on - Parent Market
- Exhibits17: Market characteristics analysis
- Exhibits18: Value chain analysis
- Exhibits19: Offerings of companies included in the market definition
- Exhibits20: Market segments
- Exhibits21: Chart on Global - Market size and forecast 2024-2029 ($ million)
- Exhibits22: Data Table on Global - Market size and forecast 2024-2029 ($ million)
- Exhibits23: Chart on Global Market: Year-over-year growth 2024-2029 (%)
- Exhibits24: Data Table on Global Market: Year-over-year growth 2024-2029 (%)
- Exhibits25: Historic Market Size - Data Table on Global Tower Crane Market 2019 - 2023 ($ million)
- Exhibits26: Historic Market Size - End-user Segment 2019 - 2023 ($ million)
- Exhibits27: Historic Market Size - Type Segment 2019 - 2023 ($ million)
- Exhibits28: Historic Market Size - Capacity Segment 2019 - 2023 ($ million)
- Exhibits29: Historic Market Size - Geography Segment 2019 - 2023 ($ million)
- Exhibits30: Historic Market Size - Country Segment 2019 - 2023 ($ million)
- Exhibits31: Five forces analysis - Comparison between 2024 and 2029
- Exhibits32: Bargaining power of buyers - Impact of key factors 2024 and 2029
- Exhibits33: Bargaining power of suppliers - Impact of key factors in 2024 and 2029
- Exhibits34: Threat of new entrants - Impact of key factors in 2024 and 2029
- Exhibits35: Threat of substitutes - Impact of key factors in 2024 and 2029
- Exhibits36: Threat of rivalry - Impact of key factors in 2024 and 2029
- Exhibits37: Chart on Market condition - Five forces 2024 and 2029
- Exhibits38: Chart on End-user - Market share 2024-2029 (%)
- Exhibits39: Data Table on End-user - Market share 2024-2029 (%)
- Exhibits40: Chart on Comparison by End-user
- Exhibits41: Data Table on Comparison by End-user
- Exhibits42: Chart on Infrastructure - Market size and forecast 2024-2029 ($ million)
- Exhibits43: Data Table on Infrastructure - Market size and forecast 2024-2029 ($ million)
- Exhibits44: Chart on Infrastructure - Year-over-year growth 2024-2029 (%)
- Exhibits45: Data Table on Infrastructure - Year-over-year growth 2024-2029 (%)
- Exhibits46: Chart on Residential - Market size and forecast 2024-2029 ($ million)
- Exhibits47: Data Table on Residential - Market size and forecast 2024-2029 ($ million)
- Exhibits48: Chart on Residential - Year-over-year growth 2024-2029 (%)
- Exhibits49: Data Table on Residential - Year-over-year growth 2024-2029 (%)
- Exhibits50: Chart on Commercial - Market size and forecast 2024-2029 ($ million)
- Exhibits51: Data Table on Commercial - Market size and forecast 2024-2029 ($ million)
- Exhibits52: Chart on Commercial - Year-over-year growth 2024-2029 (%)
- Exhibits53: Data Table on Commercial - Year-over-year growth 2024-2029 (%)
- Exhibits54: Market opportunity by End-user ($ million)
- Exhibits55: Data Table on Market opportunity by End-user ($ million)
- Exhibits56: Chart on Type - Market share 2024-2029 (%)
- Exhibits57: Data Table on Type - Market share 2024-2029 (%)
- Exhibits58: Chart on Comparison by Type
- Exhibits59: Data Table on Comparison by Type
- Exhibits60: Chart on Hammerhead tower cranes - Market size and forecast 2024-2029 ($ million)
- Exhibits61: Data Table on Hammerhead tower cranes - Market size and forecast 2024-2029 ($ million)
- Exhibits62: Chart on Hammerhead tower cranes - Year-over-year growth 2024-2029 (%)
- Exhibits63: Data Table on Hammerhead tower cranes - Year-over-year growth 2024-2029 (%)
- Exhibits64: Chart on Luffing tower cranes - Market size and forecast 2024-2029 ($ million)
- Exhibits65: Data Table on Luffing tower cranes - Market size and forecast 2024-2029 ($ million)
- Exhibits66: Chart on Luffing tower cranes - Year-over-year growth 2024-2029 (%)
- Exhibits67: Data Table on Luffing tower cranes - Year-over-year growth 2024-2029 (%)
- Exhibits68: Chart on Self-erecting tower cranes - Market size and forecast 2024-2029 ($ million)
- Exhibits69: Data Table on Self-erecting tower cranes - Market size and forecast 2024-2029 ($ million)
- Exhibits70: Chart on Self-erecting tower cranes - Year-over-year growth 2024-2029 (%)
- Exhibits71: Data Table on Self-erecting tower cranes - Year-over-year growth 2024-2029 (%)
- Exhibits72: Market opportunity by Type ($ million)
- Exhibits73: Data Table on Market opportunity by Type ($ million)
- Exhibits74: Chart on Capacity - Market share 2024-2029 (%)
- Exhibits75: Data Table on Capacity - Market share 2024-2029 (%)
- Exhibits76: Chart on Comparison by Capacity
- Exhibits77: Data Table on Comparison by Capacity
- Exhibits78: Chart on Up to 5 tons - Market size and forecast 2024-2029 ($ million)
- Exhibits79: Data Table on Up to 5 tons - Market size and forecast 2024-2029 ($ million)
- Exhibits80: Chart on Up to 5 tons - Year-over-year growth 2024-2029 (%)
- Exhibits81: Data Table on Up to 5 tons - Year-over-year growth 2024-2029 (%)
- Exhibits82: Chart on 5-10 tons - Market size and forecast 2024-2029 ($ million)
- Exhibits83: Data Table on 5-10 tons - Market size and forecast 2024-2029 ($ million)
- Exhibits84: Chart on 5-10 tons - Year-over-year growth 2024-2029 (%)
- Exhibits85: Data Table on 5-10 tons - Year-over-year growth 2024-2029 (%)
- Exhibits86: Chart on 11-16 tons - Market size and forecast 2024-2029 ($ million)
- Exhibits87: Data Table on 11-16 tons - Market size and forecast 2024-2029 ($ million)
- Exhibits88: Chart on 11-16 tons - Year-over-year growth 2024-2029 (%)
- Exhibits89: Data Table on 11-16 tons - Year-over-year growth 2024-2029 (%)
- Exhibits90: Chart on 17-25 tons - Market size and forecast 2024-2029 ($ million)
- Exhibits91: Data Table on 17-25 tons - Market size and forecast 2024-2029 ($ million)
- Exhibits92: Chart on 17-25 tons - Year-over-year growth 2024-2029 (%)
- Exhibits93: Data Table on 17-25 tons - Year-over-year growth 2024-2029 (%)
- Exhibits94: Chart on Above 25 tons - Market size and forecast 2024-2029 ($ million)
- Exhibits95: Data Table on Above 25 tons - Market size and forecast 2024-2029 ($ million)
- Exhibits96: Chart on Above 25 tons - Year-over-year growth 2024-2029 (%)
- Exhibits97: Data Table on Above 25 tons - Year-over-year growth 2024-2029 (%)
- Exhibits98: Market opportunity by Capacity ($ million)
- Exhibits99: Data Table on Market opportunity by Capacity ($ million)
- Exhibits100: Analysis of price sensitivity, lifecycle, customer purchase basket, adoption rates, and purchase criteria
- Exhibits101: Chart on Market share By Geographical Landscape 2024-2029 (%)
- Exhibits102: Data Table on Market share By Geographical Landscape 2024-2029 (%)
- Exhibits103: Chart on Geographic comparison
- Exhibits104: Data Table on Geographic comparison
- Exhibits105: Chart on APAC - Market size and forecast 2024-2029 ($ million)
- Exhibits106: Data Table on APAC - Market size and forecast 2024-2029 ($ million)
- Exhibits107: Chart on APAC - Year-over-year growth 2024-2029 (%)
- Exhibits108: Data Table on APAC - Year-over-year growth 2024-2029 (%)
- Exhibits109: Chart on North America - Market size and forecast 2024-2029 ($ million)
- Exhibits110: Data Table on North America - Market size and forecast 2024-2029 ($ million)
- Exhibits111: Chart on North America - Year-over-year growth 2024-2029 (%)
- Exhibits112: Data Table on North America - Year-over-year growth 2024-2029 (%)
- Exhibits113: Chart on Europe - Market size and forecast 2024-2029 ($ million)
- Exhibits114: Data Table on Europe - Market size and forecast 2024-2029 ($ million)
- Exhibits115: Chart on Europe - Year-over-year growth 2024-2029 (%)
- Exhibits116: Data Table on Europe - Year-over-year growth 2024-2029 (%)
- Exhibits117: Chart on Middle East and Africa - Market size and forecast 2024-2029 ($ million)
- Exhibits118: Data Table on Middle East and Africa - Market size and forecast 2024-2029 ($ million)
- Exhibits119: Chart on Middle East and Africa - Year-over-year growth 2024-2029 (%)
- Exhibits120: Data Table on Middle East and Africa - Year-over-year growth 2024-2029 (%)
- Exhibits121: Chart on South America - Market size and forecast 2024-2029 ($ million)
- Exhibits122: Data Table on South America - Market size and forecast 2024-2029 ($ million)
- Exhibits123: Chart on South America - Year-over-year growth 2024-2029 (%)
- Exhibits124: Data Table on South America - Year-over-year growth 2024-2029 (%)
- Exhibits125: Chart on US - Market size and forecast 2024-2029 ($ million)
- Exhibits126: Data Table on US - Market size and forecast 2024-2029 ($ million)
- Exhibits127: Chart on US - Year-over-year growth 2024-2029 (%)
- Exhibits128: Data Table on US - Year-over-year growth 2024-2029 (%)
- Exhibits129: Chart on China - Market size and forecast 2024-2029 ($ million)
- Exhibits130: Data Table on China - Market size and forecast 2024-2029 ($ million)
- Exhibits131: Chart on China - Year-over-year growth 2024-2029 (%)
- Exhibits132: Data Table on China - Year-over-year growth 2024-2029 (%)
- Exhibits133: Chart on Canada - Market size and forecast 2024-2029 ($ million)
- Exhibits134: Data Table on Canada - Market size and forecast 2024-2029 ($ million)
- Exhibits135: Chart on Canada - Year-over-year growth 2024-2029 (%)
- Exhibits136: Data Table on Canada - Year-over-year growth 2024-2029 (%)
- Exhibits137: Chart on Japan - Market size and forecast 2024-2029 ($ million)
- Exhibits138: Data Table on Japan - Market size and forecast 2024-2029 ($ million)
- Exhibits139: Chart on Japan - Year-over-year growth 2024-2029 (%)
- Exhibits140: Data Table on Japan - Year-over-year growth 2024-2029 (%)
- Exhibits141: Chart on India - Market size and forecast 2024-2029 ($ million)
- Exhibits142: Data Table on India - Market size and forecast 2024-2029 ($ million)
- Exhibits143: Chart on India - Year-over-year growth 2024-2029 (%)
- Exhibits144: Data Table on India - Year-over-year growth 2024-2029 (%)
- Exhibits145: Chart on South Korea - Market size and forecast 2024-2029 ($ million)
- Exhibits146: Data Table on South Korea - Market size and forecast 2024-2029 ($ million)
- Exhibits147: Chart on South Korea - Year-over-year growth 2024-2029 (%)
- Exhibits148: Data Table on South Korea - Year-over-year growth 2024-2029 (%)
- Exhibits149: Chart on Saudi Arabia - Market size and forecast 2024-2029 ($ million)
- Exhibits150: Data Table on Saudi Arabia - Market size and forecast 2024-2029 ($ million)
- Exhibits151: Chart on Saudi Arabia - Year-over-year growth 2024-2029 (%)
- Exhibits152: Data Table on Saudi Arabia - Year-over-year growth 2024-2029 (%)
- Exhibits153: Chart on Australia - Market size and forecast 2024-2029 ($ million)
- Exhibits154: Data Table on Australia - Market size and forecast 2024-2029 ($ million)
- Exhibits155: Chart on Australia - Year-over-year growth 2024-2029 (%)
- Exhibits156: Data Table on Australia - Year-over-year growth 2024-2029 (%)
- Exhibits157: Chart on Germany - Market size and forecast 2024-2029 ($ million)
- Exhibits158: Data Table on Germany - Market size and forecast 2024-2029 ($ million)
- Exhibits159: Chart on Germany - Year-over-year growth 2024-2029 (%)
- Exhibits160: Data Table on Germany - Year-over-year growth 2024-2029 (%)
- Exhibits161: Chart on Mexico - Market size and forecast 2024-2029 ($ million)
- Exhibits162: Data Table on Mexico - Market size and forecast 2024-2029 ($ million)
- Exhibits163: Chart on Mexico - Year-over-year growth 2024-2029 (%)
- Exhibits164: Data Table on Mexico - Year-over-year growth 2024-2029 (%)
- Exhibits165: Market opportunity By Geographical Landscape ($ million)
- Exhibits166: Data Tables on Market opportunity By Geographical Landscape ($ million)
- Exhibits167: Impact of drivers and challenges in 2024 and 2029
- Exhibits168: Overview on criticality of inputs and factors of differentiation
- Exhibits169: Overview on factors of disruption
- Exhibits170: Impact of key risks on business
- Exhibits171: Companies covered
- Exhibits172: Company ranking index
- Exhibits173: Matrix on companies position and classification
- Exhibits174: Action Construction Equipment Ltd. - Overview
- Exhibits175: Action Construction Equipment Ltd. - Business segments
- Exhibits176: Action Construction Equipment Ltd. - Key offerings
- Exhibits177: Action Construction Equipment Ltd. - Segment focus
- Exhibits178: SWOT
- Exhibits179: Fangyuan Group Co. Ltd. - Overview
- Exhibits180: Fangyuan Group Co. Ltd. - Product / Service
- Exhibits181: Fangyuan Group Co. Ltd. - Key offerings
- Exhibits182: SWOT
- Exhibits183: FMGru srl - Overview
- Exhibits184: FMGru srl - Product / Service
- Exhibits185: FMGru srl - Key offerings
- Exhibits186: SWOT
- Exhibits187: Hyundai Everdigm Corp. - Overview
- Exhibits188: Hyundai Everdigm Corp. - Product / Service
- Exhibits189: Hyundai Everdigm Corp. - Key offerings
- Exhibits190: SWOT
- Exhibits191: Konecranes - Overview
- Exhibits192: Konecranes - Business segments
- Exhibits193: Konecranes - Key news
- Exhibits194: Konecranes - Key offerings
- Exhibits195: Konecranes - Segment focus
- Exhibits196: SWOT
- Exhibits197: Liebherr International AG - Overview
- Exhibits198: Liebherr International AG - Product / Service
- Exhibits199: Liebherr International AG - Key offerings
- Exhibits200: SWOT
- Exhibits201: Linden Comansa S.L. - Overview
- Exhibits202: Linden Comansa S.L. - Product / Service
- Exhibits203: Linden Comansa S.L. - Key offerings
- Exhibits204: SWOT
- Exhibits205: Muhibbah Engineering M Bhd. - Overview
- Exhibits206: Muhibbah Engineering M Bhd. - Business segments
- Exhibits207: Muhibbah Engineering M Bhd. - Key offerings
- Exhibits208: Muhibbah Engineering M Bhd. - Segment focus
- Exhibits209: SWOT
- Exhibits210: Sany Group - Overview
- Exhibits211: Sany Group - Product / Service
- Exhibits212: Sany Group - Key news
- Exhibits213: Sany Group - Key offerings
- Exhibits214: SWOT
- Exhibits215: Terex Corp. - Overview
- Exhibits216: Terex Corp. - Business segments
- Exhibits217: Terex Corp. - Key news
- Exhibits218: Terex Corp. - Key offerings
- Exhibits219: Terex Corp. - Segment focus
- Exhibits220: SWOT
- Exhibits221: The Manitowoc Co. Inc. - Overview
- Exhibits222: The Manitowoc Co. Inc. - Business segments
- Exhibits223: The Manitowoc Co. Inc. - Key news
- Exhibits224: The Manitowoc Co. Inc. - Key offerings
- Exhibits225: The Manitowoc Co. Inc. - Segment focus
- Exhibits226: SWOT
- Exhibits227: WOLFFKRAN International AG - Overview
- Exhibits228: WOLFFKRAN International AG - Product / Service
- Exhibits229: WOLFFKRAN International AG - Key offerings
- Exhibits230: SWOT
- Exhibits231: Xuzhou Construction Machinery Group Co. Ltd. - Overview
- Exhibits232: Xuzhou Construction Machinery Group Co. Ltd. - Product / Service
- Exhibits233: Xuzhou Construction Machinery Group Co. Ltd. - Key offerings
- Exhibits234: SWOT
- Exhibits235: Zhejiang Huba Construction Machinery Co. Ltd. - Overview
- Exhibits236: Zhejiang Huba Construction Machinery Co. Ltd. - Product / Service
- Exhibits237: Zhejiang Huba Construction Machinery Co. Ltd. - Key offerings
- Exhibits238: SWOT
- Exhibits239: Zoomlion Heavy Industry Science and Technology Co. Ltd. - Overview
- Exhibits240: Zoomlion Heavy Industry Science and Technology Co. Ltd. - Business segments
- Exhibits241: Zoomlion Heavy Industry Science and Technology Co. Ltd. - Key offerings
- Exhibits242: Zoomlion Heavy Industry Science and Technology Co. Ltd. - Segment focus
- Exhibits243: SWOT
- Exhibits244: Inclusions checklist
- Exhibits245: Exclusions checklist
- Exhibits246: Currency conversion rates for US$
- Exhibits247: Research methodology
- Exhibits248: Information sources
- Exhibits249: Data validation
- Exhibits250: Validation techniques employed for market sizing
- Exhibits251: Data synthesis
- Exhibits252: 360 degree market analysis
- Exhibits253: List of abbreviations
The tower crane market is forecasted to grow by USD 1491.3 mn during 2024-2029, accelerating at a CAGR of 4.7% during the forecast period. The report on the tower crane market provides a holistic analysis, market size and forecast, trends, growth drivers, and challenges, as well as vendor analysis covering around 25 vendors.
The report offers an up-to-date analysis regarding the current market scenario, the latest trends and drivers, and the overall market environment. The market is driven by increasing demand for high-rise buildings, rising demand for tower cranes on rent, and developments in infrastructure.
| Market Scope | |
|---|---|
| Base Year | 2025 |
| End Year | 2029 |
| Series Year | 2025-2029 |
| Growth Momentum | Accelerate |
| YOY 2025 | 4.6% |
| CAGR | 4.7% |
| Incremental Value | $1491.3 mn |
The study was conducted using an objective combination of primary and secondary information including inputs from key participants in the industry. The report contains a comprehensive market size data, segment with regional analysis and vendor landscape in addition to an analysis of the key companies. Reports have historic and forecast data.
Technavio's tower crane market is segmented as below:
By End-user
- Infrastructure
- Residential
- Commercial
By Type
- Hammerhead tower cranes
- Luffing tower cranes
- Self-erecting tower cranes
By Capacity
- Up to 5 tons
- 5-10 tons
- 11-16 tons
- 17-25 tons
- Above 25 tons
By Geographical Landscape
- APAC
- North America
- Europe
- Middle East and Africa
- South America
This study identifies the introduction of luffing jib tower cranes as one of the prime reasons driving the tower crane market growth during the next few years. Also, increasing demand for high-capacity tower cranes and growing demand for advanced and fuel-efficient tower cranes will lead to sizable demand in the market.
The report on the tower crane market covers the following areas:
- Tower Crane Market sizing
- Tower Crane Market forecast
- Tower Crane Market industry analysis
The robust vendor analysis is designed to help clients improve their market position, and in line with this, this report provides a detailed analysis of several leading tower crane market vendors that include Action Construction Equipment Ltd., Fangyuan Group Co. Ltd., FMGru srl, Hyundai Everdigm Corp., Konecranes, Liebherr International AG, Linden Comansa S.L., Muhibbah Engineering M Bhd., Raimondi Cranes SpA, Sany Group, Shandong Dahan Construction Machinery Co. Ltd., Sichuan Construction Machinery Group Co. Ltd., Terex Corp., The Manitowoc Co. Inc., Toppower General Trading LLC, WOLFFKRAN International AG, Xuzhou Construction Machinery Group Co. Ltd., Yongmao Construction Machinery Co. Ltd., Zhejiang Huba Construction Machinery Co. Ltd., and Zoomlion Heavy Industry Science and Technology Co. Ltd.. Also, the tower crane market analysis report includes information on upcoming trends and challenges that will influence market growth. This is to help companies strategize and leverage all forthcoming growth opportunities.
The publisher presents a detailed picture of the market by the way of study, synthesis, and summation of data from multiple sources by an analysis of key parameters such as profit, pricing, competition, and promotions. It presents various market facets by identifying the key industry influencers. The data presented is comprehensive, reliable, and a result of extensive primary and secondary research. The market research reports provide a complete competitive landscape and an in-depth vendor selection methodology and analysis using qualitative and quantitative research to forecast accurate market growth.
Table of Contents
1 Executive Summary
- 1.1 Market overview
- Executive Summary - Chart on Market Overview
- Executive Summary - Data Table on Market Overview
- Executive Summary - Chart on Global Market Characteristics
- Executive Summary - Chart on Market By Geographical Landscape
- Executive Summary - Chart on Market Segmentation by End-user
- Executive Summary - Chart on Market Segmentation by Type
- Executive Summary - Chart on Market Segmentation by Capacity
- Executive Summary - Chart on Incremental Growth
- Executive Summary - Data Table on Incremental Growth
- Executive Summary - Chart on Company Market Positioning
2 Technavio Analysis
- 2.1 Analysis of price sensitivity, lifecycle, customer purchase basket, adoption rates, and purchase criteria
- Analysis of price sensitivity, lifecycle, customer purchase basket, adoption rates, and purchase criteria
- 2.2 Criticality of inputs and Factors of differentiation
- Overview on criticality of inputs and factors of differentiation
- 2.3 Factors of disruption
- Overview on factors of disruption
- 2.4 Impact of drivers and challenges
- Impact of drivers and challenges in 2024 and 2029
3 Market Landscape
- 3.1 Market ecosystem
- Parent Market
- Data Table on - Parent Market
- 3.2 Market characteristics
- Market characteristics analysis
- 3.3 Value chain analysis
- Value chain analysis
4 Market Sizing
- 4.1 Market definition
- Offerings of companies included in the market definition
- 4.2 Market segment analysis
- Market segments
- 4.3 Market size 2024
- 4.4 Market outlook: Forecast for 2024-2029
- Chart on Global - Market size and forecast 2024-2029 ($ million)
- Data Table on Global - Market size and forecast 2024-2029 ($ million)
- Chart on Global Market: Year-over-year growth 2024-2029 (%)
- Data Table on Global Market: Year-over-year growth 2024-2029 (%)
5 Historic Market Size
- 5.1 Global Tower Crane Market 2019 - 2023
- Historic Market Size - Data Table on Global Tower Crane Market 2019 - 2023 ($ million)
- 5.2 End-user segment analysis 2019 - 2023
- Historic Market Size - End-user Segment 2019 - 2023 ($ million)
- 5.3 Type segment analysis 2019 - 2023
- Historic Market Size - Type Segment 2019 - 2023 ($ million)
- 5.4 Capacity segment analysis 2019 - 2023
- Historic Market Size - Capacity Segment 2019 - 2023 ($ million)
- 5.5 Geography segment analysis 2019 - 2023
- Historic Market Size - Geography Segment 2019 - 2023 ($ million)
- 5.6 Country segment analysis 2019 - 2023
- Historic Market Size - Country Segment 2019 - 2023 ($ million)
6 Qualitative Analysis
- 6.1 The AI impact on global tower crane market
7 Five Forces Analysis
- 7.1 Five forces summary
- Five forces analysis - Comparison between 2024 and 2029
- 7.2 Bargaining power of buyers
- Bargaining power of buyers - Impact of key factors 2024 and 2029
- 7.3 Bargaining power of suppliers
- Bargaining power of suppliers - Impact of key factors in 2024 and 2029
- 7.4 Threat of new entrants
- Threat of new entrants - Impact of key factors in 2024 and 2029
- 7.5 Threat of substitutes
- Threat of substitutes - Impact of key factors in 2024 and 2029
- 7.6 Threat of rivalry
- Threat of rivalry - Impact of key factors in 2024 and 2029
- 7.7 Market condition
- Chart on Market condition - Five forces 2024 and 2029
8 Market Segmentation by End-user
- 8.1 Market segments
- Chart on End-user - Market share 2024-2029 (%)
- Data Table on End-user - Market share 2024-2029 (%)
- 8.2 Comparison by End-user
- Chart on Comparison by End-user
- Data Table on Comparison by End-user
- 8.3 Infrastructure - Market size and forecast 2024-2029
- Chart on Infrastructure - Market size and forecast 2024-2029 ($ million)
- Data Table on Infrastructure - Market size and forecast 2024-2029 ($ million)
- Chart on Infrastructure - Year-over-year growth 2024-2029 (%)
- Data Table on Infrastructure - Year-over-year growth 2024-2029 (%)
- 8.4 Residential - Market size and forecast 2024-2029
- Chart on Residential - Market size and forecast 2024-2029 ($ million)
- Data Table on Residential - Market size and forecast 2024-2029 ($ million)
- Chart on Residential - Year-over-year growth 2024-2029 (%)
- Data Table on Residential - Year-over-year growth 2024-2029 (%)
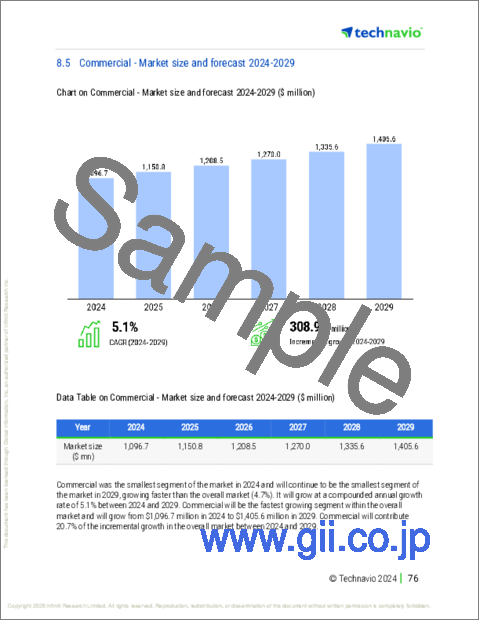
- 8.5 Commercial - Market size and forecast 2024-2029
- Chart on Commercial - Market size and forecast 2024-2029 ($ million)
- Data Table on Commercial - Market size and forecast 2024-2029 ($ million)
- Chart on Commercial - Year-over-year growth 2024-2029 (%)
- Data Table on Commercial - Year-over-year growth 2024-2029 (%)
- 8.6 Market opportunity by End-user
- Market opportunity by End-user ($ million)
- Data Table on Market opportunity by End-user ($ million)
9 Market Segmentation by Type
- 9.1 Market segments
- Chart on Type - Market share 2024-2029 (%)
- Data Table on Type - Market share 2024-2029 (%)
- 9.2 Comparison by Type
- Chart on Comparison by Type
- Data Table on Comparison by Type
- 9.3 Hammerhead tower cranes - Market size and forecast 2024-2029
- Chart on Hammerhead tower cranes - Market size and forecast 2024-2029 ($ million)
- Data Table on Hammerhead tower cranes - Market size and forecast 2024-2029 ($ million)
- Chart on Hammerhead tower cranes - Year-over-year growth 2024-2029 (%)
- Data Table on Hammerhead tower cranes - Year-over-year growth 2024-2029 (%)
- 9.4 Luffing tower cranes - Market size and forecast 2024-2029
- Chart on Luffing tower cranes - Market size and forecast 2024-2029 ($ million)
- Data Table on Luffing tower cranes - Market size and forecast 2024-2029 ($ million)
- Chart on Luffing tower cranes - Year-over-year growth 2024-2029 (%)
- Data Table on Luffing tower cranes - Year-over-year growth 2024-2029 (%)
- 9.5 Self-erecting tower cranes - Market size and forecast 2024-2029
- Chart on Self-erecting tower cranes - Market size and forecast 2024-2029 ($ million)
- Data Table on Self-erecting tower cranes - Market size and forecast 2024-2029 ($ million)
- Chart on Self-erecting tower cranes - Year-over-year growth 2024-2029 (%)
- Data Table on Self-erecting tower cranes - Year-over-year growth 2024-2029 (%)
- 9.6 Market opportunity by Type
- Market opportunity by Type ($ million)
- Data Table on Market opportunity by Type ($ million)
10 Market Segmentation by Capacity
- 10.1 Market segments
- Chart on Capacity - Market share 2024-2029 (%)
- Data Table on Capacity - Market share 2024-2029 (%)
- 10.2 Comparison by Capacity
- Chart on Comparison by Capacity
- Data Table on Comparison by Capacity
- 10.3 Up to 5 tons - Market size and forecast 2024-2029
- Chart on Up to 5 tons - Market size and forecast 2024-2029 ($ million)
- Data Table on Up to 5 tons - Market size and forecast 2024-2029 ($ million)
- Chart on Up to 5 tons - Year-over-year growth 2024-2029 (%)
- Data Table on Up to 5 tons - Year-over-year growth 2024-2029 (%)
- 5-10 tons - Market size and forecast 2024-2029
- Chart on 5-10 tons - Market size and forecast 2024-2029 ($ million)
- Data Table on 5-10 tons - Market size and forecast 2024-2029 ($ million)
- Chart on 5-10 tons - Year-over-year growth 2024-2029 (%)
- Data Table on 5-10 tons - Year-over-year growth 2024-2029 (%)
- 11-16 tons - Market size and forecast 2024-2029
- Chart on 11-16 tons - Market size and forecast 2024-2029 ($ million)
- Data Table on 11-16 tons - Market size and forecast 2024-2029 ($ million)
- Chart on 11-16 tons - Year-over-year growth 2024-2029 (%)
- Data Table on 11-16 tons - Year-over-year growth 2024-2029 (%)
- 17-25 tons - Market size and forecast 2024-2029
- Chart on 17-25 tons - Market size and forecast 2024-2029 ($ million)
- Data Table on 17-25 tons - Market size and forecast 2024-2029 ($ million)
- Chart on 17-25 tons - Year-over-year growth 2024-2029 (%)
- Data Table on 17-25 tons - Year-over-year growth 2024-2029 (%)
- 10.7 Above 25 tons - Market size and forecast 2024-2029
- Chart on Above 25 tons - Market size and forecast 2024-2029 ($ million)
- Data Table on Above 25 tons - Market size and forecast 2024-2029 ($ million)
- Chart on Above 25 tons - Year-over-year growth 2024-2029 (%)
- Data Table on Above 25 tons - Year-over-year growth 2024-2029 (%)
- 10.8 Market opportunity by Capacity
- Market opportunity by Capacity ($ million)
- Data Table on Market opportunity by Capacity ($ million)
11 Customer Landscape
- 11.1 Customer landscape overview
- Analysis of price sensitivity, lifecycle, customer purchase basket, adoption rates, and purchase criteria
12 Geographic Landscape
- 12.1 Geographic segmentation
- Chart on Market share By Geographical Landscape 2024-2029 (%)
- Data Table on Market share By Geographical Landscape 2024-2029 (%)
- 12.2 Geographic comparison
- Chart on Geographic comparison
- Data Table on Geographic comparison
- 12.3 APAC - Market size and forecast 2024-2029
- Chart on APAC - Market size and forecast 2024-2029 ($ million)
- Data Table on APAC - Market size and forecast 2024-2029 ($ million)
- Chart on APAC - Year-over-year growth 2024-2029 (%)
- Data Table on APAC - Year-over-year growth 2024-2029 (%)
- 12.4 North America - Market size and forecast 2024-2029
- Chart on North America - Market size and forecast 2024-2029 ($ million)
- Data Table on North America - Market size and forecast 2024-2029 ($ million)
- Chart on North America - Year-over-year growth 2024-2029 (%)
- Data Table on North America - Year-over-year growth 2024-2029 (%)
- 12.5 Europe - Market size and forecast 2024-2029
- Chart on Europe - Market size and forecast 2024-2029 ($ million)
- Data Table on Europe - Market size and forecast 2024-2029 ($ million)
- Chart on Europe - Year-over-year growth 2024-2029 (%)
- Data Table on Europe - Year-over-year growth 2024-2029 (%)
- 12.6 Middle East and Africa - Market size and forecast 2024-2029
- Chart on Middle East and Africa - Market size and forecast 2024-2029 ($ million)
- Data Table on Middle East and Africa - Market size and forecast 2024-2029 ($ million)
- Chart on Middle East and Africa - Year-over-year growth 2024-2029 (%)
- Data Table on Middle East and Africa - Year-over-year growth 2024-2029 (%)
- 12.7 South America - Market size and forecast 2024-2029
- Chart on South America - Market size and forecast 2024-2029 ($ million)
- Data Table on South America - Market size and forecast 2024-2029 ($ million)
- Chart on South America - Year-over-year growth 2024-2029 (%)
- Data Table on South America - Year-over-year growth 2024-2029 (%)
- 12.8 US - Market size and forecast 2024-2029
- Chart on US - Market size and forecast 2024-2029 ($ million)
- Data Table on US - Market size and forecast 2024-2029 ($ million)
- Chart on US - Year-over-year growth 2024-2029 (%)
- Data Table on US - Year-over-year growth 2024-2029 (%)
- 12.9 China - Market size and forecast 2024-2029
- Chart on China - Market size and forecast 2024-2029 ($ million)
- Data Table on China - Market size and forecast 2024-2029 ($ million)
- Chart on China - Year-over-year growth 2024-2029 (%)
- Data Table on China - Year-over-year growth 2024-2029 (%)
- 12.10 Canada - Market size and forecast 2024-2029
- Chart on Canada - Market size and forecast 2024-2029 ($ million)
- Data Table on Canada - Market size and forecast 2024-2029 ($ million)
- Chart on Canada - Year-over-year growth 2024-2029 (%)
- Data Table on Canada - Year-over-year growth 2024-2029 (%)
- 12.11 Japan - Market size and forecast 2024-2029
- Chart on Japan - Market size and forecast 2024-2029 ($ million)
- Data Table on Japan - Market size and forecast 2024-2029 ($ million)
- Chart on Japan - Year-over-year growth 2024-2029 (%)
- Data Table on Japan - Year-over-year growth 2024-2029 (%)
- 12.12 India - Market size and forecast 2024-2029
- Chart on India - Market size and forecast 2024-2029 ($ million)
- Data Table on India - Market size and forecast 2024-2029 ($ million)
- Chart on India - Year-over-year growth 2024-2029 (%)
- Data Table on India - Year-over-year growth 2024-2029 (%)
- 12.13 South Korea - Market size and forecast 2024-2029
- Chart on South Korea - Market size and forecast 2024-2029 ($ million)
- Data Table on South Korea - Market size and forecast 2024-2029 ($ million)
- Chart on South Korea - Year-over-year growth 2024-2029 (%)
- Data Table on South Korea - Year-over-year growth 2024-2029 (%)
- 12.14 Saudi Arabia - Market size and forecast 2024-2029
- Chart on Saudi Arabia - Market size and forecast 2024-2029 ($ million)
- Data Table on Saudi Arabia - Market size and forecast 2024-2029 ($ million)
- Chart on Saudi Arabia - Year-over-year growth 2024-2029 (%)
- Data Table on Saudi Arabia - Year-over-year growth 2024-2029 (%)
- 12.15 Australia - Market size and forecast 2024-2029
- Chart on Australia - Market size and forecast 2024-2029 ($ million)
- Data Table on Australia - Market size and forecast 2024-2029 ($ million)
- Chart on Australia - Year-over-year growth 2024-2029 (%)
- Data Table on Australia - Year-over-year growth 2024-2029 (%)
- 12.16 Germany - Market size and forecast 2024-2029
- Chart on Germany - Market size and forecast 2024-2029 ($ million)
- Data Table on Germany - Market size and forecast 2024-2029 ($ million)
- Chart on Germany - Year-over-year growth 2024-2029 (%)
- Data Table on Germany - Year-over-year growth 2024-2029 (%)
- 12.17 Mexico - Market size and forecast 2024-2029
- Chart on Mexico - Market size and forecast 2024-2029 ($ million)
- Data Table on Mexico - Market size and forecast 2024-2029 ($ million)
- Chart on Mexico - Year-over-year growth 2024-2029 (%)
- Data Table on Mexico - Year-over-year growth 2024-2029 (%)
- 12.18 Market opportunity By Geographical Landscape
- Market opportunity By Geographical Landscape ($ million)
- Data Tables on Market opportunity By Geographical Landscape ($ million)
13 Drivers, Challenges, and Opportunity/Restraints
- 13.1 Market drivers
- 13.2 Market challenges
- 13.3 Impact of drivers and challenges
- Impact of drivers and challenges in 2024 and 2029
- 13.4 Market opportunities/restraints
14 Competitive Landscape
- 14.1 Overview
- 14.2 Competitive Landscape
- Overview on criticality of inputs and factors of differentiation
- 14.3 Landscape disruption
- Overview on factors of disruption
- 14.4 Industry risks
- Impact of key risks on business
15 Competitive Analysis
- 15.1 Companies profiled
- Companies covered
- 15.2 Company ranking index
- Company ranking index
- 15.3 Market positioning of companies
- Matrix on companies position and classification
- 15.4 Action Construction Equipment Ltd.
- Action Construction Equipment Ltd. - Overview
- Action Construction Equipment Ltd. - Business segments
- Action Construction Equipment Ltd. - Key offerings
- Action Construction Equipment Ltd. - Segment focus
- SWOT
- 15.5 Fangyuan Group Co. Ltd.
- Fangyuan Group Co. Ltd. - Overview
- Fangyuan Group Co. Ltd. - Product / Service
- Fangyuan Group Co. Ltd. - Key offerings
- SWOT
- 15.6 FMGru srl
- FMGru srl - Overview
- FMGru srl - Product / Service
- FMGru srl - Key offerings
- SWOT
- 15.7 Hyundai Everdigm Corp.
- Hyundai Everdigm Corp. - Overview
- Hyundai Everdigm Corp. - Product / Service
- Hyundai Everdigm Corp. - Key offerings
- SWOT
- 15.8 Konecranes
- Konecranes - Overview
- Konecranes - Business segments
- Konecranes - Key news
- Konecranes - Key offerings
- Konecranes - Segment focus
- SWOT
- 15.9 Liebherr International AG
- Liebherr International AG - Overview
- Liebherr International AG - Product / Service
- Liebherr International AG - Key offerings
- SWOT
- 15.10 Linden Comansa S.L.
- Linden Comansa S.L. - Overview
- Linden Comansa S.L. - Product / Service
- Linden Comansa S.L. - Key offerings
- SWOT
- 15.11 Muhibbah Engineering M Bhd.
- Muhibbah Engineering M Bhd. - Overview
- Muhibbah Engineering M Bhd. - Business segments
- Muhibbah Engineering M Bhd. - Key offerings
- Muhibbah Engineering M Bhd. - Segment focus
- SWOT
- 15.12 Sany Group
- Sany Group - Overview
- Sany Group - Product / Service
- Sany Group - Key news
- Sany Group - Key offerings
- SWOT
- 15.13 Terex Corp.
- Terex Corp. - Overview
- Terex Corp. - Business segments
- Terex Corp. - Key news
- Terex Corp. - Key offerings
- Terex Corp. - Segment focus
- SWOT
- 15.14 The Manitowoc Co. Inc.
- The Manitowoc Co. Inc. - Overview
- The Manitowoc Co. Inc. - Business segments
- The Manitowoc Co. Inc. - Key news
- The Manitowoc Co. Inc. - Key offerings
- The Manitowoc Co. Inc. - Segment focus
- SWOT
- 15.15 WOLFFKRAN International AG
- WOLFFKRAN International AG - Overview
- WOLFFKRAN International AG - Product / Service
- WOLFFKRAN International AG - Key offerings
- SWOT
- 15.16 Xuzhou Construction Machinery Group Co. Ltd.
- Xuzhou Construction Machinery Group Co. Ltd. - Overview
- Xuzhou Construction Machinery Group Co. Ltd. - Product / Service
- Xuzhou Construction Machinery Group Co. Ltd. - Key offerings
- SWOT
- 15.17 Zhejiang Huba Construction Machinery Co. Ltd.
- Zhejiang Huba Construction Machinery Co. Ltd. - Overview
- Zhejiang Huba Construction Machinery Co. Ltd. - Product / Service
- Zhejiang Huba Construction Machinery Co. Ltd. - Key offerings
- SWOT
- 15.18 Zoomlion Heavy Industry Science and Technology Co. Ltd.
- Zoomlion Heavy Industry Science and Technology Co. Ltd. - Overview
- Zoomlion Heavy Industry Science and Technology Co. Ltd. - Business segments
- Zoomlion Heavy Industry Science and Technology Co. Ltd. - Key offerings
- Zoomlion Heavy Industry Science and Technology Co. Ltd. - Segment focus
- SWOT
16 Appendix
- 16.1 Scope of the report
- 16.2 Inclusions and exclusions checklist
- Inclusions checklist
- Exclusions checklist
- 16.3 Currency conversion rates for US$
- Currency conversion rates for US$
- 16.4 Research methodology
- Research methodology
- 16.5 Data procurement
- Information sources
- 16.6 Data validation
- Data validation
- 16.7 Validation techniques employed for market sizing
- Validation techniques employed for market sizing
- 16.8 Data synthesis
- Data synthesis
- 16.9 360 degree market analysis
- 360 degree market analysis
- 16.10 List of abbreviations
- List of abbreviations
