|
|
市場調査レポート
商品コード
1705194
繊維産業廃棄物管理の世界市場 2025~2029年Global Textile Industry Waste Management Market 2025-2029 |
||||||

|
|||||||
カスタマイズ可能
|
|||||||


| 繊維産業廃棄物管理の世界市場 2025~2029年 |
|
出版日: 2025年04月03日
発行: TechNavio
ページ情報: 英文 230 Pages
納期: 即納可能
|

全表示
- 概要
- 図表
- 目次
繊維産業廃棄物管理市場は2024-2029年に44億9,560万米ドル、予測期間中のCAGRは17.8%で成長すると予測されます。
当レポートでは、繊維産業廃棄物管理市場の全体的な分析、市場規模・予測、動向、成長促進要因、課題、約25のベンダーを網羅したベンダー分析などを掲載しています。
現在の市場シナリオ、最新動向と促進要因、市場環境全体に関する最新分析を提供しています。市場は、持続可能性と環境保護に対する意識の高まり、廃棄物管理に関する規制や法律の増加、環境に優しいリサイクル繊維製品に対する消費者の需要の高まりによって牽引されています。
| 市場範囲 | |
|---|---|
| 基準年 | 2025 |
| 終了年 | 2029 |
| 予測期間 | 2025-2029 |
| 成長モメンタム | 加速 |
| 前年比2025年 | 12.8% |
| CAGR | 17.8% |
| 増分額 | 44億9,560万米ドル |
本調査は、業界の主要参加者からのインプットを含め、一次情報と二次情報を客観的に組み合わせて実施しました。レポートには、主要企業の分析に加え、包括的な市場規模データ、地域分析によるセグメント、ベンダー情勢が含まれています。レポートにはヒストリカルデータと予測データがあります。
本調査では、今後数年間の繊維産業廃棄物管理市場の成長を促進する主な理由の1つとして、繊維廃棄物のより良い監視と削減を可能にするAIとIoTの統合を挙げています。また、繊維廃棄物のリサイクルと再利用につながる循環型経済モデルの採用、繊維生産における生分解性および堆肥化可能な材料の使用は、廃棄物の発生を最小限に抑えるため、市場の大きな需要につながります。
目次
第1章 エグゼクティブサマリー
- 市場概要
第2章 Technavio分析
- 価格・ライフサイクル・顧客購入バスケット・採用率・購入基準の分析
- インプットの重要性と差別化の要因
- 混乱の要因
- 促進要因と課題の影響
第3章 市場情勢
- 市場エコシステム
- 市場の特徴
- バリューチェーン分析
第4章 市場規模
- 市場の定義
- 市場セグメント分析
- 市場規模 2024
- 市場の見通し 2024-2029
第5章 市場規模実績
- 繊維産業廃棄物管理の世界市場 2019-2023
- サービスタイプ別セグメント分析 2019-2023
- 素材別セグメント分析 2019-2023
- タイプ別セグメント分析 2019-2023
- 地域別セグメント分析 2019-2023
- 国別セグメント分析 2019-2023
第6章 定性分析
- AIの影響:繊維産業廃棄物管理の世界市場
第7章 ファイブフォース分析
- ファイブフォースの要約
- 買い手の交渉力
- 供給企業の交渉力
- 新規参入業者の脅威
- 代替品の脅威
- 競争の脅威
- 市況
第8章 市場セグメンテーション:サービスタイプ別
- 市場セグメント
- 比較:サービスタイプ別
- 埋め立て地:市場規模と予測 2024-2029
- 不法投棄:市場規模と予測 2024-2029
- 焼却:市場規模と予測 2024-2029
- リサイクル:市場規模と予測 2024-2029
- 堆肥化と嫌気性消化:市場規模と予測 2024-2029
- 市場機会:サービスタイプ別
第9章 市場セグメンテーション:素材別
- 市場セグメント
- 比較:素材別
- 天然繊維:市場規模と予測 2024-2029
- 合成繊維:市場規模と予測 2024-2029
- 混紡生地:市場規模と予測 2024-2029
- 市場機会:素材別
第10章 市場セグメンテーション:タイプ別
- 市場セグメント
- 比較:タイプ別
- 危険物:市場規模と予測 2024-2029
- プラスチック:市場規模と予測 2024-2029
- ポリエステル:市場規模と予測 2024-2029
- その他:市場規模と予測 2024-2029
- 市場機会:タイプ別
第11章 顧客情勢
- 顧客情勢の概要
第12章 地域別情勢
- 地域別セグメンテーション
- 地域別比較
- アジア太平洋:市場規模と予測 2024-2029
- 北米:市場規模と予測 2024-2029
- 欧州:市場規模と予測 2024-2029
- 中東・アフリカ:市場規模と予測 2024-2029
- 南米:市場規模と予測 2024-2029
- 米国:市場規模と予測 2024-2029
- 中国:市場規模と予測 2024-2029
- 日本:市場規模と予測 2024-2029
- インド:市場規模と予測 2024-2029
- 韓国:市場規模と予測 2024-2029
- カナダ:市場規模と予測 2024-2029
- 英国:市場規模と予測 2024-2029
- ドイツ:市場規模と予測 2024-2029
- オーストラリア:市場規模と予測 2024-2029
- フランス:市場規模と予測 2024-2029
- 市場機会:地域情勢別
第13章 促進要因・課題・機会・抑制要因
- 市場促進要因
- 市場の課題
- 促進要因と課題の影響
- 市場の機会・抑制要因
第14章 競合情勢
- 概要
- 競合情勢
- 混乱の状況
- 業界のリスク
第15章 競合分析
- 企業プロファイル
- 企業ランキング指数
- 企業の市場ポジショニング
- Aditya Birla Management Corp. Pvt. Ltd.
- BLS Ecotech Ltd.
- Boer Group
- Evrnu Inc.
- FABSCRAP
- Infinited Fiber Co.
- Lenzing AG
- PROCOTEX BELGIUM SA
- Pure Waste Textiles Oy
- Re NewCell AB
- Recover Textile Systems S.L
- Remondis SE and Co. KG
- SAAHAS WASTE MANAGEMENT Pvt. Ltd.
- TEXAID Textilverwertungs AG
- Veolia Environnement SA
第16章 付録
Exhibits:
- Exhibits1: Executive Summary - Chart on Market Overview
- Exhibits2: Executive Summary - Data Table on Market Overview
- Exhibits3: Executive Summary - Chart on Global Market Characteristics
- Exhibits4: Executive Summary - Chart on Market By Geographical Landscape
- Exhibits5: Executive Summary - Chart on Market Segmentation by Service Type
- Exhibits6: Executive Summary - Chart on Market Segmentation by Material
- Exhibits7: Executive Summary - Chart on Market Segmentation by Type
- Exhibits8: Executive Summary - Chart on Incremental Growth
- Exhibits9: Executive Summary - Data Table on Incremental Growth
- Exhibits10: Executive Summary - Chart on Company Market Positioning
- Exhibits11: Analysis of price sensitivity, lifecycle, customer purchase basket, adoption rates, and purchase criteria
- Exhibits12: Overview on criticality of inputs and factors of differentiation
- Exhibits13: Overview on factors of disruption
- Exhibits14: Impact of drivers and challenges in 2024 and 2029
- Exhibits15: Parent Market
- Exhibits16: Data Table on - Parent Market
- Exhibits17: Market characteristics analysis
- Exhibits18: Value chain analysis
- Exhibits19: Offerings of companies included in the market definition
- Exhibits20: Market segments
- Exhibits21: Chart on Global - Market size and forecast 2024-2029 ($ million)
- Exhibits22: Data Table on Global - Market size and forecast 2024-2029 ($ million)
- Exhibits23: Chart on Global Market: Year-over-year growth 2024-2029 (%)
- Exhibits24: Data Table on Global Market: Year-over-year growth 2024-2029 (%)
- Exhibits25: Historic Market Size - Data Table on Global Textile Industry Waste Management Market 2019 - 2023 ($ million)
- Exhibits26: Historic Market Size - Service Type Segment 2019 - 2023 ($ million)
- Exhibits27: Historic Market Size - Material Segment 2019 - 2023 ($ million)
- Exhibits28: Historic Market Size - Type Segment 2019 - 2023 ($ million)
- Exhibits29: Historic Market Size - Geography Segment 2019 - 2023 ($ million)
- Exhibits30: Historic Market Size - Country Segment 2019 - 2023 ($ million)
- Exhibits31: Five forces analysis - Comparison between 2024 and 2029
- Exhibits32: Bargaining power of buyers - Impact of key factors 2024 and 2029
- Exhibits33: Bargaining power of suppliers - Impact of key factors in 2024 and 2029
- Exhibits34: Threat of new entrants - Impact of key factors in 2024 and 2029
- Exhibits35: Threat of substitutes - Impact of key factors in 2024 and 2029
- Exhibits36: Threat of rivalry - Impact of key factors in 2024 and 2029
- Exhibits37: Chart on Market condition - Five forces 2024 and 2029
- Exhibits38: Chart on Service Type - Market share 2024-2029 (%)
- Exhibits39: Data Table on Service Type - Market share 2024-2029 (%)
- Exhibits40: Chart on Comparison by Service Type
- Exhibits41: Data Table on Comparison by Service Type
- Exhibits42: Chart on Landfill - Market size and forecast 2024-2029 ($ million)
- Exhibits43: Data Table on Landfill - Market size and forecast 2024-2029 ($ million)
- Exhibits44: Chart on Landfill - Year-over-year growth 2024-2029 (%)
- Exhibits45: Data Table on Landfill - Year-over-year growth 2024-2029 (%)
- Exhibits46: Chart on Open dumping - Market size and forecast 2024-2029 ($ million)
- Exhibits47: Data Table on Open dumping - Market size and forecast 2024-2029 ($ million)
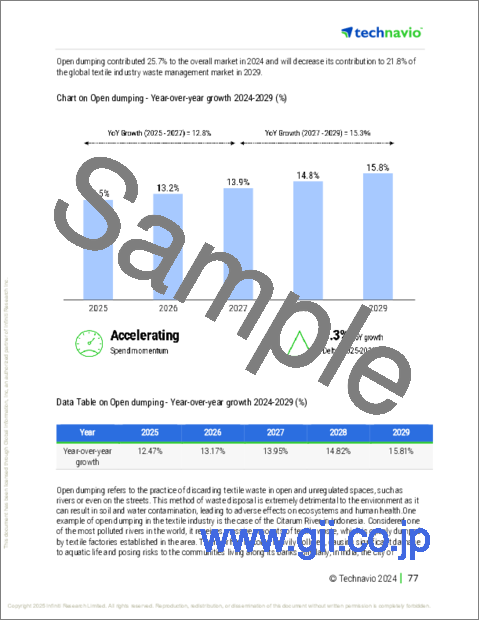
- Exhibits48: Chart on Open dumping - Year-over-year growth 2024-2029 (%)
- Exhibits49: Data Table on Open dumping - Year-over-year growth 2024-2029 (%)
- Exhibits50: Chart on Incineration - Market size and forecast 2024-2029 ($ million)
- Exhibits51: Data Table on Incineration - Market size and forecast 2024-2029 ($ million)
- Exhibits52: Chart on Incineration - Year-over-year growth 2024-2029 (%)
- Exhibits53: Data Table on Incineration - Year-over-year growth 2024-2029 (%)
- Exhibits54: Chart on Recycling - Market size and forecast 2024-2029 ($ million)
- Exhibits55: Data Table on Recycling - Market size and forecast 2024-2029 ($ million)
- Exhibits56: Chart on Recycling - Year-over-year growth 2024-2029 (%)
- Exhibits57: Data Table on Recycling - Year-over-year growth 2024-2029 (%)
- Exhibits58: Chart on Composting and anaerobic digestion - Market size and forecast 2024-2029 ($ million)
- Exhibits59: Data Table on Composting and anaerobic digestion - Market size and forecast 2024-2029 ($ million)
- Exhibits60: Chart on Composting and anaerobic digestion - Year-over-year growth 2024-2029 (%)
- Exhibits61: Data Table on Composting and anaerobic digestion - Year-over-year growth 2024-2029 (%)
- Exhibits62: Market opportunity by Service Type ($ million)
- Exhibits63: Data Table on Market opportunity by Service Type ($ million)
- Exhibits64: Chart on Material - Market share 2024-2029 (%)
- Exhibits65: Data Table on Material - Market share 2024-2029 (%)
- Exhibits66: Chart on Comparison by Material
- Exhibits67: Data Table on Comparison by Material
- Exhibits68: Chart on Natural fibers - Market size and forecast 2024-2029 ($ million)
- Exhibits69: Data Table on Natural fibers - Market size and forecast 2024-2029 ($ million)
- Exhibits70: Chart on Natural fibers - Year-over-year growth 2024-2029 (%)
- Exhibits71: Data Table on Natural fibers - Year-over-year growth 2024-2029 (%)
- Exhibits72: Chart on Synthetic fibers - Market size and forecast 2024-2029 ($ million)
- Exhibits73: Data Table on Synthetic fibers - Market size and forecast 2024-2029 ($ million)
- Exhibits74: Chart on Synthetic fibers - Year-over-year growth 2024-2029 (%)
- Exhibits75: Data Table on Synthetic fibers - Year-over-year growth 2024-2029 (%)
- Exhibits76: Chart on Blended fabrics - Market size and forecast 2024-2029 ($ million)
- Exhibits77: Data Table on Blended fabrics - Market size and forecast 2024-2029 ($ million)
- Exhibits78: Chart on Blended fabrics - Year-over-year growth 2024-2029 (%)
- Exhibits79: Data Table on Blended fabrics - Year-over-year growth 2024-2029 (%)
- Exhibits80: Market opportunity by Material ($ million)
- Exhibits81: Data Table on Market opportunity by Material ($ million)
- Exhibits82: Chart on Type - Market share 2024-2029 (%)
- Exhibits83: Data Table on Type - Market share 2024-2029 (%)
- Exhibits84: Chart on Comparison by Type
- Exhibits85: Data Table on Comparison by Type
- Exhibits86: Chart on Hazardous - Market size and forecast 2024-2029 ($ million)
- Exhibits87: Data Table on Hazardous - Market size and forecast 2024-2029 ($ million)
- Exhibits88: Chart on Hazardous - Year-over-year growth 2024-2029 (%)
- Exhibits89: Data Table on Hazardous - Year-over-year growth 2024-2029 (%)
- Exhibits90: Chart on Plastic - Market size and forecast 2024-2029 ($ million)
- Exhibits91: Data Table on Plastic - Market size and forecast 2024-2029 ($ million)
- Exhibits92: Chart on Plastic - Year-over-year growth 2024-2029 (%)
- Exhibits93: Data Table on Plastic - Year-over-year growth 2024-2029 (%)
- Exhibits94: Chart on Polyester - Market size and forecast 2024-2029 ($ million)
- Exhibits95: Data Table on Polyester - Market size and forecast 2024-2029 ($ million)
- Exhibits96: Chart on Polyester - Year-over-year growth 2024-2029 (%)
- Exhibits97: Data Table on Polyester - Year-over-year growth 2024-2029 (%)
- Exhibits98: Chart on Others - Market size and forecast 2024-2029 ($ million)
- Exhibits99: Data Table on Others - Market size and forecast 2024-2029 ($ million)
- Exhibits100: Chart on Others - Year-over-year growth 2024-2029 (%)
- Exhibits101: Data Table on Others - Year-over-year growth 2024-2029 (%)
- Exhibits102: Market opportunity by Type ($ million)
- Exhibits103: Data Table on Market opportunity by Type ($ million)
- Exhibits104: Analysis of price sensitivity, lifecycle, customer purchase basket, adoption rates, and purchase criteria
- Exhibits105: Chart on Market share By Geographical Landscape 2024-2029 (%)
- Exhibits106: Data Table on Market share By Geographical Landscape 2024-2029 (%)
- Exhibits107: Chart on Geographic comparison
- Exhibits108: Data Table on Geographic comparison
- Exhibits109: Chart on APAC - Market size and forecast 2024-2029 ($ million)
- Exhibits110: Data Table on APAC - Market size and forecast 2024-2029 ($ million)
- Exhibits111: Chart on APAC - Year-over-year growth 2024-2029 (%)
- Exhibits112: Data Table on APAC - Year-over-year growth 2024-2029 (%)
- Exhibits113: Chart on North America - Market size and forecast 2024-2029 ($ million)
- Exhibits114: Data Table on North America - Market size and forecast 2024-2029 ($ million)
- Exhibits115: Chart on North America - Year-over-year growth 2024-2029 (%)
- Exhibits116: Data Table on North America - Year-over-year growth 2024-2029 (%)
- Exhibits117: Chart on Europe - Market size and forecast 2024-2029 ($ million)
- Exhibits118: Data Table on Europe - Market size and forecast 2024-2029 ($ million)
- Exhibits119: Chart on Europe - Year-over-year growth 2024-2029 (%)
- Exhibits120: Data Table on Europe - Year-over-year growth 2024-2029 (%)
- Exhibits121: Chart on Middle East and Africa - Market size and forecast 2024-2029 ($ million)
- Exhibits122: Data Table on Middle East and Africa - Market size and forecast 2024-2029 ($ million)
- Exhibits123: Chart on Middle East and Africa - Year-over-year growth 2024-2029 (%)
- Exhibits124: Data Table on Middle East and Africa - Year-over-year growth 2024-2029 (%)
- Exhibits125: Chart on South America - Market size and forecast 2024-2029 ($ million)
- Exhibits126: Data Table on South America - Market size and forecast 2024-2029 ($ million)
- Exhibits127: Chart on South America - Year-over-year growth 2024-2029 (%)
- Exhibits128: Data Table on South America - Year-over-year growth 2024-2029 (%)
- Exhibits129: Chart on US - Market size and forecast 2024-2029 ($ million)
- Exhibits130: Data Table on US - Market size and forecast 2024-2029 ($ million)
- Exhibits131: Chart on US - Year-over-year growth 2024-2029 (%)
- Exhibits132: Data Table on US - Year-over-year growth 2024-2029 (%)
- Exhibits133: Chart on China - Market size and forecast 2024-2029 ($ million)
- Exhibits134: Data Table on China - Market size and forecast 2024-2029 ($ million)
- Exhibits135: Chart on China - Year-over-year growth 2024-2029 (%)
- Exhibits136: Data Table on China - Year-over-year growth 2024-2029 (%)
- Exhibits137: Chart on Japan - Market size and forecast 2024-2029 ($ million)
- Exhibits138: Data Table on Japan - Market size and forecast 2024-2029 ($ million)
- Exhibits139: Chart on Japan - Year-over-year growth 2024-2029 (%)
- Exhibits140: Data Table on Japan - Year-over-year growth 2024-2029 (%)
- Exhibits141: Chart on India - Market size and forecast 2024-2029 ($ million)
- Exhibits142: Data Table on India - Market size and forecast 2024-2029 ($ million)
- Exhibits143: Chart on India - Year-over-year growth 2024-2029 (%)
- Exhibits144: Data Table on India - Year-over-year growth 2024-2029 (%)
- Exhibits145: Chart on South Korea - Market size and forecast 2024-2029 ($ million)
- Exhibits146: Data Table on South Korea - Market size and forecast 2024-2029 ($ million)
- Exhibits147: Chart on South Korea - Year-over-year growth 2024-2029 (%)
- Exhibits148: Data Table on South Korea - Year-over-year growth 2024-2029 (%)
- Exhibits149: Chart on Canada - Market size and forecast 2024-2029 ($ million)
- Exhibits150: Data Table on Canada - Market size and forecast 2024-2029 ($ million)
- Exhibits151: Chart on Canada - Year-over-year growth 2024-2029 (%)
- Exhibits152: Data Table on Canada - Year-over-year growth 2024-2029 (%)
- Exhibits153: Chart on UK - Market size and forecast 2024-2029 ($ million)
- Exhibits154: Data Table on UK - Market size and forecast 2024-2029 ($ million)
- Exhibits155: Chart on UK - Year-over-year growth 2024-2029 (%)
- Exhibits156: Data Table on UK - Year-over-year growth 2024-2029 (%)
- Exhibits157: Chart on Germany - Market size and forecast 2024-2029 ($ million)
- Exhibits158: Data Table on Germany - Market size and forecast 2024-2029 ($ million)
- Exhibits159: Chart on Germany - Year-over-year growth 2024-2029 (%)
- Exhibits160: Data Table on Germany - Year-over-year growth 2024-2029 (%)
- Exhibits161: Chart on Australia - Market size and forecast 2024-2029 ($ million)
- Exhibits162: Data Table on Australia - Market size and forecast 2024-2029 ($ million)
- Exhibits163: Chart on Australia - Year-over-year growth 2024-2029 (%)
- Exhibits164: Data Table on Australia - Year-over-year growth 2024-2029 (%)
- Exhibits165: Chart on France - Market size and forecast 2024-2029 ($ million)
- Exhibits166: Data Table on France - Market size and forecast 2024-2029 ($ million)
- Exhibits167: Chart on France - Year-over-year growth 2024-2029 (%)
- Exhibits168: Data Table on France - Year-over-year growth 2024-2029 (%)
- Exhibits169: Market opportunity By Geographical Landscape ($ million)
- Exhibits170: Data Tables on Market opportunity By Geographical Landscape ($ million)
- Exhibits171: Impact of drivers and challenges in 2024 and 2029
- Exhibits172: Overview on criticality of inputs and factors of differentiation
- Exhibits173: Overview on factors of disruption
- Exhibits174: Impact of key risks on business
- Exhibits175: Companies covered
- Exhibits176: Company ranking index
- Exhibits177: Matrix on companies position and classification
- Exhibits178: Aditya Birla Management Corp. Pvt. Ltd. - Overview
- Exhibits179: Aditya Birla Management Corp. Pvt. Ltd. - Product / Service
- Exhibits180: Aditya Birla Management Corp. Pvt. Ltd. - Key news
- Exhibits181: Aditya Birla Management Corp. Pvt. Ltd. - Key offerings
- Exhibits182: SWOT
- Exhibits183: BLS Ecotech Ltd. - Overview
- Exhibits184: BLS Ecotech Ltd. - Product / Service
- Exhibits185: BLS Ecotech Ltd. - Key offerings
- Exhibits186: SWOT
- Exhibits187: Boer Group - Overview
- Exhibits188: Boer Group - Product / Service
- Exhibits189: Boer Group - Key offerings
- Exhibits190: SWOT
- Exhibits191: Evrnu Inc. - Overview
- Exhibits192: Evrnu Inc. - Product / Service
- Exhibits193: Evrnu Inc. - Key offerings
- Exhibits194: SWOT
- Exhibits195: FABSCRAP - Overview
- Exhibits196: FABSCRAP - Product / Service
- Exhibits197: FABSCRAP - Key offerings
- Exhibits198: SWOT
- Exhibits199: Infinited Fiber Co. - Overview
- Exhibits200: Infinited Fiber Co. - Product / Service
- Exhibits201: Infinited Fiber Co. - Key offerings
- Exhibits202: SWOT
- Exhibits203: Lenzing AG - Overview
- Exhibits204: Lenzing AG - Business segments
- Exhibits205: Lenzing AG - Key offerings
- Exhibits206: Lenzing AG - Segment focus
- Exhibits207: SWOT
- Exhibits208: PROCOTEX BELGIUM SA - Overview
- Exhibits209: PROCOTEX BELGIUM SA - Product / Service
- Exhibits210: PROCOTEX BELGIUM SA - Key offerings
- Exhibits211: SWOT
- Exhibits212: Pure Waste Textiles Oy - Overview
- Exhibits213: Pure Waste Textiles Oy - Product / Service
- Exhibits214: Pure Waste Textiles Oy - Key offerings
- Exhibits215: SWOT
- Exhibits216: Re NewCell AB - Overview
- Exhibits217: Re NewCell AB - Product / Service
- Exhibits218: Re NewCell AB - Key offerings
- Exhibits219: SWOT
- Exhibits220: Recover Textile Systems S.L - Overview
- Exhibits221: Recover Textile Systems S.L - Product / Service
- Exhibits222: Recover Textile Systems S.L - Key offerings
- Exhibits223: SWOT
- Exhibits224: Remondis SE and Co. KG - Overview
- Exhibits225: Remondis SE and Co. KG - Product / Service
- Exhibits226: Remondis SE and Co. KG - Key offerings
- Exhibits227: SWOT
- Exhibits228: SAAHAS WASTE MANAGEMENT Pvt. Ltd. - Overview
- Exhibits229: SAAHAS WASTE MANAGEMENT Pvt. Ltd. - Product / Service
- Exhibits230: SAAHAS WASTE MANAGEMENT Pvt. Ltd. - Key offerings
- Exhibits231: SWOT
- Exhibits232: TEXAID Textilverwertungs AG - Overview
- Exhibits233: TEXAID Textilverwertungs AG - Product / Service
- Exhibits234: TEXAID Textilverwertungs AG - Key offerings
- Exhibits235: SWOT
- Exhibits236: Veolia Environnement SA - Overview
- Exhibits237: Veolia Environnement SA - Business segments
- Exhibits238: Veolia Environnement SA - Key offerings
- Exhibits239: Veolia Environnement SA - Segment focus
- Exhibits240: SWOT
- Exhibits241: Inclusions checklist
- Exhibits242: Exclusions checklist
- Exhibits243: Currency conversion rates for US$
- Exhibits244: Research methodology
- Exhibits245: Information sources
- Exhibits246: Data validation
- Exhibits247: Validation techniques employed for market sizing
- Exhibits248: Data synthesis
- Exhibits249: 360 degree market analysis
- Exhibits250: List of abbreviations
The textile industry waste management market is forecasted to grow by USD 4495.6 mn during 2024-2029, accelerating at a CAGR of 17.8% during the forecast period. The report on the textile industry waste management market provides a holistic analysis, market size and forecast, trends, growth drivers, and challenges, as well as vendor analysis covering around 25 vendors.
The report offers an up-to-date analysis regarding the current market scenario, the latest trends and drivers, and the overall market environment. The market is driven by increasing awareness about sustainability and environmental protection, increasing regulations and laws related to waste management, and growing demand for eco-friendly and recycled textile products from consumers.
| Market Scope | |
|---|---|
| Base Year | 2025 |
| End Year | 2029 |
| Series Year | 2025-2029 |
| Growth Momentum | Accelerate |
| YOY 2025 | 12.8% |
| CAGR | 17.8% |
| Incremental Value | $4495.6 mn |
The study was conducted using an objective combination of primary and secondary information including inputs from key participants in the industry. The report contains a comprehensive market size data, segment with regional analysis and vendor landscape in addition to an analysis of the key companies. Reports have historic and forecast data.
Technavio's textile industry waste management market is segmented as below:
By Service Type
- Landfill
- Open dumping
- Incineration
- Recycling
- Composting and anaerobic digestion
By Material
- Natural fibers
- Synthetic fibers
- Blended fabrics
By Type
- Hazardous
- Plastic
- Polyester
- Others
By Geographical Landscape
- APAC
- North America
- Europe
- Middle East and Africa
- South America
This study identifies the integration of ai and iot enabling better monitoring and reduction of textile waste as one of the prime reasons driving the textile industry waste management market growth during the next few years. Also, adoption of circular economy models leading to recycling and reuse of textile waste and use of biodegradable and compostable materials in textile production minimizes waste generation will lead to sizable demand in the market.
The report on the textile industry waste management market covers the following areas:
- Textile Industry Waste Management Market sizing
- Textile Industry Waste Management Market forecast
- Textile Industry Waste Management Market industry analysis
The robust vendor analysis is designed to help clients improve their market position, and in line with this, this report provides a detailed analysis of several leading textile industry waste management market vendors that include Aditya Birla Management Corp. Pvt. Ltd., BLS Ecotech Ltd., Boer Group, Evrnu Inc., FABSCRAP, Infinited Fiber Co., Lenzing AG, PROCOTEX BELGIUM SA, Pure Waste Textiles Oy, Re NewCell AB, Recover Textile Systems S.L, Remondis SE and Co. KG, SAAHAS WASTE MANAGEMENT Pvt. Ltd., TEXAID Textilverwertungs AG, Unifi Inc., Veolia Environnement SA, and Worn Again Technologies. Also, the textile industry waste management market analysis report includes information on upcoming trends and challenges that will influence market growth. This is to help companies strategize and leverage all forthcoming growth opportunities.
The publisher presents a detailed picture of the market by the way of study, synthesis, and summation of data from multiple sources by an analysis of key parameters such as profit, pricing, competition, and promotions. It presents various market facets by identifying the key industry influencers. The data presented is comprehensive, reliable, and a result of extensive primary and secondary research. The market research reports provide a complete competitive landscape and an in-depth vendor selection methodology and analysis using qualitative and quantitative research to forecast accurate market growth.
Table of Contents
1 Executive Summary
- 1.1 Market overview
- Executive Summary - Chart on Market Overview
- Executive Summary - Data Table on Market Overview
- Executive Summary - Chart on Global Market Characteristics
- Executive Summary - Chart on Market By Geographical Landscape
- Executive Summary - Chart on Market Segmentation by Service Type
- Executive Summary - Chart on Market Segmentation by Material
- Executive Summary - Chart on Market Segmentation by Type
- Executive Summary - Chart on Incremental Growth
- Executive Summary - Data Table on Incremental Growth
- Executive Summary - Chart on Company Market Positioning
2 Technavio Analysis
- 2.1 Analysis of price sensitivity, lifecycle, customer purchase basket, adoption rates, and purchase criteria
- Analysis of price sensitivity, lifecycle, customer purchase basket, adoption rates, and purchase criteria
- 2.2 Criticality of inputs and Factors of differentiation
- Overview on criticality of inputs and factors of differentiation
- 2.3 Factors of disruption
- Overview on factors of disruption
- 2.4 Impact of drivers and challenges
- Impact of drivers and challenges in 2024 and 2029
3 Market Landscape
- 3.1 Market ecosystem
- Parent Market
- Data Table on - Parent Market
- 3.2 Market characteristics
- Market characteristics analysis
- 3.3 Value chain analysis
- Value chain analysis
4 Market Sizing
- 4.1 Market definition
- Offerings of companies included in the market definition
- 4.2 Market segment analysis
- Market segments
- 4.3 Market size 2024
- 4.4 Market outlook: Forecast for 2024-2029
- Chart on Global - Market size and forecast 2024-2029 ($ million)
- Data Table on Global - Market size and forecast 2024-2029 ($ million)
- Chart on Global Market: Year-over-year growth 2024-2029 (%)
- Data Table on Global Market: Year-over-year growth 2024-2029 (%)
5 Historic Market Size
- 5.1 Global Textile Industry Waste Management Market 2019 - 2023
- Historic Market Size - Data Table on Global Textile Industry Waste Management Market 2019 - 2023 ($ million)
- 5.2 Service Type segment analysis 2019 - 2023
- Historic Market Size - Service Type Segment 2019 - 2023 ($ million)
- 5.3 Material segment analysis 2019 - 2023
- Historic Market Size - Material Segment 2019 - 2023 ($ million)
- 5.4 Type segment analysis 2019 - 2023
- Historic Market Size - Type Segment 2019 - 2023 ($ million)
- 5.5 Geography segment analysis 2019 - 2023
- Historic Market Size - Geography Segment 2019 - 2023 ($ million)
- 5.6 Country segment analysis 2019 - 2023
- Historic Market Size - Country Segment 2019 - 2023 ($ million)
6 Qualitative Analysis
- 6.1 Impact of AI on the Global Textile Industry Waste Management Market
7 Five Forces Analysis
- 7.1 Five forces summary
- Five forces analysis - Comparison between 2024 and 2029
- 7.2 Bargaining power of buyers
- Bargaining power of buyers - Impact of key factors 2024 and 2029
- 7.3 Bargaining power of suppliers
- Bargaining power of suppliers - Impact of key factors in 2024 and 2029
- 7.4 Threat of new entrants
- Threat of new entrants - Impact of key factors in 2024 and 2029
- 7.5 Threat of substitutes
- Threat of substitutes - Impact of key factors in 2024 and 2029
- 7.6 Threat of rivalry
- Threat of rivalry - Impact of key factors in 2024 and 2029
- 7.7 Market condition
- Chart on Market condition - Five forces 2024 and 2029
8 Market Segmentation by Service Type
- 8.1 Market segments
- Chart on Service Type - Market share 2024-2029 (%)
- Data Table on Service Type - Market share 2024-2029 (%)
- 8.2 Comparison by Service Type
- Chart on Comparison by Service Type
- Data Table on Comparison by Service Type
- 8.3 Landfill - Market size and forecast 2024-2029
- Chart on Landfill - Market size and forecast 2024-2029 ($ million)
- Data Table on Landfill - Market size and forecast 2024-2029 ($ million)
- Chart on Landfill - Year-over-year growth 2024-2029 (%)
- Data Table on Landfill - Year-over-year growth 2024-2029 (%)
- 8.4 Open dumping - Market size and forecast 2024-2029
- Chart on Open dumping - Market size and forecast 2024-2029 ($ million)
- Data Table on Open dumping - Market size and forecast 2024-2029 ($ million)
- Chart on Open dumping - Year-over-year growth 2024-2029 (%)
- Data Table on Open dumping - Year-over-year growth 2024-2029 (%)
- 8.5 Incineration - Market size and forecast 2024-2029
- Chart on Incineration - Market size and forecast 2024-2029 ($ million)
- Data Table on Incineration - Market size and forecast 2024-2029 ($ million)
- Chart on Incineration - Year-over-year growth 2024-2029 (%)
- Data Table on Incineration - Year-over-year growth 2024-2029 (%)
- 8.6 Recycling - Market size and forecast 2024-2029
- Chart on Recycling - Market size and forecast 2024-2029 ($ million)
- Data Table on Recycling - Market size and forecast 2024-2029 ($ million)
- Chart on Recycling - Year-over-year growth 2024-2029 (%)
- Data Table on Recycling - Year-over-year growth 2024-2029 (%)
- 8.7 Composting and anaerobic digestion - Market size and forecast 2024-2029
- Chart on Composting and anaerobic digestion - Market size and forecast 2024-2029 ($ million)
- Data Table on Composting and anaerobic digestion - Market size and forecast 2024-2029 ($ million)
- Chart on Composting and anaerobic digestion - Year-over-year growth 2024-2029 (%)
- Data Table on Composting and anaerobic digestion - Year-over-year growth 2024-2029 (%)
- 8.8 Market opportunity by Service Type
- Market opportunity by Service Type ($ million)
- Data Table on Market opportunity by Service Type ($ million)
9 Market Segmentation by Material
- 9.1 Market segments
- Chart on Material - Market share 2024-2029 (%)
- Data Table on Material - Market share 2024-2029 (%)
- 9.2 Comparison by Material
- Chart on Comparison by Material
- Data Table on Comparison by Material
- 9.3 Natural fibers - Market size and forecast 2024-2029
- Chart on Natural fibers - Market size and forecast 2024-2029 ($ million)
- Data Table on Natural fibers - Market size and forecast 2024-2029 ($ million)
- Chart on Natural fibers - Year-over-year growth 2024-2029 (%)
- Data Table on Natural fibers - Year-over-year growth 2024-2029 (%)
- 9.4 Synthetic fibers - Market size and forecast 2024-2029
- Chart on Synthetic fibers - Market size and forecast 2024-2029 ($ million)
- Data Table on Synthetic fibers - Market size and forecast 2024-2029 ($ million)
- Chart on Synthetic fibers - Year-over-year growth 2024-2029 (%)
- Data Table on Synthetic fibers - Year-over-year growth 2024-2029 (%)
- 9.5 Blended fabrics - Market size and forecast 2024-2029
- Chart on Blended fabrics - Market size and forecast 2024-2029 ($ million)
- Data Table on Blended fabrics - Market size and forecast 2024-2029 ($ million)
- Chart on Blended fabrics - Year-over-year growth 2024-2029 (%)
- Data Table on Blended fabrics - Year-over-year growth 2024-2029 (%)
- 9.6 Market opportunity by Material
- Market opportunity by Material ($ million)
- Data Table on Market opportunity by Material ($ million)
10 Market Segmentation by Type
- 10.1 Market segments
- Chart on Type - Market share 2024-2029 (%)
- Data Table on Type - Market share 2024-2029 (%)
- 10.2 Comparison by Type
- Chart on Comparison by Type
- Data Table on Comparison by Type
- 10.3 Hazardous - Market size and forecast 2024-2029
- Chart on Hazardous - Market size and forecast 2024-2029 ($ million)
- Data Table on Hazardous - Market size and forecast 2024-2029 ($ million)
- Chart on Hazardous - Year-over-year growth 2024-2029 (%)
- Data Table on Hazardous - Year-over-year growth 2024-2029 (%)
- 10.4 Plastic - Market size and forecast 2024-2029
- Chart on Plastic - Market size and forecast 2024-2029 ($ million)
- Data Table on Plastic - Market size and forecast 2024-2029 ($ million)
- Chart on Plastic - Year-over-year growth 2024-2029 (%)
- Data Table on Plastic - Year-over-year growth 2024-2029 (%)
- 10.5 Polyester - Market size and forecast 2024-2029
- Chart on Polyester - Market size and forecast 2024-2029 ($ million)
- Data Table on Polyester - Market size and forecast 2024-2029 ($ million)
- Chart on Polyester - Year-over-year growth 2024-2029 (%)
- Data Table on Polyester - Year-over-year growth 2024-2029 (%)
- 10.6 Others - Market size and forecast 2024-2029
- Chart on Others - Market size and forecast 2024-2029 ($ million)
- Data Table on Others - Market size and forecast 2024-2029 ($ million)
- Chart on Others - Year-over-year growth 2024-2029 (%)
- Data Table on Others - Year-over-year growth 2024-2029 (%)
- 10.7 Market opportunity by Type
- Market opportunity by Type ($ million)
- Data Table on Market opportunity by Type ($ million)
11 Customer Landscape
- 11.1 Customer landscape overview
- Analysis of price sensitivity, lifecycle, customer purchase basket, adoption rates, and purchase criteria
12 Geographic Landscape
- 12.1 Geographic segmentation
- Chart on Market share By Geographical Landscape 2024-2029 (%)
- Data Table on Market share By Geographical Landscape 2024-2029 (%)
- 12.2 Geographic comparison
- Chart on Geographic comparison
- Data Table on Geographic comparison
- 12.3 APAC - Market size and forecast 2024-2029
- Chart on APAC - Market size and forecast 2024-2029 ($ million)
- Data Table on APAC - Market size and forecast 2024-2029 ($ million)
- Chart on APAC - Year-over-year growth 2024-2029 (%)
- Data Table on APAC - Year-over-year growth 2024-2029 (%)
- 12.4 North America - Market size and forecast 2024-2029
- Chart on North America - Market size and forecast 2024-2029 ($ million)
- Data Table on North America - Market size and forecast 2024-2029 ($ million)
- Chart on North America - Year-over-year growth 2024-2029 (%)
- Data Table on North America - Year-over-year growth 2024-2029 (%)
- 12.5 Europe - Market size and forecast 2024-2029
- Chart on Europe - Market size and forecast 2024-2029 ($ million)
- Data Table on Europe - Market size and forecast 2024-2029 ($ million)
- Chart on Europe - Year-over-year growth 2024-2029 (%)
- Data Table on Europe - Year-over-year growth 2024-2029 (%)
- 12.6 Middle East and Africa - Market size and forecast 2024-2029
- Chart on Middle East and Africa - Market size and forecast 2024-2029 ($ million)
- Data Table on Middle East and Africa - Market size and forecast 2024-2029 ($ million)
- Chart on Middle East and Africa - Year-over-year growth 2024-2029 (%)
- Data Table on Middle East and Africa - Year-over-year growth 2024-2029 (%)
- 12.7 South America - Market size and forecast 2024-2029
- Chart on South America - Market size and forecast 2024-2029 ($ million)
- Data Table on South America - Market size and forecast 2024-2029 ($ million)
- Chart on South America - Year-over-year growth 2024-2029 (%)
- Data Table on South America - Year-over-year growth 2024-2029 (%)
- 12.8 US - Market size and forecast 2024-2029
- Chart on US - Market size and forecast 2024-2029 ($ million)
- Data Table on US - Market size and forecast 2024-2029 ($ million)
- Chart on US - Year-over-year growth 2024-2029 (%)
- Data Table on US - Year-over-year growth 2024-2029 (%)
- 12.9 China - Market size and forecast 2024-2029
- Chart on China - Market size and forecast 2024-2029 ($ million)
- Data Table on China - Market size and forecast 2024-2029 ($ million)
- Chart on China - Year-over-year growth 2024-2029 (%)
- Data Table on China - Year-over-year growth 2024-2029 (%)
- 12.10 Japan - Market size and forecast 2024-2029
- Chart on Japan - Market size and forecast 2024-2029 ($ million)
- Data Table on Japan - Market size and forecast 2024-2029 ($ million)
- Chart on Japan - Year-over-year growth 2024-2029 (%)
- Data Table on Japan - Year-over-year growth 2024-2029 (%)
- 12.11 India - Market size and forecast 2024-2029
- Chart on India - Market size and forecast 2024-2029 ($ million)
- Data Table on India - Market size and forecast 2024-2029 ($ million)
- Chart on India - Year-over-year growth 2024-2029 (%)
- Data Table on India - Year-over-year growth 2024-2029 (%)
- 12.12 South Korea - Market size and forecast 2024-2029
- Chart on South Korea - Market size and forecast 2024-2029 ($ million)
- Data Table on South Korea - Market size and forecast 2024-2029 ($ million)
- Chart on South Korea - Year-over-year growth 2024-2029 (%)
- Data Table on South Korea - Year-over-year growth 2024-2029 (%)
- 12.13 Canada - Market size and forecast 2024-2029
- Chart on Canada - Market size and forecast 2024-2029 ($ million)
- Data Table on Canada - Market size and forecast 2024-2029 ($ million)
- Chart on Canada - Year-over-year growth 2024-2029 (%)
- Data Table on Canada - Year-over-year growth 2024-2029 (%)
- 12.14 UK - Market size and forecast 2024-2029
- Chart on UK - Market size and forecast 2024-2029 ($ million)
- Data Table on UK - Market size and forecast 2024-2029 ($ million)
- Chart on UK - Year-over-year growth 2024-2029 (%)
- Data Table on UK - Year-over-year growth 2024-2029 (%)
- 12.15 Germany - Market size and forecast 2024-2029
- Chart on Germany - Market size and forecast 2024-2029 ($ million)
- Data Table on Germany - Market size and forecast 2024-2029 ($ million)
- Chart on Germany - Year-over-year growth 2024-2029 (%)
- Data Table on Germany - Year-over-year growth 2024-2029 (%)
- 12.16 Australia - Market size and forecast 2024-2029
- Chart on Australia - Market size and forecast 2024-2029 ($ million)
- Data Table on Australia - Market size and forecast 2024-2029 ($ million)
- Chart on Australia - Year-over-year growth 2024-2029 (%)
- Data Table on Australia - Year-over-year growth 2024-2029 (%)
- 12.17 France - Market size and forecast 2024-2029
- Chart on France - Market size and forecast 2024-2029 ($ million)
- Data Table on France - Market size and forecast 2024-2029 ($ million)
- Chart on France - Year-over-year growth 2024-2029 (%)
- Data Table on France - Year-over-year growth 2024-2029 (%)
- 12.18 Market opportunity By Geographical Landscape
- Market opportunity By Geographical Landscape ($ million)
- Data Tables on Market opportunity By Geographical Landscape ($ million)
13 Drivers, Challenges, and Opportunity/Restraints
- 13.1 Market drivers
- 13.2 Market challenges
- 13.3 Impact of drivers and challenges
- Impact of drivers and challenges in 2024 and 2029
- 13.4 Market opportunities/restraints
14 Competitive Landscape
- 14.1 Overview
- 14.2 Competitive Landscape
- Overview on criticality of inputs and factors of differentiation
- 14.3 Landscape disruption
- Overview on factors of disruption
- 14.4 Industry risks
- Impact of key risks on business
15 Competitive Analysis
- 15.1 Companies profiled
- Companies covered
- 15.2 Company ranking index
- Company ranking index
- 15.3 Market positioning of companies
- Matrix on companies position and classification
- 15.4 Aditya Birla Management Corp. Pvt. Ltd.
- Aditya Birla Management Corp. Pvt. Ltd. - Overview
- Aditya Birla Management Corp. Pvt. Ltd. - Product / Service
- Aditya Birla Management Corp. Pvt. Ltd. - Key news
- Aditya Birla Management Corp. Pvt. Ltd. - Key offerings
- SWOT
- 15.5 BLS Ecotech Ltd.
- BLS Ecotech Ltd. - Overview
- BLS Ecotech Ltd. - Product / Service
- BLS Ecotech Ltd. - Key offerings
- SWOT
- 15.6 Boer Group
- Boer Group - Overview
- Boer Group - Product / Service
- Boer Group - Key offerings
- SWOT
- 15.7 Evrnu Inc.
- Evrnu Inc. - Overview
- Evrnu Inc. - Product / Service
- Evrnu Inc. - Key offerings
- SWOT
- 15.8 FABSCRAP
- FABSCRAP - Overview
- FABSCRAP - Product / Service
- FABSCRAP - Key offerings
- SWOT
- 15.9 Infinited Fiber Co.
- Infinited Fiber Co. - Overview
- Infinited Fiber Co. - Product / Service
- Infinited Fiber Co. - Key offerings
- SWOT
- 15.10 Lenzing AG
- Lenzing AG - Overview
- Lenzing AG - Business segments
- Lenzing AG - Key offerings
- Lenzing AG - Segment focus
- SWOT
- 15.11 PROCOTEX BELGIUM SA
- PROCOTEX BELGIUM SA - Overview
- PROCOTEX BELGIUM SA - Product / Service
- PROCOTEX BELGIUM SA - Key offerings
- SWOT
- 15.12 Pure Waste Textiles Oy
- Pure Waste Textiles Oy - Overview
- Pure Waste Textiles Oy - Product / Service
- Pure Waste Textiles Oy - Key offerings
- SWOT
- 15.13 Re NewCell AB
- Re NewCell AB - Overview
- Re NewCell AB - Product / Service
- Re NewCell AB - Key offerings
- SWOT
- 15.14 Recover Textile Systems S.L
- Recover Textile Systems S.L - Overview
- Recover Textile Systems S.L - Product / Service
- Recover Textile Systems S.L - Key offerings
- SWOT
- 15.15 Remondis SE and Co. KG
- Remondis SE and Co. KG - Overview
- Remondis SE and Co. KG - Product / Service
- Remondis SE and Co. KG - Key offerings
- SWOT
- 15.16 SAAHAS WASTE MANAGEMENT Pvt. Ltd.
- SAAHAS WASTE MANAGEMENT Pvt. Ltd. - Overview
- SAAHAS WASTE MANAGEMENT Pvt. Ltd. - Product / Service
- SAAHAS WASTE MANAGEMENT Pvt. Ltd. - Key offerings
- SWOT
- 15.17 TEXAID Textilverwertungs AG
- TEXAID Textilverwertungs AG - Overview
- TEXAID Textilverwertungs AG - Product / Service
- TEXAID Textilverwertungs AG - Key offerings
- SWOT
- 15.18 Veolia Environnement SA
- Veolia Environnement SA - Overview
- Veolia Environnement SA - Business segments
- Veolia Environnement SA - Key offerings
- Veolia Environnement SA - Segment focus
- SWOT
16 Appendix
- 16.1 Scope of the report
- 16.2 Inclusions and exclusions checklist
- Inclusions checklist
- Exclusions checklist
- 16.3 Currency conversion rates for US$
- Currency conversion rates for US$
- 16.4 Research methodology
- Research methodology
- 16.5 Data procurement
- Information sources
- 16.6 Data validation
- Data validation
- 16.7 Validation techniques employed for market sizing
- Validation techniques employed for market sizing
- 16.8 Data synthesis
- Data synthesis
- 16.9 360 degree market analysis
- 360 degree market analysis
- 16.10 List of abbreviations
- List of abbreviations

