|
|
市場調査レポート
商品コード
1915309
世界の質量分析計市場2026-2030年Global Mass Spectrometry Market 2026-2030 |
||||||
|
|||||||
カスタマイズ可能
|
|||||||

| 世界の質量分析計市場2026-2030年 |
|
出版日: 2026年01月19日
発行: TechNavio
ページ情報: 英文 296 Pages
納期: 即納可能
|

概要
世界の質量分析計市場は、2025年から2030年の間に27億6,270万米ドルの成長が見込まれ、予測期間中のCAGRは8.4%と予測されています。
本報告書では、世界の質量分析計市場に関する包括的な分析、市場規模と予測、動向、成長要因、課題に加え、約25社のベンダー分析を提供しております。
本レポートは、現在の市場状況、最新の動向と促進要因、市場環境全般に関する最新の分析を提供します。市場は、製薬・バイオテクノロジー分野の研究開発への投資急増、厳格な規制と食品安全・環境モニタリングへの注目の高まり、オミクス研究における採用拡大、個別化医療の進展によって牽引されています。
本調査は、業界の主要関係者からの情報を含む一次情報と二次情報を客観的に組み合わせて実施されました。本レポートには、主要企業の分析に加え、包括的な市場規模データ、地域別分析を伴うセグメント、ベンダー情勢が含まれています。レポートには過去データと予測データが掲載されています。
| 市場範囲 | |
|---|---|
| 基準年 | 2026年 |
| 終了年 | 2030年 |
| 予測期間 | 2026-2030 |
| 成長モメンタム | 加速 |
| 前年比2026年 | 8.2% |
| CAGR | 8.4% |
| 増分額 | 27億6,270万米ドル |
本調査では、今後数年間における世界の質量分析計市場の成長を牽引する主な要因の一つとして、小型化とポイント・オブ・ニーズ分析への移行を挙げております。また、データ分析やワークフロー自動化におけるAIおよび機械学習の統合、ならびに日常的な臨床診断における普及率と有効性の向上により、市場において相当な需要が見込まれます。
目次
第1章 エグゼクティブサマリー
第2章 Technavio分析
- 価格・ライフサイクル・顧客購入バスケット・採用率・購入基準の分析
- インプットの重要性と差別化の要因
- 混乱の要因
- 促進要因と課題の影響
第3章 市場情勢
- 市場エコシステム
- 市場の特徴
- バリューチェーン分析
第4章 市場規模
- 市場の定義
- 市場セグメント分析
- 市場規模 2025
- 市場の見通し 2025-2030
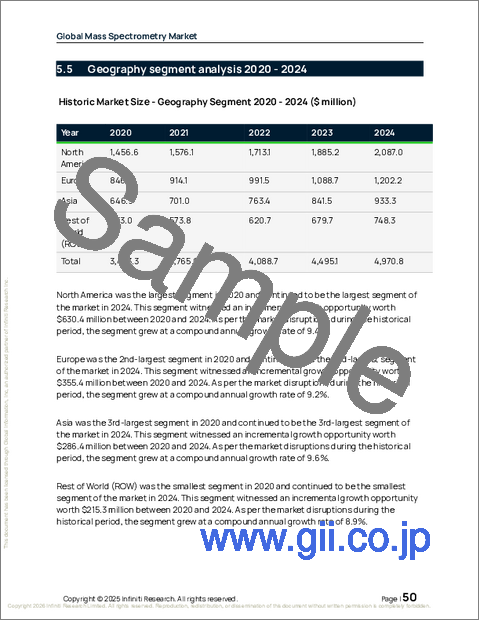
第5章 市場規模実績
- 世界の質量分析計市場 2020-2024
- エンドユーザーセグメント分析 2020-2024
- 製品セグメント分析 2020-2024
- 技術セグメント分析 2020-2024
- 地域別セグメント分析 2020-2024
- 国別セグメント分析 2020-2024
第6章 定性分析
- AIの影響:世界の質量分析計市場
第7章 ファイブフォース分析
- ファイブフォースの要約
- 買い手の交渉力
- 供給企業の交渉力
- 新規参入業者の脅威
- 代替品の脅威
- 競争の脅威
- 市況
第8章 市場セグメンテーション:エンドユーザー別
- 比較:エンドユーザー別
- 製薬・バイオテクノロジー産業
- 化学・石油化学産業
- その他
- 市場機会:エンドユーザー別
第9章 市場セグメンテーション:製品別
- 比較:製品別
- 機器
- 消耗品およびサービス
- 市場機会:製品別
第10章 市場セグメンテーション:技術別
- 比較:技術別
- QLC-MS
- GC-MS
- FT-MS
- ToFMS
- その他
- 市場機会:技術別
第11章 顧客情勢
第12章 地域別情勢
- 地域別セグメンテーション
- 地域別比較
- 北米
- 米国
- カナダ
- メキシコ
- 欧州
- ドイツ
- 英国
- フランス
- イタリア
- スペイン
- オランダ
- アジア
- 中国
- 日本
- インド
- 韓国
- インドネシア
- タイ
- 世界のその他の地域
- ブラジル
- イスラエル
- サウジアラビア
- 南アフリカ
- トルコ
- アラブ首長国連邦
- アルゼンチン
- コロンビア
- 市場機会:地域別
第13章 促進要因・課題・機会
- 市場促進要因
- 市場の課題
- 促進要因と課題の影響
- 市場機会
第14章 競合情勢
- 概要
- 競合情勢
- 混乱の状況
- 業界のリスク
第15章 競合分析
- 企業プロファイル
- 企業ランキング指標
- 企業の市場ポジショニング
- 908 Devices Inc.
- AB SCIEX LLC
- Advion Inc.
- Agilent Technologies Inc.
- Analytik Jena GmbH Co KG
- Bruker Corp.
- Hiden Analytical
- Hitachi High Tech Corp.
- JEOL Ltd.
- LECO Corp.
- PerkinElmer US LLC
- Rigaku Corp.
- Shimadzu Corp.
- Thermo Fisher Scientific Inc.
- Waters Corp.

