|
|
市場調査レポート
商品コード
1693133
スマートウェアラブル・エンターテインメント機器とサービスの世界市場 2025~2029年Global Smart Wearable Entertainment Devices and Services Market 2025-2029 |
||||||

|
|||||||
カスタマイズ可能
|
|||||||


| スマートウェアラブル・エンターテインメント機器とサービスの世界市場 2025~2029年 |
|
出版日: 2025年03月26日
発行: TechNavio
ページ情報: 英文 243 Pages
納期: 即納可能
|

全表示
- 概要
- 図表
- 目次
スマートウェアラブル・エンターテインメント機器とサービス市場は2024-2029年に253億2,270万米ドル、予測期間中のCAGRは21.9%で成長すると予測されます。
当レポートでは、スマートウェアラブル・エンターテインメント機器とサービス市場の全体的な分析、市場規模・予測、動向、成長促進要因、課題、約25のベンダーを網羅したベンダー分析などを掲載しています。
現在の市場シナリオ、最新動向と促進要因、市場環境全体に関する最新分析を提供しています。市場は、健康的なライフスタイルの利点に関する意識の高まり、世界経済のデジタル化の進展、小型化された電子部品の市場開拓によって牽引されています。
| 市場範囲 | |
|---|---|
| 基準年 | 2025 |
| 終了年 | 2029 |
| 予測期間 | 2025-2029 |
| 成長モメンタム | 加速 |
| 前年比2025年 | 17.4% |
| CAGR | 21.9% |
| 増分額 | 253億2,270万米ドル |
本調査は、業界の主要参加者からのインプットを含め、一次情報と二次情報を客観的に組み合わせて実施しました。レポートには、主要企業の分析に加え、包括的な市場規模データ、地域分析によるセグメント、ベンダー情勢が含まれています。レポートには過去データと予測データがあります。
本調査では、今後数年間のスマートウェアラブル・エンターテインメント機器とサービス市場の成長を促進する主な理由の1つとして、スポーツ分析におけるスマートウェアラブルデバイスの使用の増加を挙げています。また、有機的・無機的戦略の増加や、ローカライゼーションとマッピングの同時技術の出現は、市場の大きな需要につながるでしょう。
目次
第1章 エグゼクティブサマリー
- 市場概要
第2章 Technavio分析
- 価格・ライフサイクル・顧客購入バスケット・採用率・購入基準の分析
- インプットの重要性と差別化の要因
- 混乱の要因
- 促進要因と課題の影響
第3章 市場情勢
- 市場エコシステム
- 市場の特徴
- バリューチェーン分析
第4章 市場規模
- 市場の定義
- 市場セグメント分析
- 市場規模 2024
- 市場の見通し 2024-2029
第5章 市場規模実績
- スマートウェアラブル・エンターテインメント機器とサービスの世界市場 2019-2023
- 流通チャネルセグメント分析 2019-2023
- タイプ別セグメント分析 2019-2023
- 技術別セグメント分析 2019-2023
- 用途別セグメント分析 2019-2023
- 地域別セグメント分析 2019-2023
- 国別セグメント分析 2019-2023
第6章 定性分析
- AIの影響:スマートウェアラブル・エンターテインメント機器とサービスの世界市場
第7章 ファイブフォース分析
- ファイブフォースの要約
- 買い手の交渉力
- 供給企業の交渉力
- 新規参入業者の脅威
- 代替品の脅威
- 競争の脅威
- 市況
第8章 市場セグメンテーション:流通チャネル別
- 市場セグメント
- 比較:流通チャネル別
- オフライン:市場規模と予測 2024-2029
- オンライン:市場規模と予測 2024-2029
- 市場機会:流通チャネル別
第9章 市場セグメンテーション:タイプ別
- 市場セグメント
- 比較:タイプ別
- スマートウォッチ:市場規模と予測 2024-2029
- スマートグラス:市場規模と予測 2024-2029
- ウェアラブルゲームデバイス:市場規模と予測 2024-2029
- その他:市場規模と予測 2024-2029
- 市場機会:タイプ別
第10章 市場セグメンテーション:技術別
- 市場セグメント
- 比較:技術別
- 通信およびネットワーク技術:市場規模と予測 2024-2029
- メモリとストレージ技術:市場規模と予測 2024-2029
- 音声およびパターン認識技術:市場規模と予測 2024-2029
- コンピューティング技術:市場規模と予測 2024-2029
- その他:市場規模と予測 2024-2029
- 市場機会:技術別
第11章 市場セグメンテーション:用途別
- 市場セグメント
- 比較:用途別
- 消費者向けスマートウェアラブル:市場規模と予測 2024-2029
- フィットネスとスポーツ:市場規模と予測 2024-2029
- ヘルスケア:市場規模と予測 2024-2029
- エンタープライズおよび産業用アプリケーション:市場規模と予測 2024-2029
- 防衛:市場規模と予測 2024-2029
- 市場機会:用途別
第12章 顧客情勢
- 顧客情勢の概要
第13章 地域別情勢
- 地域別セグメンテーション
- 地域別比較
- 北米:市場規模と予測 2024-2029
- アジア太平洋:市場規模と予測 2024-2029
- 欧州:市場規模と予測 2024-2029
- 中東・アフリカ:市場規模と予測 2024-2029
- 南米:市場規模と予測 2024-2029
- 米国:市場規模と予測 2024-2029
- 中国:市場規模と予測 2024-2029
- カナダ:市場規模と予測 2024-2029
- 日本:市場規模と予測 2024-2029
- インド:市場規模と予測 2024-2029
- ドイツ:市場規模と予測 2024-2029
- 英国:市場規模と予測 2024-2029
- 韓国:市場規模と予測 2024-2029
- フランス:市場規模と予測 2024-2029
- オーストラリア:市場規模と予測 2024-2029
- 市場機会:地域情勢別
第14章 促進要因・課題・機会・抑制要因
- 市場促進要因
- 市場の課題
- 促進要因と課題の影響
- 市場の機会・抑制要因
第15章 競合情勢
- 概要
- 競合情勢
- 混乱の状況
- 業界のリスク
第16章 競合分析
- 企業プロファイル
- 企業ランキング指数
- 企業の市場ポジショニング
- Adidas AG
- Apple Inc.
- Fitbit LLC
- Fossil Group Inc.
- Garmin Ltd.
- Huawei Technologies Co. Ltd.
- Lenovo Group Ltd.
- LG Corp.
- Microsoft Corp.
- Nexxbase Marketing Pvt. Ltd.
- Samsung Electronics Co. Ltd.
- Sensoria Inc.
- Sony Group Corp.
- Vuzix Corp.
- Xiaomi Inc.
第17章 付録
Exhibits:
- Exhibits1: Executive Summary - Chart on Market Overview
- Exhibits2: Executive Summary - Data Table on Market Overview
- Exhibits3: Executive Summary - Chart on Global Market Characteristics
- Exhibits4: Executive Summary - Chart on Market By Geographical Landscape
- Exhibits5: Executive Summary - Chart on Market Segmentation by Distribution Channel
- Exhibits6: Executive Summary - Chart on Market Segmentation by Type
- Exhibits7: Executive Summary - Chart on Market Segmentation by Technology
- Exhibits8: Executive Summary - Chart on Market Segmentation by Application
- Exhibits9: Executive Summary - Chart on Incremental Growth
- Exhibits10: Executive Summary - Data Table on Incremental Growth
- Exhibits11: Executive Summary - Chart on Company Market Positioning
- Exhibits12: Analysis of price sensitivity, lifecycle, customer purchase basket, adoption rates, and purchase criteria
- Exhibits13: Overview on criticality of inputs and factors of differentiation
- Exhibits14: Overview on factors of disruption
- Exhibits15: Impact of drivers and challenges in 2024 and 2029
- Exhibits16: Parent Market
- Exhibits17: Data Table on - Parent Market
- Exhibits18: Market characteristics analysis
- Exhibits19: Value chain analysis
- Exhibits20: Offerings of companies included in the market definition
- Exhibits21: Market segments
- Exhibits22: Chart on Global - Market size and forecast 2024-2029 ($ million)
- Exhibits23: Data Table on Global - Market size and forecast 2024-2029 ($ million)
- Exhibits24: Chart on Global Market: Year-over-year growth 2024-2029 (%)
- Exhibits25: Data Table on Global Market: Year-over-year growth 2024-2029 (%)
- Exhibits26: Historic Market Size - Data Table on Global Smart Wearable Entertainment Devices And Services Market 2019 - 2023 ($ million)
- Exhibits27: Historic Market Size - Distribution Channel Segment 2019 - 2023 ($ million)
- Exhibits28: Historic Market Size - Type Segment 2019 - 2023 ($ million)
- Exhibits29: Historic Market Size - Technology Segment 2019 - 2023 ($ million)
- Exhibits30: Historic Market Size - Application Segment 2019 - 2023 ($ million)
- Exhibits31: Historic Market Size - Geography Segment 2019 - 2023 ($ million)
- Exhibits32: Historic Market Size - Country Segment 2019 - 2023 ($ million)
- Exhibits33: Five forces analysis - Comparison between 2024 and 2029
- Exhibits34: Bargaining power of buyers - Impact of key factors 2024 and 2029
- Exhibits35: Bargaining power of suppliers - Impact of key factors in 2024 and 2029
- Exhibits36: Threat of new entrants - Impact of key factors in 2024 and 2029
- Exhibits37: Threat of substitutes - Impact of key factors in 2024 and 2029
- Exhibits38: Threat of rivalry - Impact of key factors in 2024 and 2029
- Exhibits39: Chart on Market condition - Five forces 2024 and 2029
- Exhibits40: Chart on Distribution Channel - Market share 2024-2029 (%)
- Exhibits41: Data Table on Distribution Channel - Market share 2024-2029 (%)
- Exhibits42: Chart on Comparison by Distribution Channel
- Exhibits43: Data Table on Comparison by Distribution Channel
- Exhibits44: Chart on Offline - Market size and forecast 2024-2029 ($ million)
- Exhibits45: Data Table on Offline - Market size and forecast 2024-2029 ($ million)
- Exhibits46: Chart on Offline - Year-over-year growth 2024-2029 (%)
- Exhibits47: Data Table on Offline - Year-over-year growth 2024-2029 (%)
- Exhibits48: Chart on Online - Market size and forecast 2024-2029 ($ million)
- Exhibits49: Data Table on Online - Market size and forecast 2024-2029 ($ million)
- Exhibits50: Chart on Online - Year-over-year growth 2024-2029 (%)
- Exhibits51: Data Table on Online - Year-over-year growth 2024-2029 (%)
- Exhibits52: Market opportunity by Distribution Channel ($ million)
- Exhibits53: Data Table on Market opportunity by Distribution Channel ($ million)
- Exhibits54: Chart on Type - Market share 2024-2029 (%)
- Exhibits55: Data Table on Type - Market share 2024-2029 (%)
- Exhibits56: Chart on Comparison by Type
- Exhibits57: Data Table on Comparison by Type
- Exhibits58: Chart on Smartwatches - Market size and forecast 2024-2029 ($ million)
- Exhibits59: Data Table on Smartwatches - Market size and forecast 2024-2029 ($ million)
- Exhibits60: Chart on Smartwatches - Year-over-year growth 2024-2029 (%)
- Exhibits61: Data Table on Smartwatches - Year-over-year growth 2024-2029 (%)
- Exhibits62: Chart on Smart glasses - Market size and forecast 2024-2029 ($ million)
- Exhibits63: Data Table on Smart glasses - Market size and forecast 2024-2029 ($ million)
- Exhibits64: Chart on Smart glasses - Year-over-year growth 2024-2029 (%)
- Exhibits65: Data Table on Smart glasses - Year-over-year growth 2024-2029 (%)
- Exhibits66: Chart on Wearable gaming devices - Market size and forecast 2024-2029 ($ million)
- Exhibits67: Data Table on Wearable gaming devices - Market size and forecast 2024-2029 ($ million)
- Exhibits68: Chart on Wearable gaming devices - Year-over-year growth 2024-2029 (%)
- Exhibits69: Data Table on Wearable gaming devices - Year-over-year growth 2024-2029 (%)
- Exhibits70: Chart on Others - Market size and forecast 2024-2029 ($ million)
- Exhibits71: Data Table on Others - Market size and forecast 2024-2029 ($ million)
- Exhibits72: Chart on Others - Year-over-year growth 2024-2029 (%)
- Exhibits73: Data Table on Others - Year-over-year growth 2024-2029 (%)
- Exhibits74: Market opportunity by Type ($ million)
- Exhibits75: Data Table on Market opportunity by Type ($ million)
- Exhibits76: Chart on Technology - Market share 2024-2029 (%)
- Exhibits77: Data Table on Technology - Market share 2024-2029 (%)
- Exhibits78: Chart on Comparison by Technology
- Exhibits79: Data Table on Comparison by Technology
- Exhibits80: Chart on Communication and networking technology - Market size and forecast 2024-2029 ($ million)
- Exhibits81: Data Table on Communication and networking technology - Market size and forecast 2024-2029 ($ million)
- Exhibits82: Chart on Communication and networking technology - Year-over-year growth 2024-2029 (%)
- Exhibits83: Data Table on Communication and networking technology - Year-over-year growth 2024-2029 (%)
- Exhibits84: Chart on Memory and storage technology - Market size and forecast 2024-2029 ($ million)
- Exhibits85: Data Table on Memory and storage technology - Market size and forecast 2024-2029 ($ million)
- Exhibits86: Chart on Memory and storage technology - Year-over-year growth 2024-2029 (%)
- Exhibits87: Data Table on Memory and storage technology - Year-over-year growth 2024-2029 (%)
- Exhibits88: Chart on Speech and pattern recognition technology - Market size and forecast 2024-2029 ($ million)
- Exhibits89: Data Table on Speech and pattern recognition technology - Market size and forecast 2024-2029 ($ million)
- Exhibits90: Chart on Speech and pattern recognition technology - Year-over-year growth 2024-2029 (%)
- Exhibits91: Data Table on Speech and pattern recognition technology - Year-over-year growth 2024-2029 (%)
- Exhibits92: Chart on Computing technology - Market size and forecast 2024-2029 ($ million)
- Exhibits93: Data Table on Computing technology - Market size and forecast 2024-2029 ($ million)
- Exhibits94: Chart on Computing technology - Year-over-year growth 2024-2029 (%)
- Exhibits95: Data Table on Computing technology - Year-over-year growth 2024-2029 (%)
- Exhibits96: Chart on Others - Market size and forecast 2024-2029 ($ million)
- Exhibits97: Data Table on Others - Market size and forecast 2024-2029 ($ million)
- Exhibits98: Chart on Others - Year-over-year growth 2024-2029 (%)
- Exhibits99: Data Table on Others - Year-over-year growth 2024-2029 (%)
- Exhibits100: Market opportunity by Technology ($ million)
- Exhibits101: Data Table on Market opportunity by Technology ($ million)
- Exhibits102: Chart on Application - Market share 2024-2029 (%)
- Exhibits103: Data Table on Application - Market share 2024-2029 (%)
- Exhibits104: Chart on Comparison by Application
- Exhibits105: Data Table on Comparison by Application
- Exhibits106: Chart on Consumer smart wearables - Market size and forecast 2024-2029 ($ million)
- Exhibits107: Data Table on Consumer smart wearables - Market size and forecast 2024-2029 ($ million)
- Exhibits108: Chart on Consumer smart wearables - Year-over-year growth 2024-2029 (%)
- Exhibits109: Data Table on Consumer smart wearables - Year-over-year growth 2024-2029 (%)
- Exhibits110: Chart on Fitness and sports - Market size and forecast 2024-2029 ($ million)
- Exhibits111: Data Table on Fitness and sports - Market size and forecast 2024-2029 ($ million)
- Exhibits112: Chart on Fitness and sports - Year-over-year growth 2024-2029 (%)
- Exhibits113: Data Table on Fitness and sports - Year-over-year growth 2024-2029 (%)
- Exhibits114: Chart on Healthcare - Market size and forecast 2024-2029 ($ million)
- Exhibits115: Data Table on Healthcare - Market size and forecast 2024-2029 ($ million)
- Exhibits116: Chart on Healthcare - Year-over-year growth 2024-2029 (%)
- Exhibits117: Data Table on Healthcare - Year-over-year growth 2024-2029 (%)
- Exhibits118: Chart on Enterprise and industrial applications - Market size and forecast 2024-2029 ($ million)
- Exhibits119: Data Table on Enterprise and industrial applications - Market size and forecast 2024-2029 ($ million)
- Exhibits120: Chart on Enterprise and industrial applications - Year-over-year growth 2024-2029 (%)
- Exhibits121: Data Table on Enterprise and industrial applications - Year-over-year growth 2024-2029 (%)
- Exhibits122: Chart on Defense - Market size and forecast 2024-2029 ($ million)
- Exhibits123: Data Table on Defense - Market size and forecast 2024-2029 ($ million)
- Exhibits124: Chart on Defense - Year-over-year growth 2024-2029 (%)
- Exhibits125: Data Table on Defense - Year-over-year growth 2024-2029 (%)
- Exhibits126: Market opportunity by Application ($ million)
- Exhibits127: Data Table on Market opportunity by Application ($ million)
- Exhibits128: Analysis of price sensitivity, lifecycle, customer purchase basket, adoption rates, and purchase criteria
- Exhibits129: Chart on Market share By Geographical Landscape 2024-2029 (%)
- Exhibits130: Data Table on Market share By Geographical Landscape 2024-2029 (%)
- Exhibits131: Chart on Geographic comparison
- Exhibits132: Data Table on Geographic comparison
- Exhibits133: Chart on North America - Market size and forecast 2024-2029 ($ million)
- Exhibits134: Data Table on North America - Market size and forecast 2024-2029 ($ million)
- Exhibits135: Chart on North America - Year-over-year growth 2024-2029 (%)
- Exhibits136: Data Table on North America - Year-over-year growth 2024-2029 (%)
- Exhibits137: Chart on APAC - Market size and forecast 2024-2029 ($ million)
- Exhibits138: Data Table on APAC - Market size and forecast 2024-2029 ($ million)
- Exhibits139: Chart on APAC - Year-over-year growth 2024-2029 (%)
- Exhibits140: Data Table on APAC - Year-over-year growth 2024-2029 (%)
- Exhibits141: Chart on Europe - Market size and forecast 2024-2029 ($ million)
- Exhibits142: Data Table on Europe - Market size and forecast 2024-2029 ($ million)
- Exhibits143: Chart on Europe - Year-over-year growth 2024-2029 (%)
- Exhibits144: Data Table on Europe - Year-over-year growth 2024-2029 (%)
- Exhibits145: Chart on Middle East and Africa - Market size and forecast 2024-2029 ($ million)
- Exhibits146: Data Table on Middle East and Africa - Market size and forecast 2024-2029 ($ million)
- Exhibits147: Chart on Middle East and Africa - Year-over-year growth 2024-2029 (%)
- Exhibits148: Data Table on Middle East and Africa - Year-over-year growth 2024-2029 (%)
- Exhibits149: Chart on South America - Market size and forecast 2024-2029 ($ million)
- Exhibits150: Data Table on South America - Market size and forecast 2024-2029 ($ million)
- Exhibits151: Chart on South America - Year-over-year growth 2024-2029 (%)
- Exhibits152: Data Table on South America - Year-over-year growth 2024-2029 (%)
- Exhibits153: Chart on US - Market size and forecast 2024-2029 ($ million)
- Exhibits154: Data Table on US - Market size and forecast 2024-2029 ($ million)
- Exhibits155: Chart on US - Year-over-year growth 2024-2029 (%)
- Exhibits156: Data Table on US - Year-over-year growth 2024-2029 (%)
- Exhibits157: Chart on China - Market size and forecast 2024-2029 ($ million)
- Exhibits158: Data Table on China - Market size and forecast 2024-2029 ($ million)
- Exhibits159: Chart on China - Year-over-year growth 2024-2029 (%)
- Exhibits160: Data Table on China - Year-over-year growth 2024-2029 (%)
- Exhibits161: Chart on Canada - Market size and forecast 2024-2029 ($ million)
- Exhibits162: Data Table on Canada - Market size and forecast 2024-2029 ($ million)
- Exhibits163: Chart on Canada - Year-over-year growth 2024-2029 (%)
- Exhibits164: Data Table on Canada - Year-over-year growth 2024-2029 (%)
- Exhibits165: Chart on Japan - Market size and forecast 2024-2029 ($ million)
- Exhibits166: Data Table on Japan - Market size and forecast 2024-2029 ($ million)
- Exhibits167: Chart on Japan - Year-over-year growth 2024-2029 (%)
- Exhibits168: Data Table on Japan - Year-over-year growth 2024-2029 (%)
- Exhibits169: Chart on India - Market size and forecast 2024-2029 ($ million)
- Exhibits170: Data Table on India - Market size and forecast 2024-2029 ($ million)
- Exhibits171: Chart on India - Year-over-year growth 2024-2029 (%)
- Exhibits172: Data Table on India - Year-over-year growth 2024-2029 (%)
- Exhibits173: Chart on Germany - Market size and forecast 2024-2029 ($ million)
- Exhibits174: Data Table on Germany - Market size and forecast 2024-2029 ($ million)
- Exhibits175: Chart on Germany - Year-over-year growth 2024-2029 (%)
- Exhibits176: Data Table on Germany - Year-over-year growth 2024-2029 (%)
- Exhibits177: Chart on UK - Market size and forecast 2024-2029 ($ million)
- Exhibits178: Data Table on UK - Market size and forecast 2024-2029 ($ million)
- Exhibits179: Chart on UK - Year-over-year growth 2024-2029 (%)
- Exhibits180: Data Table on UK - Year-over-year growth 2024-2029 (%)
- Exhibits181: Chart on South Korea - Market size and forecast 2024-2029 ($ million)
- Exhibits182: Data Table on South Korea - Market size and forecast 2024-2029 ($ million)
- Exhibits183: Chart on South Korea - Year-over-year growth 2024-2029 (%)
- Exhibits184: Data Table on South Korea - Year-over-year growth 2024-2029 (%)
- Exhibits185: Chart on France - Market size and forecast 2024-2029 ($ million)
- Exhibits186: Data Table on France - Market size and forecast 2024-2029 ($ million)
- Exhibits187: Chart on France - Year-over-year growth 2024-2029 (%)
- Exhibits188: Data Table on France - Year-over-year growth 2024-2029 (%)
- Exhibits189: Chart on Australia - Market size and forecast 2024-2029 ($ million)
- Exhibits190: Data Table on Australia - Market size and forecast 2024-2029 ($ million)
- Exhibits191: Chart on Australia - Year-over-year growth 2024-2029 (%)
- Exhibits192: Data Table on Australia - Year-over-year growth 2024-2029 (%)
- Exhibits193: Market opportunity By Geographical Landscape ($ million)
- Exhibits194: Data Tables on Market opportunity By Geographical Landscape ($ million)
- Exhibits195: Impact of drivers and challenges in 2024 and 2029
- Exhibits196: Overview on criticality of inputs and factors of differentiation
- Exhibits197: Overview on factors of disruption
- Exhibits198: Impact of key risks on business
- Exhibits199: Companies covered
- Exhibits200: Company ranking index
- Exhibits201: Matrix on companies position and classification
- Exhibits202: Adidas AG - Overview
- Exhibits203: Adidas AG - Business segments
- Exhibits204: Adidas AG - Key news
- Exhibits205: Adidas AG - Key offerings
- Exhibits206: Adidas AG - Segment focus
- Exhibits207: SWOT
- Exhibits208: Apple Inc. - Overview
- Exhibits209: Apple Inc. - Business segments
- Exhibits210: Apple Inc. - Key news
- Exhibits211: Apple Inc. - Key offerings
- Exhibits212: Apple Inc. - Segment focus
- Exhibits213: SWOT
- Exhibits214: Fitbit LLC - Overview
- Exhibits215: Fitbit LLC - Product / Service
- Exhibits216: Fitbit LLC - Key offerings
- Exhibits217: SWOT
- Exhibits218: Fossil Group Inc. - Overview
- Exhibits219: Fossil Group Inc. - Business segments
- Exhibits220: Fossil Group Inc. - Key news
- Exhibits221: Fossil Group Inc. - Key offerings
- Exhibits222: Fossil Group Inc. - Segment focus
- Exhibits223: SWOT
- Exhibits224: Garmin Ltd. - Overview
- Exhibits225: Garmin Ltd. - Business segments
- Exhibits226: Garmin Ltd. - Key news
- Exhibits227: Garmin Ltd. - Key offerings
- Exhibits228: Garmin Ltd. - Segment focus
- Exhibits229: SWOT
- Exhibits230: Huawei Technologies Co. Ltd. - Overview
- Exhibits231: Huawei Technologies Co. Ltd. - Product / Service
- Exhibits232: Huawei Technologies Co. Ltd. - Key news
- Exhibits233: Huawei Technologies Co. Ltd. - Key offerings
- Exhibits234: SWOT
- Exhibits235: Lenovo Group Ltd. - Overview
- Exhibits236: Lenovo Group Ltd. - Business segments
- Exhibits237: Lenovo Group Ltd. - Key news
- Exhibits238: Lenovo Group Ltd. - Key offerings
- Exhibits239: Lenovo Group Ltd. - Segment focus
- Exhibits240: SWOT
- Exhibits241: LG Corp. - Overview
- Exhibits242: LG Corp. - Business segments
- Exhibits243: LG Corp. - Key news
- Exhibits244: LG Corp. - Key offerings
- Exhibits245: LG Corp. - Segment focus
- Exhibits246: SWOT
- Exhibits247: Microsoft Corp. - Overview
- Exhibits248: Microsoft Corp. - Business segments
- Exhibits249: Microsoft Corp. - Key news
- Exhibits250: Microsoft Corp. - Key offerings
- Exhibits251: Microsoft Corp. - Segment focus
- Exhibits252: SWOT
- Exhibits253: Nexxbase Marketing Pvt. Ltd. - Overview
- Exhibits254: Nexxbase Marketing Pvt. Ltd. - Product / Service
- Exhibits255: Nexxbase Marketing Pvt. Ltd. - Key offerings
- Exhibits256: SWOT
- Exhibits257: Samsung Electronics Co. Ltd. - Overview
- Exhibits258: Samsung Electronics Co. Ltd. - Business segments
- Exhibits259: Samsung Electronics Co. Ltd. - Key news
- Exhibits260: Samsung Electronics Co. Ltd. - Key offerings
- Exhibits261: Samsung Electronics Co. Ltd. - Segment focus
- Exhibits262: SWOT
- Exhibits263: Sensoria Inc. - Overview
- Exhibits264: Sensoria Inc. - Product / Service
- Exhibits265: Sensoria Inc. - Key offerings
- Exhibits266: SWOT
- Exhibits267: Sony Group Corp. - Overview
- Exhibits268: Sony Group Corp. - Business segments
- Exhibits269: Sony Group Corp. - Key offerings
- Exhibits270: Sony Group Corp. - Segment focus
- Exhibits271: SWOT
- Exhibits272: Vuzix Corp. - Overview
- Exhibits273: Vuzix Corp. - Product / Service
- Exhibits274: Vuzix Corp. - Key offerings
- Exhibits275: SWOT
- Exhibits276: Xiaomi Inc. - Overview
- Exhibits277: Xiaomi Inc. - Business segments
- Exhibits278: Xiaomi Inc. - Key news
- Exhibits279: Xiaomi Inc. - Key offerings
- Exhibits280: Xiaomi Inc. - Segment focus
- Exhibits281: SWOT
- Exhibits282: Inclusions checklist
- Exhibits283: Exclusions checklist
- Exhibits284: Currency conversion rates for US$
- Exhibits285: Research methodology
- Exhibits286: Information sources
- Exhibits287: Data validation
- Exhibits288: Validation techniques employed for market sizing
- Exhibits289: Data synthesis
- Exhibits290: 360 degree market analysis
- Exhibits291: List of abbreviations
The smart wearable entertainment devices and services market is forecasted to grow by USD 25322.7 mn during 2024-2029, accelerating at a CAGR of 21.9% during the forecast period. The report on the smart wearable entertainment devices and services market provides a holistic analysis, market size and forecast, trends, growth drivers, and challenges, as well as vendor analysis covering around 25 vendors.
The report offers an up-to-date analysis regarding the current market scenario, the latest trends and drivers, and the overall market environment. The market is driven by increasing awareness about benefits of healthy lifestyle, rising digitization of global economy, and development of miniaturized electronic components.
| Market Scope | |
|---|---|
| Base Year | 2025 |
| End Year | 2029 |
| Series Year | 2025-2029 |
| Growth Momentum | Accelerate |
| YOY 2025 | 17.4% |
| CAGR | 21.9% |
| Incremental Value | $25322.7 mn |
The study was conducted using an objective combination of primary and secondary information including inputs from key participants in the industry. The report contains a comprehensive market size data, segment with regional analysis and vendor landscape in addition to an analysis of the key companies. Reports have historic and forecast data.
Technavio's smart wearable entertainment devices and services market is segmented as below:
By Distribution Channel
- Offline
- Online
By Type
- Smartwatches
- Smart glasses
- Wearable gaming devices
- Others
By Technology
- Communication and networking technology
- Memory and storage technology
- Speech and pattern recognition technology
- Computing technology
- Others
By Application
- Consumer smart wearables
- Fitness and sports
- Healthcare
- Enterprise and industrial applications
- Defense
By Geographical Landscape
- North America
- APAC
- Europe
- Middle East and Africa
- South America
This study identifies the increasing use of smart wearable devices in sports analytics as one of the prime reasons driving the smart wearable entertainment devices and services market growth during the next few years. Also, increasing organic and inorganic strategies and emergence of simultaneous localization and mapping technology will lead to sizable demand in the market.
The report on the smart wearable entertainment devices and services market covers the following areas:
- Smart Wearable Entertainment Devices And Services Market sizing
- Smart Wearable Entertainment Devices And Services Market forecast
- Smart Wearable Entertainment Devices And Services Market industry analysis
The robust vendor analysis is designed to help clients improve their market position, and in line with this, this report provides a detailed analysis of several leading smart wearable entertainment devices and services market vendors that include Adidas AG, Apple Inc., Fitbit LLC, Fossil Group Inc., Garmin Ltd., Huawei Technologies Co. Ltd., Lenovo Group Ltd., LG Corp., Microsoft Corp., Nexxbase Marketing Pvt. Ltd., Owlet Inc., Samsung Electronics Co. Ltd., Sensoria Inc., Sony Group Corp., TE Connectivity Ltd., Vuzix Corp., Withings, and Xiaomi Inc.. Also, the smart wearable entertainment devices and services market analysis report includes information on upcoming trends and challenges that will influence market growth. This is to help companies strategize and leverage all forthcoming growth opportunities.
The publisher presents a detailed picture of the market by the way of study, synthesis, and summation of data from multiple sources by an analysis of key parameters such as profit, pricing, competition, and promotions. It presents various market facets by identifying the key industry influencers. The data presented is comprehensive, reliable, and a result of extensive primary and secondary research. The market research reports provide a complete competitive landscape and an in-depth vendor selection methodology and analysis using qualitative and quantitative research to forecast accurate market growth.
Table of Contents
1 Executive Summary
- 1.1 Market overview
- Executive Summary - Chart on Market Overview
- Executive Summary - Data Table on Market Overview
- Executive Summary - Chart on Global Market Characteristics
- Executive Summary - Chart on Market By Geographical Landscape
- Executive Summary - Chart on Market Segmentation by Distribution Channel
- Executive Summary - Chart on Market Segmentation by Type
- Executive Summary - Chart on Market Segmentation by Technology
- Executive Summary - Chart on Market Segmentation by Application
- Executive Summary - Chart on Incremental Growth
- Executive Summary - Data Table on Incremental Growth
- Executive Summary - Chart on Company Market Positioning
2 Technavio Analysis
- 2.1 Analysis of price sensitivity, lifecycle, customer purchase basket, adoption rates, and purchase criteria
- Analysis of price sensitivity, lifecycle, customer purchase basket, adoption rates, and purchase criteria
- 2.2 Criticality of inputs and Factors of differentiation
- Overview on criticality of inputs and factors of differentiation
- 2.3 Factors of disruption
- Overview on factors of disruption
- 2.4 Impact of drivers and challenges
- Impact of drivers and challenges in 2024 and 2029
3 Market Landscape
- 3.1 Market ecosystem
- Parent Market
- Data Table on - Parent Market
- 3.2 Market characteristics
- Market characteristics analysis
- 3.3 Value chain analysis
- Value chain analysis
4 Market Sizing
- 4.1 Market definition
- Offerings of companies included in the market definition
- 4.2 Market segment analysis
- Market segments
- 4.3 Market size 2024
- 4.4 Market outlook: Forecast for 2024-2029
- Chart on Global - Market size and forecast 2024-2029 ($ million)
- Data Table on Global - Market size and forecast 2024-2029 ($ million)
- Chart on Global Market: Year-over-year growth 2024-2029 (%)
- Data Table on Global Market: Year-over-year growth 2024-2029 (%)
5 Historic Market Size
- 5.1 Global Smart Wearable Entertainment Devices And Services Market 2019 - 2023
- Historic Market Size - Data Table on Global Smart Wearable Entertainment Devices And Services Market 2019 - 2023 ($ million)
- 5.2 Distribution Channel segment analysis 2019 - 2023
- Historic Market Size - Distribution Channel Segment 2019 - 2023 ($ million)
- 5.3 Type segment analysis 2019 - 2023
- Historic Market Size - Type Segment 2019 - 2023 ($ million)
- 5.4 Technology segment analysis 2019 - 2023
- Historic Market Size - Technology Segment 2019 - 2023 ($ million)
- 5.5 Application segment analysis 2019 - 2023
- Historic Market Size - Application Segment 2019 - 2023 ($ million)
- 5.6 Geography segment analysis 2019 - 2023
- Historic Market Size - Geography Segment 2019 - 2023 ($ million)
- 5.7 Country segment analysis 2019 - 2023
- Historic Market Size - Country Segment 2019 - 2023 ($ million)
6 Qualitative Analysis
- 6.1 Impact of AI on Global Smart Wearable Entertainment Devices and Services Market
7 Five Forces Analysis
- 7.1 Five forces summary
- Five forces analysis - Comparison between 2024 and 2029
- 7.2 Bargaining power of buyers
- Bargaining power of buyers - Impact of key factors 2024 and 2029
- 7.3 Bargaining power of suppliers
- Bargaining power of suppliers - Impact of key factors in 2024 and 2029
- 7.4 Threat of new entrants
- Threat of new entrants - Impact of key factors in 2024 and 2029
- 7.5 Threat of substitutes
- Threat of substitutes - Impact of key factors in 2024 and 2029
- 7.6 Threat of rivalry
- Threat of rivalry - Impact of key factors in 2024 and 2029
- 7.7 Market condition
- Chart on Market condition - Five forces 2024 and 2029
8 Market Segmentation by Distribution Channel
- 8.1 Market segments
- Chart on Distribution Channel - Market share 2024-2029 (%)
- Data Table on Distribution Channel - Market share 2024-2029 (%)
- 8.2 Comparison by Distribution Channel
- Chart on Comparison by Distribution Channel
- Data Table on Comparison by Distribution Channel
- 8.3 Offline - Market size and forecast 2024-2029
- Chart on Offline - Market size and forecast 2024-2029 ($ million)
- Data Table on Offline - Market size and forecast 2024-2029 ($ million)
- Chart on Offline - Year-over-year growth 2024-2029 (%)
- Data Table on Offline - Year-over-year growth 2024-2029 (%)
- 8.4 Online - Market size and forecast 2024-2029
- Chart on Online - Market size and forecast 2024-2029 ($ million)
- Data Table on Online - Market size and forecast 2024-2029 ($ million)
- Chart on Online - Year-over-year growth 2024-2029 (%)
- Data Table on Online - Year-over-year growth 2024-2029 (%)
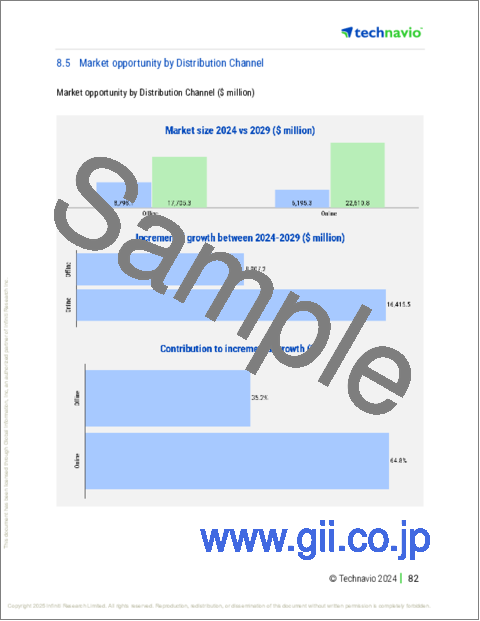
- 8.5 Market opportunity by Distribution Channel
- Market opportunity by Distribution Channel ($ million)
- Data Table on Market opportunity by Distribution Channel ($ million)
9 Market Segmentation by Type
- 9.1 Market segments
- Chart on Type - Market share 2024-2029 (%)
- Data Table on Type - Market share 2024-2029 (%)
- 9.2 Comparison by Type
- Chart on Comparison by Type
- Data Table on Comparison by Type
- 9.3 Smartwatches - Market size and forecast 2024-2029
- Chart on Smartwatches - Market size and forecast 2024-2029 ($ million)
- Data Table on Smartwatches - Market size and forecast 2024-2029 ($ million)
- Chart on Smartwatches - Year-over-year growth 2024-2029 (%)
- Data Table on Smartwatches - Year-over-year growth 2024-2029 (%)
- 9.4 Smart glasses - Market size and forecast 2024-2029
- Chart on Smart glasses - Market size and forecast 2024-2029 ($ million)
- Data Table on Smart glasses - Market size and forecast 2024-2029 ($ million)
- Chart on Smart glasses - Year-over-year growth 2024-2029 (%)
- Data Table on Smart glasses - Year-over-year growth 2024-2029 (%)
- 9.5 Wearable gaming devices - Market size and forecast 2024-2029
- Chart on Wearable gaming devices - Market size and forecast 2024-2029 ($ million)
- Data Table on Wearable gaming devices - Market size and forecast 2024-2029 ($ million)
- Chart on Wearable gaming devices - Year-over-year growth 2024-2029 (%)
- Data Table on Wearable gaming devices - Year-over-year growth 2024-2029 (%)
- 9.6 Others - Market size and forecast 2024-2029
- Chart on Others - Market size and forecast 2024-2029 ($ million)
- Data Table on Others - Market size and forecast 2024-2029 ($ million)
- Chart on Others - Year-over-year growth 2024-2029 (%)
- Data Table on Others - Year-over-year growth 2024-2029 (%)
- 9.7 Market opportunity by Type
- Market opportunity by Type ($ million)
- Data Table on Market opportunity by Type ($ million)
10 Market Segmentation by Technology
- 10.1 Market segments
- Chart on Technology - Market share 2024-2029 (%)
- Data Table on Technology - Market share 2024-2029 (%)
- 10.2 Comparison by Technology
- Chart on Comparison by Technology
- Data Table on Comparison by Technology
- 10.3 Communication and networking technology - Market size and forecast 2024-2029
- Chart on Communication and networking technology - Market size and forecast 2024-2029 ($ million)
- Data Table on Communication and networking technology - Market size and forecast 2024-2029 ($ million)
- Chart on Communication and networking technology - Year-over-year growth 2024-2029 (%)
- Data Table on Communication and networking technology - Year-over-year growth 2024-2029 (%)
- 10.4 Memory and storage technology - Market size and forecast 2024-2029
- Chart on Memory and storage technology - Market size and forecast 2024-2029 ($ million)
- Data Table on Memory and storage technology - Market size and forecast 2024-2029 ($ million)
- Chart on Memory and storage technology - Year-over-year growth 2024-2029 (%)
- Data Table on Memory and storage technology - Year-over-year growth 2024-2029 (%)
- 10.5 Speech and pattern recognition technology - Market size and forecast 2024-2029
- Chart on Speech and pattern recognition technology - Market size and forecast 2024-2029 ($ million)
- Data Table on Speech and pattern recognition technology - Market size and forecast 2024-2029 ($ million)
- Chart on Speech and pattern recognition technology - Year-over-year growth 2024-2029 (%)
- Data Table on Speech and pattern recognition technology - Year-over-year growth 2024-2029 (%)
- 10.6 Computing technology - Market size and forecast 2024-2029
- Chart on Computing technology - Market size and forecast 2024-2029 ($ million)
- Data Table on Computing technology - Market size and forecast 2024-2029 ($ million)
- Chart on Computing technology - Year-over-year growth 2024-2029 (%)
- Data Table on Computing technology - Year-over-year growth 2024-2029 (%)
- 10.7 Others - Market size and forecast 2024-2029
- Chart on Others - Market size and forecast 2024-2029 ($ million)
- Data Table on Others - Market size and forecast 2024-2029 ($ million)
- Chart on Others - Year-over-year growth 2024-2029 (%)
- Data Table on Others - Year-over-year growth 2024-2029 (%)
- 10.8 Market opportunity by Technology
- Market opportunity by Technology ($ million)
- Data Table on Market opportunity by Technology ($ million)
11 Market Segmentation by Application
- 11.1 Market segments
- Chart on Application - Market share 2024-2029 (%)
- Data Table on Application - Market share 2024-2029 (%)
- 11.2 Comparison by Application
- Chart on Comparison by Application
- Data Table on Comparison by Application
- 11.3 Consumer smart wearables - Market size and forecast 2024-2029
- Chart on Consumer smart wearables - Market size and forecast 2024-2029 ($ million)
- Data Table on Consumer smart wearables - Market size and forecast 2024-2029 ($ million)
- Chart on Consumer smart wearables - Year-over-year growth 2024-2029 (%)
- Data Table on Consumer smart wearables - Year-over-year growth 2024-2029 (%)
- 11.4 Fitness and sports - Market size and forecast 2024-2029
- Chart on Fitness and sports - Market size and forecast 2024-2029 ($ million)
- Data Table on Fitness and sports - Market size and forecast 2024-2029 ($ million)
- Chart on Fitness and sports - Year-over-year growth 2024-2029 (%)
- Data Table on Fitness and sports - Year-over-year growth 2024-2029 (%)
- 11.5 Healthcare - Market size and forecast 2024-2029
- Chart on Healthcare - Market size and forecast 2024-2029 ($ million)
- Data Table on Healthcare - Market size and forecast 2024-2029 ($ million)
- Chart on Healthcare - Year-over-year growth 2024-2029 (%)
- Data Table on Healthcare - Year-over-year growth 2024-2029 (%)
- 11.6 Enterprise and industrial applications - Market size and forecast 2024-2029
- Chart on Enterprise and industrial applications - Market size and forecast 2024-2029 ($ million)
- Data Table on Enterprise and industrial applications - Market size and forecast 2024-2029 ($ million)
- Chart on Enterprise and industrial applications - Year-over-year growth 2024-2029 (%)
- Data Table on Enterprise and industrial applications - Year-over-year growth 2024-2029 (%)
- 11.7 Defense - Market size and forecast 2024-2029
- Chart on Defense - Market size and forecast 2024-2029 ($ million)
- Data Table on Defense - Market size and forecast 2024-2029 ($ million)
- Chart on Defense - Year-over-year growth 2024-2029 (%)
- Data Table on Defense - Year-over-year growth 2024-2029 (%)
- 11.8 Market opportunity by Application
- Market opportunity by Application ($ million)
- Data Table on Market opportunity by Application ($ million)
12 Customer Landscape
- 12.1 Customer landscape overview
- Analysis of price sensitivity, lifecycle, customer purchase basket, adoption rates, and purchase criteria
13 Geographic Landscape
- 13.1 Geographic segmentation
- Chart on Market share By Geographical Landscape 2024-2029 (%)
- Data Table on Market share By Geographical Landscape 2024-2029 (%)
- 13.2 Geographic comparison
- Chart on Geographic comparison
- Data Table on Geographic comparison
- 13.3 North America - Market size and forecast 2024-2029
- Chart on North America - Market size and forecast 2024-2029 ($ million)
- Data Table on North America - Market size and forecast 2024-2029 ($ million)
- Chart on North America - Year-over-year growth 2024-2029 (%)
- Data Table on North America - Year-over-year growth 2024-2029 (%)
- 13.4 APAC - Market size and forecast 2024-2029
- Chart on APAC - Market size and forecast 2024-2029 ($ million)
- Data Table on APAC - Market size and forecast 2024-2029 ($ million)
- Chart on APAC - Year-over-year growth 2024-2029 (%)
- Data Table on APAC - Year-over-year growth 2024-2029 (%)
- 13.5 Europe - Market size and forecast 2024-2029
- Chart on Europe - Market size and forecast 2024-2029 ($ million)
- Data Table on Europe - Market size and forecast 2024-2029 ($ million)
- Chart on Europe - Year-over-year growth 2024-2029 (%)
- Data Table on Europe - Year-over-year growth 2024-2029 (%)
- 13.6 Middle East and Africa - Market size and forecast 2024-2029
- Chart on Middle East and Africa - Market size and forecast 2024-2029 ($ million)
- Data Table on Middle East and Africa - Market size and forecast 2024-2029 ($ million)
- Chart on Middle East and Africa - Year-over-year growth 2024-2029 (%)
- Data Table on Middle East and Africa - Year-over-year growth 2024-2029 (%)
- 13.7 South America - Market size and forecast 2024-2029
- Chart on South America - Market size and forecast 2024-2029 ($ million)
- Data Table on South America - Market size and forecast 2024-2029 ($ million)
- Chart on South America - Year-over-year growth 2024-2029 (%)
- Data Table on South America - Year-over-year growth 2024-2029 (%)
- 13.8 US - Market size and forecast 2024-2029
- Chart on US - Market size and forecast 2024-2029 ($ million)
- Data Table on US - Market size and forecast 2024-2029 ($ million)
- Chart on US - Year-over-year growth 2024-2029 (%)
- Data Table on US - Year-over-year growth 2024-2029 (%)
- 13.9 China - Market size and forecast 2024-2029
- Chart on China - Market size and forecast 2024-2029 ($ million)
- Data Table on China - Market size and forecast 2024-2029 ($ million)
- Chart on China - Year-over-year growth 2024-2029 (%)
- Data Table on China - Year-over-year growth 2024-2029 (%)
- 13.10 Canada - Market size and forecast 2024-2029
- Chart on Canada - Market size and forecast 2024-2029 ($ million)
- Data Table on Canada - Market size and forecast 2024-2029 ($ million)
- Chart on Canada - Year-over-year growth 2024-2029 (%)
- Data Table on Canada - Year-over-year growth 2024-2029 (%)
- 13.11 Japan - Market size and forecast 2024-2029
- Chart on Japan - Market size and forecast 2024-2029 ($ million)
- Data Table on Japan - Market size and forecast 2024-2029 ($ million)
- Chart on Japan - Year-over-year growth 2024-2029 (%)
- Data Table on Japan - Year-over-year growth 2024-2029 (%)
- 13.12 India - Market size and forecast 2024-2029
- Chart on India - Market size and forecast 2024-2029 ($ million)
- Data Table on India - Market size and forecast 2024-2029 ($ million)
- Chart on India - Year-over-year growth 2024-2029 (%)
- Data Table on India - Year-over-year growth 2024-2029 (%)
- 13.13 Germany - Market size and forecast 2024-2029
- Chart on Germany - Market size and forecast 2024-2029 ($ million)
- Data Table on Germany - Market size and forecast 2024-2029 ($ million)
- Chart on Germany - Year-over-year growth 2024-2029 (%)
- Data Table on Germany - Year-over-year growth 2024-2029 (%)
- 13.14 UK - Market size and forecast 2024-2029
- Chart on UK - Market size and forecast 2024-2029 ($ million)
- Data Table on UK - Market size and forecast 2024-2029 ($ million)
- Chart on UK - Year-over-year growth 2024-2029 (%)
- Data Table on UK - Year-over-year growth 2024-2029 (%)
- 13.15 South Korea - Market size and forecast 2024-2029
- Chart on South Korea - Market size and forecast 2024-2029 ($ million)
- Data Table on South Korea - Market size and forecast 2024-2029 ($ million)
- Chart on South Korea - Year-over-year growth 2024-2029 (%)
- Data Table on South Korea - Year-over-year growth 2024-2029 (%)
- 13.16 France - Market size and forecast 2024-2029
- Chart on France - Market size and forecast 2024-2029 ($ million)
- Data Table on France - Market size and forecast 2024-2029 ($ million)
- Chart on France - Year-over-year growth 2024-2029 (%)
- Data Table on France - Year-over-year growth 2024-2029 (%)
- 13.17 Australia - Market size and forecast 2024-2029
- Chart on Australia - Market size and forecast 2024-2029 ($ million)
- Data Table on Australia - Market size and forecast 2024-2029 ($ million)
- Chart on Australia - Year-over-year growth 2024-2029 (%)
- Data Table on Australia - Year-over-year growth 2024-2029 (%)
- 13.18 Market opportunity By Geographical Landscape
- Market opportunity By Geographical Landscape ($ million)
- Data Tables on Market opportunity By Geographical Landscape ($ million)
14 Drivers, Challenges, and Opportunity/Restraints
- 14.1 Market drivers
- 14.2 Market challenges
- 14.3 Impact of drivers and challenges
- Impact of drivers and challenges in 2024 and 2029
- 14.4 Market opportunities/restraints
15 Competitive Landscape
- 15.1 Overview
- 15.2 Competitive Landscape
- Overview on criticality of inputs and factors of differentiation
- 15.3 Landscape disruption
- Overview on factors of disruption
- 15.4 Industry risks
- Impact of key risks on business
16 Competitive Analysis
- 16.1 Companies profiled
- Companies covered
- 16.2 Company ranking index
- Company ranking index
- 16.3 Market positioning of companies
- Matrix on companies position and classification
- 16.4 Adidas AG
- Adidas AG - Overview
- Adidas AG - Business segments
- Adidas AG - Key news
- Adidas AG - Key offerings
- Adidas AG - Segment focus
- SWOT
- 16.5 Apple Inc.
- Apple Inc. - Overview
- Apple Inc. - Business segments
- Apple Inc. - Key news
- Apple Inc. - Key offerings
- Apple Inc. - Segment focus
- SWOT
- 16.6 Fitbit LLC
- Fitbit LLC - Overview
- Fitbit LLC - Product / Service
- Fitbit LLC - Key offerings
- SWOT
- 16.7 Fossil Group Inc.
- Fossil Group Inc. - Overview
- Fossil Group Inc. - Business segments
- Fossil Group Inc. - Key news
- Fossil Group Inc. - Key offerings
- Fossil Group Inc. - Segment focus
- SWOT
- 16.8 Garmin Ltd.
- Garmin Ltd. - Overview
- Garmin Ltd. - Business segments
- Garmin Ltd. - Key news
- Garmin Ltd. - Key offerings
- Garmin Ltd. - Segment focus
- SWOT
- 16.9 Huawei Technologies Co. Ltd.
- Huawei Technologies Co. Ltd. - Overview
- Huawei Technologies Co. Ltd. - Product / Service
- Huawei Technologies Co. Ltd. - Key news
- Huawei Technologies Co. Ltd. - Key offerings
- SWOT
- 16.10 Lenovo Group Ltd.
- Lenovo Group Ltd. - Overview
- Lenovo Group Ltd. - Business segments
- Lenovo Group Ltd. - Key news
- Lenovo Group Ltd. - Key offerings
- Lenovo Group Ltd. - Segment focus
- SWOT
- 16.11 LG Corp.
- LG Corp. - Overview
- LG Corp. - Business segments
- LG Corp. - Key news
- LG Corp. - Key offerings
- LG Corp. - Segment focus
- SWOT
- 16.12 Microsoft Corp.
- Microsoft Corp. - Overview
- Microsoft Corp. - Business segments
- Microsoft Corp. - Key news
- Microsoft Corp. - Key offerings
- Microsoft Corp. - Segment focus
- SWOT
- 16.13 Nexxbase Marketing Pvt. Ltd.
- Nexxbase Marketing Pvt. Ltd. - Overview
- Nexxbase Marketing Pvt. Ltd. - Product / Service
- Nexxbase Marketing Pvt. Ltd. - Key offerings
- SWOT
- 16.14 Samsung Electronics Co. Ltd.
- Samsung Electronics Co. Ltd. - Overview
- Samsung Electronics Co. Ltd. - Business segments
- Samsung Electronics Co. Ltd. - Key news
- Samsung Electronics Co. Ltd. - Key offerings
- Samsung Electronics Co. Ltd. - Segment focus
- SWOT
- 16.15 Sensoria Inc.
- Sensoria Inc. - Overview
- Sensoria Inc. - Product / Service
- Sensoria Inc. - Key offerings
- SWOT
- 16.16 Sony Group Corp.
- Sony Group Corp. - Overview
- Sony Group Corp. - Business segments
- Sony Group Corp. - Key offerings
- Sony Group Corp. - Segment focus
- SWOT
- 16.17 Vuzix Corp.
- Vuzix Corp. - Overview
- Vuzix Corp. - Product / Service
- Vuzix Corp. - Key offerings
- SWOT
- 16.18 Xiaomi Inc.
- Xiaomi Inc. - Overview
- Xiaomi Inc. - Business segments
- Xiaomi Inc. - Key news
- Xiaomi Inc. - Key offerings
- Xiaomi Inc. - Segment focus
- SWOT
17 Appendix
- 17.1 Scope of the report
- 17.2 Inclusions and exclusions checklist
- Inclusions checklist
- Exclusions checklist
- 17.3 Currency conversion rates for US$
- Currency conversion rates for US$
- 17.4 Research methodology
- Research methodology
- 17.5 Data procurement
- Information sources
- 17.6 Data validation
- Data validation
- 17.7 Validation techniques employed for market sizing
- Validation techniques employed for market sizing
- 17.8 Data synthesis
- Data synthesis
- 17.9 360 degree market analysis
- 360 degree market analysis
- 17.10 List of abbreviations
- List of abbreviations
