|
|
市場調査レポート
商品コード
1692991
医療機器の日本市場 2025~2029年Medical Devices Market in Japan 2025-2029 |
||||||

|
|||||||
カスタマイズ可能
|
|||||||


| 医療機器の日本市場 2025~2029年 |
|
出版日: 2025年03月26日
発行: TechNavio
ページ情報: 英文 197 Pages
納期: 即納可能
|

全表示
- 概要
- 図表
- 目次
日本の医療機器市場は2024-2029年に173億8,020万米ドル、予測期間中のCAGRは7.1%で成長すると予測されます。
当レポートでは、日本の医療機器市場の全体的な分析、市場規模と予測、動向、成長促進要因、約25のベンダーを網羅したベンダー分析などを掲載しています。
現在の市場シナリオ、最新動向と促進要因、市場環境全体に関する最新分析を提供しています。同市場は、低侵襲手技の需要増加、心臓モニタリングおよび心臓治療装置の技術進歩、画像診断技術の採用拡大などが牽引しています。
この調査は、業界の主要参加者からのインプットを含め、一次情報と二次情報を客観的に組み合わせて実施しました。レポートには、主要企業の分析に加え、包括的な市場規模データ、地域分析によるセグメント、ベンダー情勢が含まれています。レポートには過去データと予測データを掲載しています。
| 市場範囲 | |
|---|---|
| 基準年 | 2025 |
| 終了年 | 2029 |
| 予測期間 | 2025-2029 |
| 成長モメンタム | 加速 |
| 前年比2025年 | 6.5% |
| CAGR | 7.1% |
| 増分額 | 173億8,020万米ドル |
本調査では、革新的な医療技術の出現が、今後数年間の日本の医療機器市場の成長を牽引する主な要因の一つであると分析しています。また、整形外科用インプラントの進歩や再生医療・組織工学の進歩も、市場の大きな需要につながると思われます。
目次
第1章 エグゼクティブサマリー
- 市場概要
第2章 Technavio分析
- 価格・ライフサイクル・顧客購入バスケット・採用率・購入基準の分析
- インプットの重要性と差別化の要因
- 混乱の要因
- 促進要因と課題の影響
第3章 市場情勢
- 市場エコシステム
- 市場の特徴
- バリューチェーン分析
第4章 市場規模
- 市場の定義
- 市場セグメント分析
- 市場規模 2024
- 市場の見通し 2024-2029
第5章 市場規模実績
- 日本の医療機器市場 2019-2023
- 製品別タイプセグメント分析 2019-2023
- 用途別セグメント分析 2019-2023
- エンドユーザー別セグメント分析 2019-2023
第6章 定性分析
- AIの影響:日本の医療機器市場
第7章 ファイブフォース分析
- ファイブフォースの要約
- 買い手の交渉力
- 供給企業の交渉力
- 新規参入業者の脅威
- 代替品の脅威
- 競争の脅威
- 市況
第8章 市場セグメンテーション:製品タイプ別
- 市場セグメント
- 比較:製品タイプ別
- 診断装置:市場規模と予測 2024-2029
- 治療機器:市場規模と予測 2024-2029
- 監視デバイス:市場規模と予測 2024-2029
- 補助器具およびリハビリテーション機器:市場規模と予測 2024-2029
- その他:市場規模と予測 2024-2029
- 市場機会:製品タイプ別
第9章 市場セグメンテーション:用途別
- 市場セグメント
- 比較:用途別
- 心臓血管:市場規模と予測 2024-2029
- 整形外科:市場規模と予測 2024-2029
- 診断画像:市場規模と予測 2024-2029
- 歯科:市場規模と予測 2024-2029
- その他:市場規模と予測 2024-2029
- 市場機会:用途別
第10章 市場セグメンテーション:エンドユーザー別
- 市場セグメント
- 比較:エンドユーザー別
- 病院と診療所:市場規模と予測 2024-2029
- 診断センター:市場規模と予測 2024-2029
- その他:市場規模と予測 2024-2029
- 市場機会:エンドユーザー別
第11章 顧客情勢
- 顧客情勢の概要
第12章 促進要因・課題・機会・抑制要因
- 市場促進要因
- 市場の課題
- 促進要因と課題の影響
- 市場の機会・抑制要因
第13章 競合情勢
- 概要
- 競合情勢
- 混乱の状況
- 業界のリスク
第14章 競合分析
- 企業プロファイル
- 企業ランキング指数
- 企業の市場ポジショニング
- AI Medical Service Inc.
- ARKRAY Inc.
- ASTI Corp.
- B dot Medical Inc.
- Baxter International Inc.
- Becton Dickinson and Co.
- Canon Inc.
- F. Hoffmann La Roche Ltd.
- GE Healthcare Technologies Inc.
- Hitachi Ltd.
- Johnson and Johnson Inc.
- Medtronic Plc
- Nipro Corp.
- Siemens AG
- Terumo Medical Corp.
第15章 付録
Exhibits:
- Exhibits1: Executive Summary - Chart on Market Overview
- Exhibits2: Executive Summary - Data Table on Market Overview
- Exhibits3: Executive Summary - Chart on Country Market Characteristics
- Exhibits4: Executive Summary - Chart on Market Segmentation by Product Type
- Exhibits5: Executive Summary - Chart on Market Segmentation by Application
- Exhibits6: Executive Summary - Chart on Market Segmentation by End-user
- Exhibits7: Executive Summary - Chart on Company Market Positioning
- Exhibits8: Analysis of price sensitivity, lifecycle, customer purchase basket, adoption rates, and purchase criteria
- Exhibits9: Overview on criticality of inputs and factors of differentiation
- Exhibits10: Overview on factors of disruption
- Exhibits11: Impact of drivers and challenges in 2024 and 2029
- Exhibits12: Parent Market
- Exhibits13: Data Table on - Parent Market
- Exhibits14: Market characteristics analysis
- Exhibits15: Value chain analysis
- Exhibits16: Offerings of companies included in the market definition
- Exhibits17: Market segments
- Exhibits18: Chart on Japan - Market size and forecast 2024-2029 ($ million)
- Exhibits19: Data Table on Japan - Market size and forecast 2024-2029 ($ million)
- Exhibits20: Chart on Japan: Year-over-year growth 2024-2029 (%)
- Exhibits21: Data Table on Japan: Year-over-year growth 2024-2029 (%)
- Exhibits22: Historic Market Size - Data Table on Medical Devices Market in Japan 2019 - 2023 ($ million)
- Exhibits23: Historic Market Size - Product Type Segment 2019 - 2023 ($ million)
- Exhibits24: Historic Market Size - Application Segment 2019 - 2023 ($ million)
- Exhibits25: Historic Market Size - End-user Segment 2019 - 2023 ($ million)
- Exhibits26: Five forces analysis - Comparison between 2024 and 2029
- Exhibits27: Bargaining power of buyers - Impact of key factors 2024 and 2029
- Exhibits28: Bargaining power of suppliers - Impact of key factors in 2024 and 2029
- Exhibits29: Threat of new entrants - Impact of key factors in 2024 and 2029
- Exhibits30: Threat of substitutes - Impact of key factors in 2024 and 2029
- Exhibits31: Threat of rivalry - Impact of key factors in 2024 and 2029
- Exhibits32: Chart on Market condition - Five forces 2024 and 2029
- Exhibits33: Chart on Product Type - Market share 2024-2029 (%)
- Exhibits34: Data Table on Product Type - Market share 2024-2029 (%)
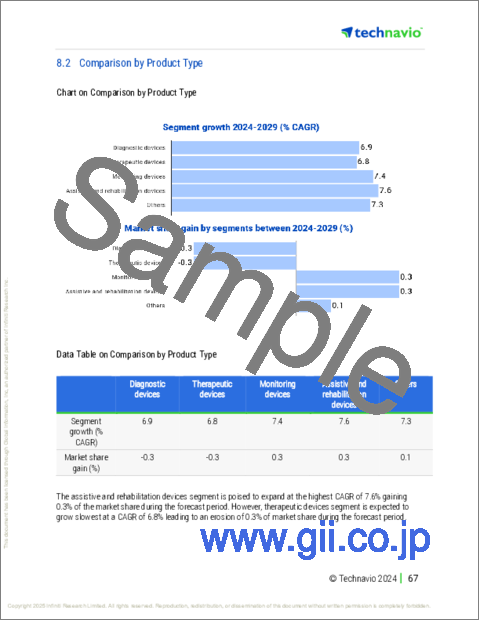
- Exhibits35: Chart on Comparison by Product Type
- Exhibits36: Data Table on Comparison by Product Type
- Exhibits37: Chart on Diagnostic devices - Market size and forecast 2024-2029 ($ million)
- Exhibits38: Data Table on Diagnostic devices - Market size and forecast 2024-2029 ($ million)
- Exhibits39: Chart on Diagnostic devices - Year-over-year growth 2024-2029 (%)
- Exhibits40: Data Table on Diagnostic devices - Year-over-year growth 2024-2029 (%)
- Exhibits41: Chart on Therapeutic devices - Market size and forecast 2024-2029 ($ million)
- Exhibits42: Data Table on Therapeutic devices - Market size and forecast 2024-2029 ($ million)
- Exhibits43: Chart on Therapeutic devices - Year-over-year growth 2024-2029 (%)
- Exhibits44: Data Table on Therapeutic devices - Year-over-year growth 2024-2029 (%)
- Exhibits45: Chart on Monitoring devices - Market size and forecast 2024-2029 ($ million)
- Exhibits46: Data Table on Monitoring devices - Market size and forecast 2024-2029 ($ million)
- Exhibits47: Chart on Monitoring devices - Year-over-year growth 2024-2029 (%)
- Exhibits48: Data Table on Monitoring devices - Year-over-year growth 2024-2029 (%)
- Exhibits49: Chart on Assistive and rehabilitation devices - Market size and forecast 2024-2029 ($ million)
- Exhibits50: Data Table on Assistive and rehabilitation devices - Market size and forecast 2024-2029 ($ million)
- Exhibits51: Chart on Assistive and rehabilitation devices - Year-over-year growth 2024-2029 (%)
- Exhibits52: Data Table on Assistive and rehabilitation devices - Year-over-year growth 2024-2029 (%)
- Exhibits53: Chart on Others - Market size and forecast 2024-2029 ($ million)
- Exhibits54: Data Table on Others - Market size and forecast 2024-2029 ($ million)
- Exhibits55: Chart on Others - Year-over-year growth 2024-2029 (%)
- Exhibits56: Data Table on Others - Year-over-year growth 2024-2029 (%)
- Exhibits57: Market opportunity by Product Type ($ million)
- Exhibits58: Data Table on Market opportunity by Product Type ($ million)
- Exhibits59: Chart on Application - Market share 2024-2029 (%)
- Exhibits60: Data Table on Application - Market share 2024-2029 (%)
- Exhibits61: Chart on Comparison by Application
- Exhibits62: Data Table on Comparison by Application
- Exhibits63: Chart on Cardiovascular - Market size and forecast 2024-2029 ($ million)
- Exhibits64: Data Table on Cardiovascular - Market size and forecast 2024-2029 ($ million)
- Exhibits65: Chart on Cardiovascular - Year-over-year growth 2024-2029 (%)
- Exhibits66: Data Table on Cardiovascular - Year-over-year growth 2024-2029 (%)
- Exhibits67: Chart on Orthopedic - Market size and forecast 2024-2029 ($ million)
- Exhibits68: Data Table on Orthopedic - Market size and forecast 2024-2029 ($ million)
- Exhibits69: Chart on Orthopedic - Year-over-year growth 2024-2029 (%)
- Exhibits70: Data Table on Orthopedic - Year-over-year growth 2024-2029 (%)
- Exhibits71: Chart on Diagnostic imaging - Market size and forecast 2024-2029 ($ million)
- Exhibits72: Data Table on Diagnostic imaging - Market size and forecast 2024-2029 ($ million)
- Exhibits73: Chart on Diagnostic imaging - Year-over-year growth 2024-2029 (%)
- Exhibits74: Data Table on Diagnostic imaging - Year-over-year growth 2024-2029 (%)
- Exhibits75: Chart on Dental - Market size and forecast 2024-2029 ($ million)
- Exhibits76: Data Table on Dental - Market size and forecast 2024-2029 ($ million)
- Exhibits77: Chart on Dental - Year-over-year growth 2024-2029 (%)
- Exhibits78: Data Table on Dental - Year-over-year growth 2024-2029 (%)
- Exhibits79: Chart on Others - Market size and forecast 2024-2029 ($ million)
- Exhibits80: Data Table on Others - Market size and forecast 2024-2029 ($ million)
- Exhibits81: Chart on Others - Year-over-year growth 2024-2029 (%)
- Exhibits82: Data Table on Others - Year-over-year growth 2024-2029 (%)
- Exhibits83: Market opportunity by Application ($ million)
- Exhibits84: Data Table on Market opportunity by Application ($ million)
- Exhibits85: Chart on End-user - Market share 2024-2029 (%)
- Exhibits86: Data Table on End-user - Market share 2024-2029 (%)
- Exhibits87: Chart on Comparison by End-user
- Exhibits88: Data Table on Comparison by End-user
- Exhibits89: Chart on Hospitals and clinics - Market size and forecast 2024-2029 ($ million)
- Exhibits90: Data Table on Hospitals and clinics - Market size and forecast 2024-2029 ($ million)
- Exhibits91: Chart on Hospitals and clinics - Year-over-year growth 2024-2029 (%)
- Exhibits92: Data Table on Hospitals and clinics - Year-over-year growth 2024-2029 (%)
- Exhibits93: Chart on Diagnostic centers - Market size and forecast 2024-2029 ($ million)
- Exhibits94: Data Table on Diagnostic centers - Market size and forecast 2024-2029 ($ million)
- Exhibits95: Chart on Diagnostic centers - Year-over-year growth 2024-2029 (%)
- Exhibits96: Data Table on Diagnostic centers - Year-over-year growth 2024-2029 (%)
- Exhibits97: Chart on Others - Market size and forecast 2024-2029 ($ million)
- Exhibits98: Data Table on Others - Market size and forecast 2024-2029 ($ million)
- Exhibits99: Chart on Others - Year-over-year growth 2024-2029 (%)
- Exhibits100: Data Table on Others - Year-over-year growth 2024-2029 (%)
- Exhibits101: Market opportunity by End-user ($ million)
- Exhibits102: Data Table on Market opportunity by End-user ($ million)
- Exhibits103: Analysis of price sensitivity, lifecycle, customer purchase basket, adoption rates, and purchase criteria
- Exhibits104: Impact of drivers and challenges in 2024 and 2029
- Exhibits105: Overview on criticality of inputs and factors of differentiation
- Exhibits106: Overview on factors of disruption
- Exhibits107: Impact of key risks on business
- Exhibits108: Companies covered
- Exhibits109: Company ranking index
- Exhibits110: Matrix on companies position and classification
- Exhibits111: AI Medical Service Inc. - Overview
- Exhibits112: AI Medical Service Inc. - Product / Service
- Exhibits113: AI Medical Service Inc. - Key offerings
- Exhibits114: SWOT
- Exhibits115: ARKRAY Inc. - Overview
- Exhibits116: ARKRAY Inc. - Product / Service
- Exhibits117: ARKRAY Inc. - Key offerings
- Exhibits118: SWOT
- Exhibits119: ASTI Corp. - Overview
- Exhibits120: ASTI Corp. - Product / Service
- Exhibits121: ASTI Corp. - Key offerings
- Exhibits122: SWOT
- Exhibits123: B dot Medical Inc. - Overview
- Exhibits124: B dot Medical Inc. - Product / Service
- Exhibits125: B dot Medical Inc. - Key offerings
- Exhibits126: SWOT
- Exhibits127: Baxter International Inc. - Overview
- Exhibits128: Baxter International Inc. - Business segments
- Exhibits129: Baxter International Inc. - Key news
- Exhibits130: Baxter International Inc. - Key offerings
- Exhibits131: Baxter International Inc. - Segment focus
- Exhibits132: SWOT
- Exhibits133: Becton Dickinson and Co. - Overview
- Exhibits134: Becton Dickinson and Co. - Business segments
- Exhibits135: Becton Dickinson and Co. - Key news
- Exhibits136: Becton Dickinson and Co. - Key offerings
- Exhibits137: Becton Dickinson and Co. - Segment focus
- Exhibits138: SWOT
- Exhibits139: Canon Inc. - Overview
- Exhibits140: Canon Inc. - Business segments
- Exhibits141: Canon Inc. - Key news
- Exhibits142: Canon Inc. - Key offerings
- Exhibits143: Canon Inc. - Segment focus
- Exhibits144: SWOT
- Exhibits145: F. Hoffmann La Roche Ltd. - Overview
- Exhibits146: F. Hoffmann La Roche Ltd. - Business segments
- Exhibits147: F. Hoffmann La Roche Ltd. - Key news
- Exhibits148: F. Hoffmann La Roche Ltd. - Key offerings
- Exhibits149: F. Hoffmann La Roche Ltd. - Segment focus
- Exhibits150: SWOT
- Exhibits151: GE Healthcare Technologies Inc. - Overview
- Exhibits152: GE Healthcare Technologies Inc. - Business segments
- Exhibits153: GE Healthcare Technologies Inc. - Key news
- Exhibits154: GE Healthcare Technologies Inc. - Key offerings
- Exhibits155: GE Healthcare Technologies Inc. - Segment focus
- Exhibits156: SWOT
- Exhibits157: Hitachi Ltd. - Overview
- Exhibits158: Hitachi Ltd. - Business segments
- Exhibits159: Hitachi Ltd. - Key news
- Exhibits160: Hitachi Ltd. - Key offerings
- Exhibits161: Hitachi Ltd. - Segment focus
- Exhibits162: SWOT
- Exhibits163: Johnson and Johnson Inc. - Overview
- Exhibits164: Johnson and Johnson Inc. - Business segments
- Exhibits165: Johnson and Johnson Inc. - Key news
- Exhibits166: Johnson and Johnson Inc. - Key offerings
- Exhibits167: Johnson and Johnson Inc. - Segment focus
- Exhibits168: SWOT
- Exhibits169: Medtronic Plc - Overview
- Exhibits170: Medtronic Plc - Business segments
- Exhibits171: Medtronic Plc - Key news
- Exhibits172: Medtronic Plc - Key offerings
- Exhibits173: Medtronic Plc - Segment focus
- Exhibits174: SWOT
- Exhibits175: Nipro Corp. - Overview
- Exhibits176: Nipro Corp. - Business segments
- Exhibits177: Nipro Corp. - Key offerings
- Exhibits178: Nipro Corp. - Segment focus
- Exhibits179: SWOT
- Exhibits180: Siemens AG - Overview
- Exhibits181: Siemens AG - Business segments
- Exhibits182: Siemens AG - Key news
- Exhibits183: Siemens AG - Key offerings
- Exhibits184: Siemens AG - Segment focus
- Exhibits185: SWOT
- Exhibits186: Terumo Medical Corp. - Overview
- Exhibits187: Terumo Medical Corp. - Product / Service
- Exhibits188: Terumo Medical Corp. - Key offerings
- Exhibits189: SWOT
- Exhibits190: Inclusions checklist
- Exhibits191: Exclusions checklist
- Exhibits192: Currency conversion rates for US$
- Exhibits193: Research methodology
- Exhibits194: Information sources
- Exhibits195: Data validation
- Exhibits196: Validation techniques employed for market sizing
- Exhibits197: Data synthesis
- Exhibits198: 360 degree market analysis
- Exhibits199: List of abbreviations
The medical devices market in japan is forecasted to grow by USD 17380.2 mn during 2024-2029, accelerating at a CAGR of 7.1% during the forecast period. The report on the medical devices market in japan provides a holistic analysis, market size and forecast, trends, growth drivers, and challenges, as well as vendor analysis covering around 25 vendors.
The report offers an up-to-date analysis regarding the current market scenario, the latest trends and drivers, and the overall market environment. The market is driven by increasing demand for minimally invasive procedures, technological advancements in cardiac monitoring and cardiac therapy devices, and growing adoption of diagnostic imaging technology.
The study was conducted using an objective combination of primary and secondary information including inputs from key participants in the industry. The report contains a comprehensive market size data, segment with regional analysis and vendor landscape in addition to an analysis of the key companies. Reports have historic and forecast data.
| Market Scope | |
|---|---|
| Base Year | 2025 |
| End Year | 2029 |
| Series Year | 2025-2029 |
| Growth Momentum | Accelerate |
| YOY 2025 | 6.5% |
| CAGR | 7.1% |
| Incremental Value | $17380.2 mn |
Technavio's medical devices market in japan is segmented as below:
By Product Type
- Diagnostic devices
- Therapeutic devices
- Monitoring devices
- Assistive and rehabilitation devices
- Others
By Application
- Cardiovascular
- Orthopedic
- Diagnostic imaging
- Dental
- Others
By End-user
- Hospitals and clinics
- Diagnostic centers
- Others
By Geographical Landscape
- APAC
This study identifies the emergence of innovative medical technologies as one of the prime reasons driving the medical devices market in japan growth during the next few years. Also, rising advancements in orthopedic implants and advancements in regenerative medicine and tissue engineering will lead to sizable demand in the market.
The report on the medical devices market in japan covers the following areas:
- Medical Devices Market in Japan sizing
- Medical Devices Market in Japan forecast
- Medical Devices Market in Japan industry analysis
The robust vendor analysis is designed to help clients improve their market position, and in line with this, this report provides a detailed analysis of several leading medical devices market in japan vendors that include AI Medical Service Inc., ARKRAY Inc., ASTI Corp., B dot Medical Inc., Baxter International Inc., Becton Dickinson and Co., Canon Inc., Connect K.K., Cyfuse Biomedical K.K., F. Hoffmann La Roche Ltd., Fuji Seiko, Fukuda Sangyo Co. Ltd., GE Healthcare Technologies Inc., Hitachi Ltd., Johnson and Johnson Services Inc., Medtronic Plc, Nipro Corp., Perkin Elmer Inc., Siemens AG, and Terumo Medical Corp.. Also, the medical devices market in japan analysis report includes information on upcoming trends and challenges that will influence market growth. This is to help companies strategize and leverage all forthcoming growth opportunities.
The publisher presents a detailed picture of the market by the way of study, synthesis, and summation of data from multiple sources by an analysis of key parameters such as profit, pricing, competition, and promotions. It presents various market facets by identifying the key industry influencers. The data presented is comprehensive, reliable, and a result of extensive primary and secondary research. The market research reports provide a complete competitive landscape and an in-depth vendor selection methodology and analysis using qualitative and quantitative research to forecast accurate market growth.
Table of Contents
1 Executive Summary
- 1.1 Market overview
- Executive Summary - Chart on Market Overview
- Executive Summary - Data Table on Market Overview
- Executive Summary - Chart on Country Market Characteristics
- Executive Summary - Chart on Market Segmentation by Product Type
- Executive Summary - Chart on Market Segmentation by Application
- Executive Summary - Chart on Market Segmentation by End-user
- Executive Summary - Chart on Company Market Positioning
2 Technavio Analysis
- 2.1 Analysis of price sensitivity, lifecycle, customer purchase basket, adoption rates, and purchase criteria
- Analysis of price sensitivity, lifecycle, customer purchase basket, adoption rates, and purchase criteria
- 2.2 Criticality of inputs and Factors of differentiation
- Overview on criticality of inputs and factors of differentiation
- 2.3 Factors of disruption
- Overview on factors of disruption
- 2.4 Impact of drivers and challenges
- Impact of drivers and challenges in 2024 and 2029
3 Market Landscape
- 3.1 Market ecosystem
- Parent Market
- Data Table on - Parent Market
- 3.2 Market characteristics
- Market characteristics analysis
- 3.3 Value chain analysis
- Value chain analysis
4 Market Sizing
- 4.1 Market definition
- Offerings of companies included in the market definition
- 4.2 Market segment analysis
- Market segments
- 4.3 Market size 2024
- 4.4 Market outlook: Forecast for 2024-2029
- Chart on Japan - Market size and forecast 2024-2029 ($ million)
- Data Table on Japan - Market size and forecast 2024-2029 ($ million)
- Chart on Japan: Year-over-year growth 2024-2029 (%)
- Data Table on Japan: Year-over-year growth 2024-2029 (%)
5 Historic Market Size
- 5.1 Medical Devices Market in Japan 2019 - 2023
- Historic Market Size - Data Table on Medical Devices Market in Japan 2019 - 2023 ($ million)
- 5.2 Product Type segment analysis 2019 - 2023
- Historic Market Size - Product Type Segment 2019 - 2023 ($ million)
- 5.3 Application segment analysis 2019 - 2023
- Historic Market Size - Application Segment 2019 - 2023 ($ million)
- 5.4 End-user segment analysis 2019 - 2023
- Historic Market Size - End-user Segment 2019 - 2023 ($ million)
6 Qualitative Analysis
- 6.1 The AI impact on Medical Devices Market in Japan
7 Five Forces Analysis
- 7.1 Five forces summary
- Five forces analysis - Comparison between 2024 and 2029
- 7.2 Bargaining power of buyers
- Bargaining power of buyers - Impact of key factors 2024 and 2029
- 7.3 Bargaining power of suppliers
- Bargaining power of suppliers - Impact of key factors in 2024 and 2029
- 7.4 Threat of new entrants
- Threat of new entrants - Impact of key factors in 2024 and 2029
- 7.5 Threat of substitutes
- Threat of substitutes - Impact of key factors in 2024 and 2029
- 7.6 Threat of rivalry
- Threat of rivalry - Impact of key factors in 2024 and 2029
- 7.7 Market condition
- Chart on Market condition - Five forces 2024 and 2029
8 Market Segmentation by Product Type
- 8.1 Market segments
- Chart on Product Type - Market share 2024-2029 (%)
- Data Table on Product Type - Market share 2024-2029 (%)
- 8.2 Comparison by Product Type
- Chart on Comparison by Product Type
- Data Table on Comparison by Product Type
- 8.3 Diagnostic devices - Market size and forecast 2024-2029
- Chart on Diagnostic devices - Market size and forecast 2024-2029 ($ million)
- Data Table on Diagnostic devices - Market size and forecast 2024-2029 ($ million)
- Chart on Diagnostic devices - Year-over-year growth 2024-2029 (%)
- Data Table on Diagnostic devices - Year-over-year growth 2024-2029 (%)
- 8.4 Therapeutic devices - Market size and forecast 2024-2029
- Chart on Therapeutic devices - Market size and forecast 2024-2029 ($ million)
- Data Table on Therapeutic devices - Market size and forecast 2024-2029 ($ million)
- Chart on Therapeutic devices - Year-over-year growth 2024-2029 (%)
- Data Table on Therapeutic devices - Year-over-year growth 2024-2029 (%)
- 8.5 Monitoring devices - Market size and forecast 2024-2029
- Chart on Monitoring devices - Market size and forecast 2024-2029 ($ million)
- Data Table on Monitoring devices - Market size and forecast 2024-2029 ($ million)
- Chart on Monitoring devices - Year-over-year growth 2024-2029 (%)
- Data Table on Monitoring devices - Year-over-year growth 2024-2029 (%)
- 8.6 Assistive and rehabilitation devices - Market size and forecast 2024-2029
- Chart on Assistive and rehabilitation devices - Market size and forecast 2024-2029 ($ million)
- Data Table on Assistive and rehabilitation devices - Market size and forecast 2024-2029 ($ million)
- Chart on Assistive and rehabilitation devices - Year-over-year growth 2024-2029 (%)
- Data Table on Assistive and rehabilitation devices - Year-over-year growth 2024-2029 (%)
- 8.7 Others - Market size and forecast 2024-2029
- Chart on Others - Market size and forecast 2024-2029 ($ million)
- Data Table on Others - Market size and forecast 2024-2029 ($ million)
- Chart on Others - Year-over-year growth 2024-2029 (%)
- Data Table on Others - Year-over-year growth 2024-2029 (%)
- 8.8 Market opportunity by Product Type
- Market opportunity by Product Type ($ million)
- Data Table on Market opportunity by Product Type ($ million)
9 Market Segmentation by Application
- 9.1 Market segments
- Chart on Application - Market share 2024-2029 (%)
- Data Table on Application - Market share 2024-2029 (%)
- 9.2 Comparison by Application
- Chart on Comparison by Application
- Data Table on Comparison by Application
- 9.3 Cardiovascular - Market size and forecast 2024-2029
- Chart on Cardiovascular - Market size and forecast 2024-2029 ($ million)
- Data Table on Cardiovascular - Market size and forecast 2024-2029 ($ million)
- Chart on Cardiovascular - Year-over-year growth 2024-2029 (%)
- Data Table on Cardiovascular - Year-over-year growth 2024-2029 (%)
- 9.4 Orthopedic - Market size and forecast 2024-2029
- Chart on Orthopedic - Market size and forecast 2024-2029 ($ million)
- Data Table on Orthopedic - Market size and forecast 2024-2029 ($ million)
- Chart on Orthopedic - Year-over-year growth 2024-2029 (%)
- Data Table on Orthopedic - Year-over-year growth 2024-2029 (%)
- 9.5 Diagnostic imaging - Market size and forecast 2024-2029
- Chart on Diagnostic imaging - Market size and forecast 2024-2029 ($ million)
- Data Table on Diagnostic imaging - Market size and forecast 2024-2029 ($ million)
- Chart on Diagnostic imaging - Year-over-year growth 2024-2029 (%)
- Data Table on Diagnostic imaging - Year-over-year growth 2024-2029 (%)
- 9.6 Dental - Market size and forecast 2024-2029
- Chart on Dental - Market size and forecast 2024-2029 ($ million)
- Data Table on Dental - Market size and forecast 2024-2029 ($ million)
- Chart on Dental - Year-over-year growth 2024-2029 (%)
- Data Table on Dental - Year-over-year growth 2024-2029 (%)
- 9.7 Others - Market size and forecast 2024-2029
- Chart on Others - Market size and forecast 2024-2029 ($ million)
- Data Table on Others - Market size and forecast 2024-2029 ($ million)
- Chart on Others - Year-over-year growth 2024-2029 (%)
- Data Table on Others - Year-over-year growth 2024-2029 (%)
- 9.8 Market opportunity by Application
- Market opportunity by Application ($ million)
- Data Table on Market opportunity by Application ($ million)
10 Market Segmentation by End-user
- 10.1 Market segments
- Chart on End-user - Market share 2024-2029 (%)
- Data Table on End-user - Market share 2024-2029 (%)
- 10.2 Comparison by End-user
- Chart on Comparison by End-user
- Data Table on Comparison by End-user
- 10.3 Hospitals and clinics - Market size and forecast 2024-2029
- Chart on Hospitals and clinics - Market size and forecast 2024-2029 ($ million)
- Data Table on Hospitals and clinics - Market size and forecast 2024-2029 ($ million)
- Chart on Hospitals and clinics - Year-over-year growth 2024-2029 (%)
- Data Table on Hospitals and clinics - Year-over-year growth 2024-2029 (%)
- 10.4 Diagnostic centers - Market size and forecast 2024-2029
- Chart on Diagnostic centers - Market size and forecast 2024-2029 ($ million)
- Data Table on Diagnostic centers - Market size and forecast 2024-2029 ($ million)
- Chart on Diagnostic centers - Year-over-year growth 2024-2029 (%)
- Data Table on Diagnostic centers - Year-over-year growth 2024-2029 (%)
- 10.5 Others - Market size and forecast 2024-2029
- Chart on Others - Market size and forecast 2024-2029 ($ million)
- Data Table on Others - Market size and forecast 2024-2029 ($ million)
- Chart on Others - Year-over-year growth 2024-2029 (%)
- Data Table on Others - Year-over-year growth 2024-2029 (%)
- 10.6 Market opportunity by End-user
- Market opportunity by End-user ($ million)
- Data Table on Market opportunity by End-user ($ million)
11 Customer Landscape
- 11.1 Customer landscape overview
- Analysis of price sensitivity, lifecycle, customer purchase basket, adoption rates, and purchase criteria
12 Drivers, Challenges, and Opportunity/Restraints
- 12.1 Market drivers
- 12.2 Market challenges
- 12.3 Impact of drivers and challenges
- Impact of drivers and challenges in 2024 and 2029
- 12.4 Market opportunities/restraints
13 Competitive Landscape
- 13.1 Overview
- 13.2 Competitive Landscape
- Overview on criticality of inputs and factors of differentiation
- 13.3 Landscape disruption
- Overview on factors of disruption
- 13.4 Industry risks
- Impact of key risks on business
14 Competitive Analysis
- 14.1 Companies profiled
- Companies covered
- 14.2 Company ranking index
- Company ranking index
- 14.3 Market positioning of companies
- Matrix on companies position and classification
- 14.4 AI Medical Service Inc.
- AI Medical Service Inc. - Overview
- AI Medical Service Inc. - Product / Service
- AI Medical Service Inc. - Key offerings
- SWOT
- 14.5 ARKRAY Inc.
- ARKRAY Inc. - Overview
- ARKRAY Inc. - Product / Service
- ARKRAY Inc. - Key offerings
- SWOT
- 14.6 ASTI Corp.
- ASTI Corp. - Overview
- ASTI Corp. - Product / Service
- ASTI Corp. - Key offerings
- SWOT
- 14.7 B dot Medical Inc.
- B dot Medical Inc. - Overview
- B dot Medical Inc. - Product / Service
- B dot Medical Inc. - Key offerings
- SWOT
- 14.8 Baxter International Inc.
- Baxter International Inc. - Overview
- Baxter International Inc. - Business segments
- Baxter International Inc. - Key news
- Baxter International Inc. - Key offerings
- Baxter International Inc. - Segment focus
- SWOT
- 14.9 Becton Dickinson and Co.
- Becton Dickinson and Co. - Overview
- Becton Dickinson and Co. - Business segments
- Becton Dickinson and Co. - Key news
- Becton Dickinson and Co. - Key offerings
- Becton Dickinson and Co. - Segment focus
- SWOT
- 14.10 Canon Inc.
- Canon Inc. - Overview
- Canon Inc. - Business segments
- Canon Inc. - Key news
- Canon Inc. - Key offerings
- Canon Inc. - Segment focus
- SWOT
- 14.11 F. Hoffmann La Roche Ltd.
- F. Hoffmann La Roche Ltd. - Overview
- F. Hoffmann La Roche Ltd. - Business segments
- F. Hoffmann La Roche Ltd. - Key news
- F. Hoffmann La Roche Ltd. - Key offerings
- F. Hoffmann La Roche Ltd. - Segment focus
- SWOT
- 14.12 GE Healthcare Technologies Inc.
- GE Healthcare Technologies Inc. - Overview
- GE Healthcare Technologies Inc. - Business segments
- GE Healthcare Technologies Inc. - Key news
- GE Healthcare Technologies Inc. - Key offerings
- GE Healthcare Technologies Inc. - Segment focus
- SWOT
- 14.13 Hitachi Ltd.
- Hitachi Ltd. - Overview
- Hitachi Ltd. - Business segments
- Hitachi Ltd. - Key news
- Hitachi Ltd. - Key offerings
- Hitachi Ltd. - Segment focus
- SWOT
- 14.14 Johnson and Johnson Inc.
- Johnson and Johnson Inc. - Overview
- Johnson and Johnson Inc. - Business segments
- Johnson and Johnson Inc. - Key news
- Johnson and Johnson Inc. - Key offerings
- Johnson and Johnson Inc. - Segment focus
- SWOT
- 14.15 Medtronic Plc
- Medtronic Plc - Overview
- Medtronic Plc - Business segments
- Medtronic Plc - Key news
- Medtronic Plc - Key offerings
- Medtronic Plc - Segment focus
- SWOT
- 14.16 Nipro Corp.
- Nipro Corp. - Overview
- Nipro Corp. - Business segments
- Nipro Corp. - Key offerings
- Nipro Corp. - Segment focus
- SWOT
- 14.17 Siemens AG
- Siemens AG - Overview
- Siemens AG - Business segments
- Siemens AG - Key news
- Siemens AG - Key offerings
- Siemens AG - Segment focus
- SWOT
- 14.18 Terumo Medical Corp.
- Terumo Medical Corp. - Overview
- Terumo Medical Corp. - Product / Service
- Terumo Medical Corp. - Key offerings
- SWOT
15 Appendix
- 15.1 Scope of the report
- 15.2 Inclusions and exclusions checklist
- Inclusions checklist
- Exclusions checklist
- 15.3 Currency conversion rates for US$
- Currency conversion rates for US$
- 15.4 Research methodology
- Research methodology
- 15.5 Data procurement
- Information sources
- 15.6 Data validation
- Data validation
- 15.7 Validation techniques employed for market sizing
- Validation techniques employed for market sizing
- 15.8 Data synthesis
- Data synthesis
- 15.9 360 degree market analysis
- 360 degree market analysis
- 15.10 List of abbreviations
- List of abbreviations
