|
|
市場調査レポート
商品コード
1685582
文化観光の世界市場 2025-2029Global Cultural Tourism Market 2025-2029 |
||||||

|
|||||||
カスタマイズ可能
|
|||||||


| 文化観光の世界市場 2025-2029 |
|
出版日: 2025年03月14日
発行: TechNavio
ページ情報: 英文 220 Pages
納期: 即納可能
|

全表示
- 概要
- 図表
- 目次
文化観光市場は2024年から2029年に84億1,290万米ドル、予測期間中のCAGRは18.4%で成長すると予測されます。
当レポートでは、文化観光市場の全体的な分析、市場規模・予測、動向、成長促進要因、課題、約25のベンダーを網羅したベンダー分析などを掲載しています。
現在の市場シナリオ、最新動向と促進要因、市場環境全体に関する最新分析を提供しています。市場は、ストレスに関連する事例の増加、平凡なライフスタイルを打破するための文化観光への選好の高まり、GDPおよび雇用に対する文化観光の貢献度の高まりによって牽引されています。
| 市場範囲 | |
|---|---|
| 基準年 | 2025年 |
| 終了年 | 2029年 |
| 予測期間 | 2025年~2029年 |
| 成長モメンタム | 加速 |
| 前年比2025年 | 16.9% |
| CAGR | 18.4% |
| 増分額 | 84億1,290万米ドル |
本調査は、業界の主要参加者からのインプットを含め、一次情報と二次情報を客観的に組み合わせて実施しました。レポートには、主要企業の分析に加え、包括的な市場規模データ、地域分析によるセグメント、ベンダー情勢が含まれています。レポートには実績データと予測データがあります。
本調査では、今後数年間の文化観光市場の成長を促進する主な理由の1つとして、文化観光におけるARおよびVR技術への需要の増加を挙げています。また、可処分所得の増加による消費者の消費力の向上や、文化観光の普及に向けた政府の取り組みも、市場の大きな需要につながると考えられています。
目次
第1章 エグゼクティブサマリー
- 市場概要
第2章 Technavio分析
- 価格感応性・ライフサイクル・顧客購入バスケット・採用率・購入基準の分析
- インプットの重要性と差別化の要因
- 混乱の要因
- 促進要因と課題の影響
第3章 市場情勢
- 市場エコシステム
- 市場の特徴
- バリューチェーン分析
第4章 市場規模
- 市場の定義
- 市場セグメント分析
- 市場規模、2024年
- 市場の見通し、2024年~2029年
第5章 市場規模実績
- 世界の文化観光市場、2019年~2023年
- タイプセグメント分析、2019年~2023年
- サービスセグメント分析、2019年~2023年
- 用途セグメント分析、2019年~2023年
- 地域別セグメント分析、2019年~2023年
- 国別セグメント分析、2019年~2023年
第6章 定性分析
- AIの影響:世界の文化観光市場
第7章 ファイブフォース分析
- ファイブフォースの要約
- 買い手の交渉力
- 供給企業の交渉力
- 新規参入業者の脅威
- 代替品の脅威
- 競争の脅威
- 市況
第8章 市場セグメンテーション:タイプ別
- 市場セグメント
- 比較:タイプ別
- 国内文化観光:市場規模と予測、2024年~2029年
- 国際文化観光:市場規模と予測、2024年~2029年
- 市場機会:タイプ別
第9章 市場セグメンテーション:サービス別
- 市場セグメント
- 比較:サービス別
- 文化エコツーリズム:市場規模と予測、2024年~2029年
- 先住民族の文化観光:市場規模と予測、2024年~2029年
- 社会文化観光:市場規模と予測、2024年~2029年
- 市場機会:サービス別
第10章 市場セグメンテーション:用途別
- 市場セグメント
- 比較:用途別
- レジャー:市場規模と予測、2024年~2029年
- 宗教的な巡礼:市場規模と予測、2024年~2029年
- 教育:市場規模と予測、2024年~2029年
- 研究:市場規模と予測、2024年~2029年
- 市場機会:用途別
第11章 顧客情勢
- 顧客情勢の概要
第12章 地域別情勢
- 地域別セグメンテーション
- 地域別比較
- 欧州:市場規模と予測、2024年~2029年
- アジア太平洋:市場規模と予測、2024年~2029年
- 北米:市場規模と予測、2024年~2029年
- 南米:市場規模と予測、2024年~2029年
- 中東・アフリカ:市場規模と予測、2024年~2029年
- 米国:市場規模と予測、2024年~2029年
- 中国:市場規模と予測、2024年~2029年
- フランス:市場規模と予測、2024年~2029年
- スペイン:市場規模と予測、2024年~2029年
- 日本:市場規模と予測、2024年~2029年
- イタリア:市場規模と予測、2024年~2029年
- インド:市場規模と予測、2024年~2029年
- 英国:市場規模と予測、2024年~2029年
- ドイツ:市場規模と予測、2024年~2029年
- ブラジル:市場規模と予測、2024年~2029年
- 市場機会:地域情勢別
第13章 促進要因・課題・機会・抑制要因
- 市場促進要因
- 市場の課題
- 促進要因と課題の影響
- 市場の機会・抑制要因
第14章 競合情勢
- 概要
- 競合情勢
- 混乱の状況
- 業界のリスク
第15章 競合分析
- 企業プロファイル
- 企業ランキング指数
- 企業の市場ポジショニング
- ACE Cultural Tours Ltd
- Aracari Travel
- Envoy Tours
- Exodus Travels Ltd.
- G Adventures
- Geographic Expeditions Inc.
- Indigenous Tourism BC
- Intrepid Group Pty Ltd.
- JPMorgan Chase and Co.
- Kudu Travel Ltd.
- Lindblad Expeditions Holdings Inc.
- Martin Randall Travel Ltd
- Odyssey World
- Responsible Travel
- Travel Leaders Group Holdings LLC
第16章 付録
Exhibits:
- Exhibits1: Executive Summary - Chart on Market Overview
- Exhibits2: Executive Summary - Data Table on Market Overview
- Exhibits3: Executive Summary - Chart on Global Market Characteristics
- Exhibits4: Executive Summary - Chart on Market By Geographical Landscape
- Exhibits5: Executive Summary - Chart on Market Segmentation by Type
- Exhibits6: Executive Summary - Chart on Market Segmentation by Service
- Exhibits7: Executive Summary - Chart on Market Segmentation by Application
- Exhibits8: Executive Summary - Chart on Incremental Growth
- Exhibits9: Executive Summary - Data Table on Incremental Growth
- Exhibits10: Executive Summary - Chart on Company Market Positioning
- Exhibits11: Analysis of price sensitivity, lifecycle, customer purchase basket, adoption rates, and purchase criteria
- Exhibits12: Overview on criticality of inputs and factors of differentiation
- Exhibits13: Overview on factors of disruption
- Exhibits14: Impact of drivers and challenges in 2024 and 2029
- Exhibits15: Parent Market
- Exhibits16: Data Table on - Parent Market
- Exhibits17: Market characteristics analysis
- Exhibits18: Value chain analysis
- Exhibits19: Offerings of companies included in the market definition
- Exhibits20: Market segments
- Exhibits21: Chart on Global - Market size and forecast 2024-2029 ($ million)
- Exhibits22: Data Table on Global - Market size and forecast 2024-2029 ($ million)
- Exhibits23: Chart on Global Market: Year-over-year growth 2024-2029 (%)
- Exhibits24: Data Table on Global Market: Year-over-year growth 2024-2029 (%)
- Exhibits25: Historic Market Size - Data Table on Global Cultural Tourism Market 2019 - 2023 ($ million)
- Exhibits26: Historic Market Size - Type Segment 2019 - 2023 ($ million)
- Exhibits27: Historic Market Size - Service Segment 2019 - 2023 ($ million)
- Exhibits28: Historic Market Size - Application Segment 2019 - 2023 ($ million)
- Exhibits29: Historic Market Size - Geography Segment 2019 - 2023 ($ million)
- Exhibits30: Historic Market Size - Country Segment 2019 - 2023 ($ million)
- Exhibits31: Five forces analysis - Comparison between 2024 and 2029
- Exhibits32: Bargaining power of buyers - Impact of key factors 2024 and 2029
- Exhibits33: Bargaining power of suppliers - Impact of key factors in 2024 and 2029
- Exhibits34: Threat of new entrants - Impact of key factors in 2024 and 2029
- Exhibits35: Threat of substitutes - Impact of key factors in 2024 and 2029
- Exhibits36: Threat of rivalry - Impact of key factors in 2024 and 2029
- Exhibits37: Chart on Market condition - Five forces 2024 and 2029
- Exhibits38: Chart on Type - Market share 2024-2029 (%)
- Exhibits39: Data Table on Type - Market share 2024-2029 (%)
- Exhibits40: Chart on Comparison by Type
- Exhibits41: Data Table on Comparison by Type
- Exhibits42: Chart on Domestic cultural tourism - Market size and forecast 2024-2029 ($ million)
- Exhibits43: Data Table on Domestic cultural tourism - Market size and forecast 2024-2029 ($ million)
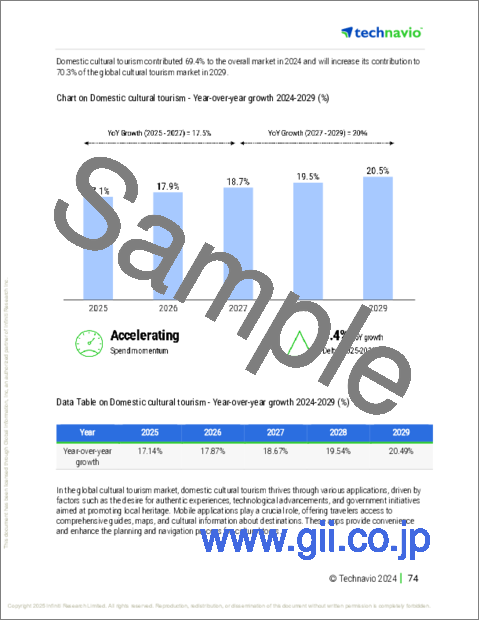
- Exhibits44: Chart on Domestic cultural tourism - Year-over-year growth 2024-2029 (%)
- Exhibits45: Data Table on Domestic cultural tourism - Year-over-year growth 2024-2029 (%)
- Exhibits46: Chart on International cultural tourism - Market size and forecast 2024-2029 ($ million)
- Exhibits47: Data Table on International cultural tourism - Market size and forecast 2024-2029 ($ million)
- Exhibits48: Chart on International cultural tourism - Year-over-year growth 2024-2029 (%)
- Exhibits49: Data Table on International cultural tourism - Year-over-year growth 2024-2029 (%)
- Exhibits50: Market opportunity by Type ($ million)
- Exhibits51: Data Table on Market opportunity by Type ($ million)
- Exhibits52: Chart on Service - Market share 2024-2029 (%)
- Exhibits53: Data Table on Service - Market share 2024-2029 (%)
- Exhibits54: Chart on Comparison by Service
- Exhibits55: Data Table on Comparison by Service
- Exhibits56: Chart on Cultural eco-tourism - Market size and forecast 2024-2029 ($ million)
- Exhibits57: Data Table on Cultural eco-tourism - Market size and forecast 2024-2029 ($ million)
- Exhibits58: Chart on Cultural eco-tourism - Year-over-year growth 2024-2029 (%)
- Exhibits59: Data Table on Cultural eco-tourism - Year-over-year growth 2024-2029 (%)
- Exhibits60: Chart on Indigenous cultural tourism - Market size and forecast 2024-2029 ($ million)
- Exhibits61: Data Table on Indigenous cultural tourism - Market size and forecast 2024-2029 ($ million)
- Exhibits62: Chart on Indigenous cultural tourism - Year-over-year growth 2024-2029 (%)
- Exhibits63: Data Table on Indigenous cultural tourism - Year-over-year growth 2024-2029 (%)
- Exhibits64: Chart on Socio-cultural tourism - Market size and forecast 2024-2029 ($ million)
- Exhibits65: Data Table on Socio-cultural tourism - Market size and forecast 2024-2029 ($ million)
- Exhibits66: Chart on Socio-cultural tourism - Year-over-year growth 2024-2029 (%)
- Exhibits67: Data Table on Socio-cultural tourism - Year-over-year growth 2024-2029 (%)
- Exhibits68: Market opportunity by Service ($ million)
- Exhibits69: Data Table on Market opportunity by Service ($ million)
- Exhibits70: Chart on Application - Market share 2024-2029 (%)
- Exhibits71: Data Table on Application - Market share 2024-2029 (%)
- Exhibits72: Chart on Comparison by Application
- Exhibits73: Data Table on Comparison by Application
- Exhibits74: Chart on Leisure - Market size and forecast 2024-2029 ($ million)
- Exhibits75: Data Table on Leisure - Market size and forecast 2024-2029 ($ million)
- Exhibits76: Chart on Leisure - Year-over-year growth 2024-2029 (%)
- Exhibits77: Data Table on Leisure - Year-over-year growth 2024-2029 (%)
- Exhibits78: Chart on Religious pilgrimage - Market size and forecast 2024-2029 ($ million)
- Exhibits79: Data Table on Religious pilgrimage - Market size and forecast 2024-2029 ($ million)
- Exhibits80: Chart on Religious pilgrimage - Year-over-year growth 2024-2029 (%)
- Exhibits81: Data Table on Religious pilgrimage - Year-over-year growth 2024-2029 (%)
- Exhibits82: Chart on Education - Market size and forecast 2024-2029 ($ million)
- Exhibits83: Data Table on Education - Market size and forecast 2024-2029 ($ million)
- Exhibits84: Chart on Education - Year-over-year growth 2024-2029 (%)
- Exhibits85: Data Table on Education - Year-over-year growth 2024-2029 (%)
- Exhibits86: Chart on Research - Market size and forecast 2024-2029 ($ million)
- Exhibits87: Data Table on Research - Market size and forecast 2024-2029 ($ million)
- Exhibits88: Chart on Research - Year-over-year growth 2024-2029 (%)
- Exhibits89: Data Table on Research - Year-over-year growth 2024-2029 (%)
- Exhibits90: Market opportunity by Application ($ million)
- Exhibits91: Data Table on Market opportunity by Application ($ million)
- Exhibits92: Analysis of price sensitivity, lifecycle, customer purchase basket, adoption rates, and purchase criteria
- Exhibits93: Chart on Market share By Geographical Landscape 2024-2029 (%)
- Exhibits94: Data Table on Market share By Geographical Landscape 2024-2029 (%)
- Exhibits95: Chart on Geographic comparison
- Exhibits96: Data Table on Geographic comparison
- Exhibits97: Chart on Europe - Market size and forecast 2024-2029 ($ million)
- Exhibits98: Data Table on Europe - Market size and forecast 2024-2029 ($ million)
- Exhibits99: Chart on Europe - Year-over-year growth 2024-2029 (%)
- Exhibits100: Data Table on Europe - Year-over-year growth 2024-2029 (%)
- Exhibits101: Chart on APAC - Market size and forecast 2024-2029 ($ million)
- Exhibits102: Data Table on APAC - Market size and forecast 2024-2029 ($ million)
- Exhibits103: Chart on APAC - Year-over-year growth 2024-2029 (%)
- Exhibits104: Data Table on APAC - Year-over-year growth 2024-2029 (%)
- Exhibits105: Chart on North America - Market size and forecast 2024-2029 ($ million)
- Exhibits106: Data Table on North America - Market size and forecast 2024-2029 ($ million)
- Exhibits107: Chart on North America - Year-over-year growth 2024-2029 (%)
- Exhibits108: Data Table on North America - Year-over-year growth 2024-2029 (%)
- Exhibits109: Chart on South America - Market size and forecast 2024-2029 ($ million)
- Exhibits110: Data Table on South America - Market size and forecast 2024-2029 ($ million)
- Exhibits111: Chart on South America - Year-over-year growth 2024-2029 (%)
- Exhibits112: Data Table on South America - Year-over-year growth 2024-2029 (%)
- Exhibits113: Chart on Middle East and Africa - Market size and forecast 2024-2029 ($ million)
- Exhibits114: Data Table on Middle East and Africa - Market size and forecast 2024-2029 ($ million)
- Exhibits115: Chart on Middle East and Africa - Year-over-year growth 2024-2029 (%)
- Exhibits116: Data Table on Middle East and Africa - Year-over-year growth 2024-2029 (%)
- Exhibits117: Chart on US - Market size and forecast 2024-2029 ($ million)
- Exhibits118: Data Table on US - Market size and forecast 2024-2029 ($ million)
- Exhibits119: Chart on US - Year-over-year growth 2024-2029 (%)
- Exhibits120: Data Table on US - Year-over-year growth 2024-2029 (%)
- Exhibits121: Chart on China - Market size and forecast 2024-2029 ($ million)
- Exhibits122: Data Table on China - Market size and forecast 2024-2029 ($ million)
- Exhibits123: Chart on China - Year-over-year growth 2024-2029 (%)
- Exhibits124: Data Table on China - Year-over-year growth 2024-2029 (%)
- Exhibits125: Chart on France - Market size and forecast 2024-2029 ($ million)
- Exhibits126: Data Table on France - Market size and forecast 2024-2029 ($ million)
- Exhibits127: Chart on France - Year-over-year growth 2024-2029 (%)
- Exhibits128: Data Table on France - Year-over-year growth 2024-2029 (%)
- Exhibits129: Chart on Spain - Market size and forecast 2024-2029 ($ million)
- Exhibits130: Data Table on Spain - Market size and forecast 2024-2029 ($ million)
- Exhibits131: Chart on Spain - Year-over-year growth 2024-2029 (%)
- Exhibits132: Data Table on Spain - Year-over-year growth 2024-2029 (%)
- Exhibits133: Chart on Japan - Market size and forecast 2024-2029 ($ million)
- Exhibits134: Data Table on Japan - Market size and forecast 2024-2029 ($ million)
- Exhibits135: Chart on Japan - Year-over-year growth 2024-2029 (%)
- Exhibits136: Data Table on Japan - Year-over-year growth 2024-2029 (%)
- Exhibits137: Chart on Italy - Market size and forecast 2024-2029 ($ million)
- Exhibits138: Data Table on Italy - Market size and forecast 2024-2029 ($ million)
- Exhibits139: Chart on Italy - Year-over-year growth 2024-2029 (%)
- Exhibits140: Data Table on Italy - Year-over-year growth 2024-2029 (%)
- Exhibits141: Chart on India - Market size and forecast 2024-2029 ($ million)
- Exhibits142: Data Table on India - Market size and forecast 2024-2029 ($ million)
- Exhibits143: Chart on India - Year-over-year growth 2024-2029 (%)
- Exhibits144: Data Table on India - Year-over-year growth 2024-2029 (%)
- Exhibits145: Chart on UK - Market size and forecast 2024-2029 ($ million)
- Exhibits146: Data Table on UK - Market size and forecast 2024-2029 ($ million)
- Exhibits147: Chart on UK - Year-over-year growth 2024-2029 (%)
- Exhibits148: Data Table on UK - Year-over-year growth 2024-2029 (%)
- Exhibits149: Chart on Germany - Market size and forecast 2024-2029 ($ million)
- Exhibits150: Data Table on Germany - Market size and forecast 2024-2029 ($ million)
- Exhibits151: Chart on Germany - Year-over-year growth 2024-2029 (%)
- Exhibits152: Data Table on Germany - Year-over-year growth 2024-2029 (%)
- Exhibits153: Chart on Brazil - Market size and forecast 2024-2029 ($ million)
- Exhibits154: Data Table on Brazil - Market size and forecast 2024-2029 ($ million)
- Exhibits155: Chart on Brazil - Year-over-year growth 2024-2029 (%)
- Exhibits156: Data Table on Brazil - Year-over-year growth 2024-2029 (%)
- Exhibits157: Market opportunity By Geographical Landscape ($ million)
- Exhibits158: Data Tables on Market opportunity By Geographical Landscape ($ million)
- Exhibits159: Impact of drivers and challenges in 2024 and 2029
- Exhibits160: Overview on criticality of inputs and factors of differentiation
- Exhibits161: Overview on factors of disruption
- Exhibits162: Impact of key risks on business
- Exhibits163: Companies covered
- Exhibits164: Company ranking index
- Exhibits165: Matrix on companies position and classification
- Exhibits166: ACE Cultural Tours Ltd - Overview
- Exhibits167: ACE Cultural Tours Ltd - Product / Service
- Exhibits168: ACE Cultural Tours Ltd - Key offerings
- Exhibits169: SWOT
- Exhibits170: Aracari Travel - Overview
- Exhibits171: Aracari Travel - Product / Service
- Exhibits172: Aracari Travel - Key offerings
- Exhibits173: SWOT
- Exhibits174: Envoy Tours - Overview
- Exhibits175: Envoy Tours - Product / Service
- Exhibits176: Envoy Tours - Key offerings
- Exhibits177: SWOT
- Exhibits178: Exodus Travels Ltd. - Overview
- Exhibits179: Exodus Travels Ltd. - Product / Service
- Exhibits180: Exodus Travels Ltd. - Key offerings
- Exhibits181: SWOT
- Exhibits182: G Adventures - Overview
- Exhibits183: G Adventures - Product / Service
- Exhibits184: G Adventures - Key offerings
- Exhibits185: SWOT
- Exhibits186: Geographic Expeditions Inc. - Overview
- Exhibits187: Geographic Expeditions Inc. - Product / Service
- Exhibits188: Geographic Expeditions Inc. - Key offerings
- Exhibits189: SWOT
- Exhibits190: Indigenous Tourism BC - Overview
- Exhibits191: Indigenous Tourism BC - Product / Service
- Exhibits192: Indigenous Tourism BC - Key offerings
- Exhibits193: SWOT
- Exhibits194: Intrepid Group Pty Ltd. - Overview
- Exhibits195: Intrepid Group Pty Ltd. - Product / Service
- Exhibits196: Intrepid Group Pty Ltd. - Key offerings
- Exhibits197: SWOT
- Exhibits198: JPMorgan Chase and Co. - Overview
- Exhibits199: JPMorgan Chase and Co. - Business segments
- Exhibits200: JPMorgan Chase and Co. - Key news
- Exhibits201: JPMorgan Chase and Co. - Key offerings
- Exhibits202: JPMorgan Chase and Co. - Segment focus
- Exhibits203: SWOT
- Exhibits204: Kudu Travel Ltd. - Overview
- Exhibits205: Kudu Travel Ltd. - Product / Service
- Exhibits206: Kudu Travel Ltd. - Key offerings
- Exhibits207: SWOT
- Exhibits208: Lindblad Expeditions Holdings Inc. - Overview
- Exhibits209: Lindblad Expeditions Holdings Inc. - Business segments
- Exhibits210: Lindblad Expeditions Holdings Inc. - Key offerings
- Exhibits211: Lindblad Expeditions Holdings Inc. - Segment focus
- Exhibits212: SWOT
- Exhibits213: Martin Randall Travel Ltd - Overview
- Exhibits214: Martin Randall Travel Ltd - Product / Service
- Exhibits215: Martin Randall Travel Ltd - Key offerings
- Exhibits216: SWOT
- Exhibits217: Odyssey World - Overview
- Exhibits218: Odyssey World - Product / Service
- Exhibits219: Odyssey World - Key offerings
- Exhibits220: SWOT
- Exhibits221: Responsible Travel - Overview
- Exhibits222: Responsible Travel - Product / Service
- Exhibits223: Responsible Travel - Key offerings
- Exhibits224: SWOT
- Exhibits225: Travel Leaders Group Holdings LLC - Overview
- Exhibits226: Travel Leaders Group Holdings LLC - Product / Service
- Exhibits227: Travel Leaders Group Holdings LLC - Key offerings
- Exhibits228: SWOT
- Exhibits229: Inclusions checklist
- Exhibits230: Exclusions checklist
- Exhibits231: Currency conversion rates for US$
- Exhibits232: Research methodology
- Exhibits233: Information sources
- Exhibits234: Data validation
- Exhibits235: Validation techniques employed for market sizing
- Exhibits236: Data synthesis
- Exhibits237: 360 degree market analysis
- Exhibits238: List of abbreviations
The cultural tourism market is forecasted to grow by USD 8412.9 million during 2024-2029, accelerating at a CAGR of 18.4% during the forecast period. The report on the cultural tourism market provides a holistic analysis, market size and forecast, trends, growth drivers, and challenges, as well as vendor analysis covering around 25 vendors.
The report offers an up-to-date analysis regarding the current market scenario, the latest trends and drivers, and the overall market environment. The market is driven by growing instances of stress-related cases, increased preference for cultural tourism to break mundane lifestyle, and growing contribution of cultural tourism toward gdp and employment.
| Market Scope | |
|---|---|
| Base Year | 2025 |
| End Year | 2029 |
| Series Year | 2025-2029 |
| Growth Momentum | Accelerate |
| YOY 2025 | 16.9% |
| CAGR | 18.4% |
| Incremental Value | $8412.9 mn |
The study was conducted using an objective combination of primary and secondary information including inputs from key participants in the industry. The report contains a comprehensive market size data, segment with regional analysis and vendor landscape in addition to an analysis of the key companies. Reports have historic and forecast data.
Technavio's cultural tourism market is segmented as below:
By Type
- Domestic cultural tourism
- International cultural tourism
By Service
- Cultural eco-tourism
- Indigenous cultural tourism
- Socio-cultural tourism
By Application
- Leisure
- Religious pilgrimage
- Education
- Research
By Geographical Landscape
- Europe
- APAC
- North America
- South America
- Middle East and Africa
This study identifies the increasing demand for AR and VR technology in cultural tourism as one of the prime reasons driving the cultural tourism market growth during the next few years. Also, rise in disposable income increasing spending power of consumers and government initiatives toward promoting cultural tourism will lead to sizable demand in the market.
The report on the cultural tourism market covers the following areas:
- Cultural Tourism Market sizing
- Cultural Tourism Market forecast
- Cultural Tourism Market industry analysis
The robust vendor analysis is designed to help clients improve their market position, and in line with this, this report provides a detailed analysis of several leading cultural tourism market vendors that include ACE Cultural Tours Ltd., Aracari Travel, Envoy Tours, Exodus Travels Ltd., G Adventures, Geographic Expeditions Inc., Greaves Travel Ltd., Indigenous Tourism BC, Intrepid Group Pty Ltd., JPMorgan Chase and Co., Kudu Travel Ltd., Lindblad Expeditions Holdings Inc., Martin Randall Travel Ltd, Odyssey World, Responsible Travel, Tandem Travel OOD, Tauck, Travel Leaders Group Holdings LLC, Travelogy India Pvt. Ltd., and Wilderness Travel. Also, the cultural tourism market analysis report includes information on upcoming trends and challenges that will influence market growth. This is to help companies strategize and leverage all forthcoming growth opportunities.
The publisher presents a detailed picture of the market by the way of study, synthesis, and summation of data from multiple sources by an analysis of key parameters such as profit, pricing, competition, and promotions. It presents various market facets by identifying the key industry influencers. The data presented is comprehensive, reliable, and a result of extensive primary and secondary research. The market research reports provide a complete competitive landscape and an in-depth vendor selection methodology and analysis using qualitative and quantitative research to forecast accurate market growth.
Table of Contents
1 Executive Summary
- 1.1 Market overview
- Executive Summary - Chart on Market Overview
- Executive Summary - Data Table on Market Overview
- Executive Summary - Chart on Global Market Characteristics
- Executive Summary - Chart on Market By Geographical Landscape
- Executive Summary - Chart on Market Segmentation by Type
- Executive Summary - Chart on Market Segmentation by Service
- Executive Summary - Chart on Market Segmentation by Application
- Executive Summary - Chart on Incremental Growth
- Executive Summary - Data Table on Incremental Growth
- Executive Summary - Chart on Company Market Positioning
2 Technavio Analysis
- 2.1 Analysis of price sensitivity, lifecycle, customer purchase basket, adoption rates, and purchase criteria
- Analysis of price sensitivity, lifecycle, customer purchase basket, adoption rates, and purchase criteria
- 2.2 Criticality of inputs and Factors of differentiation
- Overview on criticality of inputs and factors of differentiation
- 2.3 Factors of disruption
- Overview on factors of disruption
- 2.4 Impact of drivers and challenges
- Impact of drivers and challenges in 2024 and 2029
3 Market Landscape
- 3.1 Market ecosystem
- Parent Market
- Data Table on - Parent Market
- 3.2 Market characteristics
- Market characteristics analysis
- 3.3 Value chain analysis
- Value chain analysis
4 Market Sizing
- 4.1 Market definition
- Offerings of companies included in the market definition
- 4.2 Market segment analysis
- Market segments
- 4.3 Market size 2024
- 4.4 Market outlook: Forecast for 2024-2029
- Chart on Global - Market size and forecast 2024-2029 ($ million)
- Data Table on Global - Market size and forecast 2024-2029 ($ million)
- Chart on Global Market: Year-over-year growth 2024-2029 (%)
- Data Table on Global Market: Year-over-year growth 2024-2029 (%)
5 Historic Market Size
- 5.1 Global Cultural Tourism Market 2019 - 2023
- Historic Market Size - Data Table on Global Cultural Tourism Market 2019 - 2023 ($ million)
- 5.2 Type segment analysis 2019 - 2023
- Historic Market Size - Type Segment 2019 - 2023 ($ million)
- 5.3 Service segment analysis 2019 - 2023
- Historic Market Size - Service Segment 2019 - 2023 ($ million)
- 5.4 Application segment analysis 2019 - 2023
- Historic Market Size - Application Segment 2019 - 2023 ($ million)
- 5.5 Geography segment analysis 2019 - 2023
- Historic Market Size - Geography Segment 2019 - 2023 ($ million)
- 5.6 Country segment analysis 2019 - 2023
- Historic Market Size - Country Segment 2019 - 2023 ($ million)
6 Qualitative Analysis
- 6.1 Impact of AI on global cultural tourism market
7 Five Forces Analysis
- 7.1 Five forces summary
- Five forces analysis - Comparison between 2024 and 2029
- 7.2 Bargaining power of buyers
- Bargaining power of buyers - Impact of key factors 2024 and 2029
- 7.3 Bargaining power of suppliers
- Bargaining power of suppliers - Impact of key factors in 2024 and 2029
- 7.4 Threat of new entrants
- Threat of new entrants - Impact of key factors in 2024 and 2029
- 7.5 Threat of substitutes
- Threat of substitutes - Impact of key factors in 2024 and 2029
- 7.6 Threat of rivalry
- Threat of rivalry - Impact of key factors in 2024 and 2029
- 7.7 Market condition
- Chart on Market condition - Five forces 2024 and 2029
8 Market Segmentation by Type
- 8.1 Market segments
- Chart on Type - Market share 2024-2029 (%)
- Data Table on Type - Market share 2024-2029 (%)
- 8.2 Comparison by Type
- Chart on Comparison by Type
- Data Table on Comparison by Type
- 8.3 Domestic cultural tourism - Market size and forecast 2024-2029
- Chart on Domestic cultural tourism - Market size and forecast 2024-2029 ($ million)
- Data Table on Domestic cultural tourism - Market size and forecast 2024-2029 ($ million)
- Chart on Domestic cultural tourism - Year-over-year growth 2024-2029 (%)
- Data Table on Domestic cultural tourism - Year-over-year growth 2024-2029 (%)
- 8.4 International cultural tourism - Market size and forecast 2024-2029
- Chart on International cultural tourism - Market size and forecast 2024-2029 ($ million)
- Data Table on International cultural tourism - Market size and forecast 2024-2029 ($ million)
- Chart on International cultural tourism - Year-over-year growth 2024-2029 (%)
- Data Table on International cultural tourism - Year-over-year growth 2024-2029 (%)
- 8.5 Market opportunity by Type
- Market opportunity by Type ($ million)
- Data Table on Market opportunity by Type ($ million)
9 Market Segmentation by Service
- 9.1 Market segments
- Chart on Service - Market share 2024-2029 (%)
- Data Table on Service - Market share 2024-2029 (%)
- 9.2 Comparison by Service
- Chart on Comparison by Service
- Data Table on Comparison by Service
- 9.3 Cultural eco-tourism - Market size and forecast 2024-2029
- Chart on Cultural eco-tourism - Market size and forecast 2024-2029 ($ million)
- Data Table on Cultural eco-tourism - Market size and forecast 2024-2029 ($ million)
- Chart on Cultural eco-tourism - Year-over-year growth 2024-2029 (%)
- Data Table on Cultural eco-tourism - Year-over-year growth 2024-2029 (%)
- 9.4 Indigenous cultural tourism - Market size and forecast 2024-2029
- Chart on Indigenous cultural tourism - Market size and forecast 2024-2029 ($ million)
- Data Table on Indigenous cultural tourism - Market size and forecast 2024-2029 ($ million)
- Chart on Indigenous cultural tourism - Year-over-year growth 2024-2029 (%)
- Data Table on Indigenous cultural tourism - Year-over-year growth 2024-2029 (%)
- 9.5 Socio-cultural tourism - Market size and forecast 2024-2029
- Chart on Socio-cultural tourism - Market size and forecast 2024-2029 ($ million)
- Data Table on Socio-cultural tourism - Market size and forecast 2024-2029 ($ million)
- Chart on Socio-cultural tourism - Year-over-year growth 2024-2029 (%)
- Data Table on Socio-cultural tourism - Year-over-year growth 2024-2029 (%)
- 9.6 Market opportunity by Service
- Market opportunity by Service ($ million)
- Data Table on Market opportunity by Service ($ million)
10 Market Segmentation by Application
- 10.1 Market segments
- Chart on Application - Market share 2024-2029 (%)
- Data Table on Application - Market share 2024-2029 (%)
- 10.2 Comparison by Application
- Chart on Comparison by Application
- Data Table on Comparison by Application
- 10.3 Leisure - Market size and forecast 2024-2029
- Chart on Leisure - Market size and forecast 2024-2029 ($ million)
- Data Table on Leisure - Market size and forecast 2024-2029 ($ million)
- Chart on Leisure - Year-over-year growth 2024-2029 (%)
- Data Table on Leisure - Year-over-year growth 2024-2029 (%)
- 10.4 Religious pilgrimage - Market size and forecast 2024-2029
- Chart on Religious pilgrimage - Market size and forecast 2024-2029 ($ million)
- Data Table on Religious pilgrimage - Market size and forecast 2024-2029 ($ million)
- Chart on Religious pilgrimage - Year-over-year growth 2024-2029 (%)
- Data Table on Religious pilgrimage - Year-over-year growth 2024-2029 (%)
- 10.5 Education - Market size and forecast 2024-2029
- Chart on Education - Market size and forecast 2024-2029 ($ million)
- Data Table on Education - Market size and forecast 2024-2029 ($ million)
- Chart on Education - Year-over-year growth 2024-2029 (%)
- Data Table on Education - Year-over-year growth 2024-2029 (%)
- 10.6 Research - Market size and forecast 2024-2029
- Chart on Research - Market size and forecast 2024-2029 ($ million)
- Data Table on Research - Market size and forecast 2024-2029 ($ million)
- Chart on Research - Year-over-year growth 2024-2029 (%)
- Data Table on Research - Year-over-year growth 2024-2029 (%)
- 10.7 Market opportunity by Application
- Market opportunity by Application ($ million)
- Data Table on Market opportunity by Application ($ million)
11 Customer Landscape
- 11.1 Customer landscape overview
- Analysis of price sensitivity, lifecycle, customer purchase basket, adoption rates, and purchase criteria
12 Geographic Landscape
- 12.1 Geographic segmentation
- Chart on Market share By Geographical Landscape 2024-2029 (%)
- Data Table on Market share By Geographical Landscape 2024-2029 (%)
- 12.2 Geographic comparison
- Chart on Geographic comparison
- Data Table on Geographic comparison
- 12.3 Europe - Market size and forecast 2024-2029
- Chart on Europe - Market size and forecast 2024-2029 ($ million)
- Data Table on Europe - Market size and forecast 2024-2029 ($ million)
- Chart on Europe - Year-over-year growth 2024-2029 (%)
- Data Table on Europe - Year-over-year growth 2024-2029 (%)
- 12.4 APAC - Market size and forecast 2024-2029
- Chart on APAC - Market size and forecast 2024-2029 ($ million)
- Data Table on APAC - Market size and forecast 2024-2029 ($ million)
- Chart on APAC - Year-over-year growth 2024-2029 (%)
- Data Table on APAC - Year-over-year growth 2024-2029 (%)
- 12.5 North America - Market size and forecast 2024-2029
- Chart on North America - Market size and forecast 2024-2029 ($ million)
- Data Table on North America - Market size and forecast 2024-2029 ($ million)
- Chart on North America - Year-over-year growth 2024-2029 (%)
- Data Table on North America - Year-over-year growth 2024-2029 (%)
- 12.6 South America - Market size and forecast 2024-2029
- Chart on South America - Market size and forecast 2024-2029 ($ million)
- Data Table on South America - Market size and forecast 2024-2029 ($ million)
- Chart on South America - Year-over-year growth 2024-2029 (%)
- Data Table on South America - Year-over-year growth 2024-2029 (%)
- 12.7 Middle East and Africa - Market size and forecast 2024-2029
- Chart on Middle East and Africa - Market size and forecast 2024-2029 ($ million)
- Data Table on Middle East and Africa - Market size and forecast 2024-2029 ($ million)
- Chart on Middle East and Africa - Year-over-year growth 2024-2029 (%)
- Data Table on Middle East and Africa - Year-over-year growth 2024-2029 (%)
- 12.8 US - Market size and forecast 2024-2029
- Chart on US - Market size and forecast 2024-2029 ($ million)
- Data Table on US - Market size and forecast 2024-2029 ($ million)
- Chart on US - Year-over-year growth 2024-2029 (%)
- Data Table on US - Year-over-year growth 2024-2029 (%)
- 12.9 China - Market size and forecast 2024-2029
- Chart on China - Market size and forecast 2024-2029 ($ million)
- Data Table on China - Market size and forecast 2024-2029 ($ million)
- Chart on China - Year-over-year growth 2024-2029 (%)
- Data Table on China - Year-over-year growth 2024-2029 (%)
- 12.10 France - Market size and forecast 2024-2029
- Chart on France - Market size and forecast 2024-2029 ($ million)
- Data Table on France - Market size and forecast 2024-2029 ($ million)
- Chart on France - Year-over-year growth 2024-2029 (%)
- Data Table on France - Year-over-year growth 2024-2029 (%)
- 12.11 Spain - Market size and forecast 2024-2029
- Chart on Spain - Market size and forecast 2024-2029 ($ million)
- Data Table on Spain - Market size and forecast 2024-2029 ($ million)
- Chart on Spain - Year-over-year growth 2024-2029 (%)
- Data Table on Spain - Year-over-year growth 2024-2029 (%)
- 12.12 Japan - Market size and forecast 2024-2029
- Chart on Japan - Market size and forecast 2024-2029 ($ million)
- Data Table on Japan - Market size and forecast 2024-2029 ($ million)
- Chart on Japan - Year-over-year growth 2024-2029 (%)
- Data Table on Japan - Year-over-year growth 2024-2029 (%)
- 12.13 Italy - Market size and forecast 2024-2029
- Chart on Italy - Market size and forecast 2024-2029 ($ million)
- Data Table on Italy - Market size and forecast 2024-2029 ($ million)
- Chart on Italy - Year-over-year growth 2024-2029 (%)
- Data Table on Italy - Year-over-year growth 2024-2029 (%)
- 12.14 India - Market size and forecast 2024-2029
- Chart on India - Market size and forecast 2024-2029 ($ million)
- Data Table on India - Market size and forecast 2024-2029 ($ million)
- Chart on India - Year-over-year growth 2024-2029 (%)
- Data Table on India - Year-over-year growth 2024-2029 (%)
- 12.15 UK - Market size and forecast 2024-2029
- Chart on UK - Market size and forecast 2024-2029 ($ million)
- Data Table on UK - Market size and forecast 2024-2029 ($ million)
- Chart on UK - Year-over-year growth 2024-2029 (%)
- Data Table on UK - Year-over-year growth 2024-2029 (%)
- 12.16 Germany - Market size and forecast 2024-2029
- Chart on Germany - Market size and forecast 2024-2029 ($ million)
- Data Table on Germany - Market size and forecast 2024-2029 ($ million)
- Chart on Germany - Year-over-year growth 2024-2029 (%)
- Data Table on Germany - Year-over-year growth 2024-2029 (%)
- 12.17 Brazil - Market size and forecast 2024-2029
- Chart on Brazil - Market size and forecast 2024-2029 ($ million)
- Data Table on Brazil - Market size and forecast 2024-2029 ($ million)
- Chart on Brazil - Year-over-year growth 2024-2029 (%)
- Data Table on Brazil - Year-over-year growth 2024-2029 (%)
- 12.18 Market opportunity By Geographical Landscape
- Market opportunity By Geographical Landscape ($ million)
- Data Tables on Market opportunity By Geographical Landscape ($ million)
13 Drivers, Challenges, and Opportunity/Restraints
- 13.1 Market drivers
- 13.2 Market challenges
- 13.3 Impact of drivers and challenges
- Impact of drivers and challenges in 2024 and 2029
- 13.4 Market opportunities/restraints
14 Competitive Landscape
- 14.1 Overview
- 14.2 Competitive Landscape
- Overview on criticality of inputs and factors of differentiation
- 14.3 Landscape disruption
- Overview on factors of disruption
- 14.4 Industry risks
- Impact of key risks on business
15 Competitive Analysis
- 15.1 Companies profiled
- Companies covered
- 15.2 Company ranking index
- Company ranking index
- 15.3 Market positioning of companies
- Matrix on companies position and classification
- 15.4 ACE Cultural Tours Ltd
- ACE Cultural Tours Ltd - Overview
- ACE Cultural Tours Ltd - Product / Service
- ACE Cultural Tours Ltd - Key offerings
- SWOT
- 15.5 Aracari Travel
- Aracari Travel - Overview
- Aracari Travel - Product / Service
- Aracari Travel - Key offerings
- SWOT
- 15.6 Envoy Tours
- Envoy Tours - Overview
- Envoy Tours - Product / Service
- Envoy Tours - Key offerings
- SWOT
- 15.7 Exodus Travels Ltd.
- Exodus Travels Ltd. - Overview
- Exodus Travels Ltd. - Product / Service
- Exodus Travels Ltd. - Key offerings
- SWOT
- 15.8 G Adventures
- G Adventures - Overview
- G Adventures - Product / Service
- G Adventures - Key offerings
- SWOT
- 15.9 Geographic Expeditions Inc.
- Geographic Expeditions Inc. - Overview
- Geographic Expeditions Inc. - Product / Service
- Geographic Expeditions Inc. - Key offerings
- SWOT
- 15.10 Indigenous Tourism BC
- Indigenous Tourism BC - Overview
- Indigenous Tourism BC - Product / Service
- Indigenous Tourism BC - Key offerings
- SWOT
- 15.11 Intrepid Group Pty Ltd.
- Intrepid Group Pty Ltd. - Overview
- Intrepid Group Pty Ltd. - Product / Service
- Intrepid Group Pty Ltd. - Key offerings
- SWOT
- 15.12 JPMorgan Chase and Co.
- JPMorgan Chase and Co. - Overview
- JPMorgan Chase and Co. - Business segments
- JPMorgan Chase and Co. - Key news
- JPMorgan Chase and Co. - Key offerings
- JPMorgan Chase and Co. - Segment focus
- SWOT
- 15.13 Kudu Travel Ltd.
- Kudu Travel Ltd. - Overview
- Kudu Travel Ltd. - Product / Service
- Kudu Travel Ltd. - Key offerings
- SWOT
- 15.14 Lindblad Expeditions Holdings Inc.
- Lindblad Expeditions Holdings Inc. - Overview
- Lindblad Expeditions Holdings Inc. - Business segments
- Lindblad Expeditions Holdings Inc. - Key offerings
- Lindblad Expeditions Holdings Inc. - Segment focus
- SWOT
- 15.15 Martin Randall Travel Ltd
- Martin Randall Travel Ltd - Overview
- Martin Randall Travel Ltd - Product / Service
- Martin Randall Travel Ltd - Key offerings
- SWOT
- 15.16 Odyssey World
- Odyssey World - Overview
- Odyssey World - Product / Service
- Odyssey World - Key offerings
- SWOT
- 15.17 Responsible Travel
- Responsible Travel - Overview
- Responsible Travel - Product / Service
- Responsible Travel - Key offerings
- SWOT
- 15.18 Travel Leaders Group Holdings LLC
- Travel Leaders Group Holdings LLC - Overview
- Travel Leaders Group Holdings LLC - Product / Service
- Travel Leaders Group Holdings LLC - Key offerings
- SWOT
16 Appendix
- 16.1 Scope of the report
- 16.2 Inclusions and exclusions checklist
- Inclusions checklist
- Exclusions checklist
- 16.3 Currency conversion rates for US$
- Currency conversion rates for US$
- 16.4 Research methodology
- Research methodology
- 16.5 Data procurement
- Information sources
- 16.6 Data validation
- Data validation
- 16.7 Validation techniques employed for market sizing
- Validation techniques employed for market sizing
- 16.8 Data synthesis
- Data synthesis
- 16.9 360 degree market analysis
- 360 degree market analysis
- 16.10 List of abbreviations
- List of abbreviations
