|
|
市場調査レポート
商品コード
1681179
消火スプリンクラーシステムの世界市場 2025~2029年Global Fire Sprinkler Systems Market 2025-2029 |
||||||

|
|||||||
カスタマイズ可能
|
|||||||


| 消火スプリンクラーシステムの世界市場 2025~2029年 |
|
出版日: 2025年03月01日
発行: TechNavio
ページ情報: 英文 226 Pages
納期: 即納可能
|

全表示
- 概要
- 目次
消火スプリンクラーシステム市場は2024~2029年に288億2,910万米ドル、予測期間中のCAGRは22.8%で成長すると予測されます。
当レポートでは、消火スプリンクラーシステム市場の全体的な分析、市場規模・予測、動向、成長促進要因、課題、約25のベンダーを網羅したベンダー分析などを掲載しています。
現在の市場シナリオ、最新動向と促進要因、市場環境全体に関する最新分析を提供しています。保険支出の減少、スプリンクラー設置に関する政府支援の増加、インフラ整備の進展などが市場を牽引しています。
| 市場範囲 | |
|---|---|
| 基準年 | 2025年 |
| 終了年 | 2029年 |
| 予測期間 | 2025~2029年 |
| 成長モメンタム | 加速 |
| 前年比2025年 | 18.2% |
| CAGR | 22.8% |
| 増分額 | 288億2,910万米ドル |
本調査は、業界の主要参加者からのインプットを含め、一次情報と二次情報を客観的に組み合わせて実施しました。本レポートには、主要企業の分析に加え、包括的な市場規模データ、地域分析によるセグメント、ベンダー情勢が含まれています。レポートには履歴データと予測データがあります。
本調査では、今後数年間の消火スプリンクラーシステム市場の成長を促進する主な理由の一つとして、火災安全システムの自動化を挙げています。また、デリュージシステムの利用拡大やビルオートメーションシステムの設置増加も、市場の大きな需要につながると思われます。
目次
第1章 エグゼクティブサマリー
- 市場概要
第2章 Technavio分析
- 価格・ライフサイクル・顧客購入バスケット・採用率・購入基準の分析
- インプットの重要性と差別化の要因
- 混乱の要因
- 促進要因と課題の影響
第3章 市場情勢
- 市場エコシステム
- 市場の特徴
- バリューチェーン分析
第4章 市場規模
- 市場の定義
- 市場セグメント分析
- 市場規模 2024年
- 市場展望 2024~2029年
第5章 市場規模実績
- 消火スプリンクラーシステムの世界市場 2019~2023年
- 製品別セグメント分析 2019~2023年
- エンドユーザー別セグメント分析 2019~2023年
- コンポーネント別セグメント分析 2019~2023年
- 地域別セグメント分析 2019~2023年
- 国別セグメント分析 2019~2023年
第6章 定性分析
- AIの影響:消火スプリンクラーシステムの世界市場
第7章 ファイブフォース分析
- ファイブフォースの要約
- 買い手の交渉力
- 供給企業の交渉力
- 新規参入業者の脅威
- 代替品の脅威
- 競争の脅威
- 市況
第8章 市場セグメンテーション:製品別
- 市場セグメント
- 比較:製品別
- デリュージ型消火スプリンクラーシステム:市場規模と予測 2024~2029年
- 湿式消火スプリンクラーシステム:市場規模と予測 2024~2029年
- 予作動式消火スプリンクラーシステム:市場規模と予測 2024~2029年
- 乾式消火スプリンクラーシステム:市場規模と予測 2024~2029年
- 市場機会:製品別
第9章 市場セグメンテーション:エンドユーザー別
- 市場セグメント
- 比較:エンドユーザー別
- 商業:市場規模と予測 2024~2029年
- 産業:市場規模と予測 2024~2029年
- 住宅:市場規模と予測 2024~2029年
- 市場機会:エンドユーザー別
第10章 市場セグメンテーション:コンポーネント別
- 市場セグメント
- 比較:コンポーネント別
- スプリンクラーヘッド:市場規模と予測 2024~2029年
- 制御弁:市場規模と予測 2024~2029年
- パイプ・継手:市場規模と予測 2024~2029年
- アラーム・センサー:市場規模と予測 2024~2029年
- 市場機会:コンポーネント別
第11章 顧客情勢
- 顧客情勢の概要
第12章 地域別情勢
- 地域別セグメンテーション
- 地域別比較
- アジア太平洋:市場規模と予測 2024~2029年
- 北米:市場規模と予測 2024~2029年
- 欧州:市場規模と予測 2024~2029年
- 中東・アフリカ:市場規模と予測 2024~2029年
- 南米:市場規模と予測 2024~2029年
- 米国:市場規模と予測 2024~2029年
- 中国:市場規模と予測 2024~2029年
- 日本:市場規模と予測 2024~2029年
- インド:市場規模と予測 2024~2029年
- 韓国:市場規模と予測 2024~2029年
- カナダ:市場規模と予測 2024~2029年
- オーストラリア:市場規模と予測 2024~2029年
- 英国:市場規模と予測 2024~2029年
- ドイツ:市場規模と予測 2024~2029年
- フランス:市場規模と予測 2024~2029年
- 市場機会:地域情勢別
第13章 促進要因・課題・機会・抑制要因
- 市場促進要因
- 市場の課題
- 促進要因と課題の影響
- 市場の機会・抑制要因
第14章 競合情勢
- 概要
- 競合情勢
- 混乱の状況
- 業界のリスク
第15章 競合分析
- 企業プロファイル
- 企業ランキング指数
- 企業の市場ポジショニング
- AI Fire LLC
- API Group Corp.
- Cox Fire Protection Inc.
- Fields Fire Protection
- G.w. Sprinkler A S
- HD Fire Protect Pvt. Ltd.
- HOCHIKI Corp.
- Honeywell International Inc.
- Johnson Controls International Plc
- Kauffman Co.
- Minimax GmbH
- Pryor Automatic Fire Sprinkler Inc.
- Siemens AG
- Siron Fire Protection
- The Reliable Automatic Sprinkler Co. Inc.
第16章 付録
The fire sprinkler systems market is forecasted to grow by USD 28829.1 million during 2024-2029, accelerating at a CAGR of 22.8% during the forecast period. The report on the fire sprinkler systems market provides a holistic analysis, market size and forecast, trends, growth drivers, and challenges, as well as vendor analysis covering around 25 vendors.
The report offers an up-to-date analysis regarding the current market scenario, the latest trends and drivers, and the overall market environment. The market is driven by decline in insurance expenditure, increased government support with regard to fire sprinkler installation, and rise in development of infrastructure.
| Market Scope | |
|---|---|
| Base Year | 2025 |
| End Year | 2029 |
| Series Year | 2025-2029 |
| Growth Momentum | Accelerate |
| YOY 2025 | 18.2% |
| CAGR | 22.8% |
| Incremental Value | $28829.1 mn |
The study was conducted using an objective combination of primary and secondary information including inputs from key participants in the industry. The report contains a comprehensive market size data, segment with regional analysis and vendor landscape in addition to an analysis of the key companies. Reports have historic and forecast data.
Technavio's fire sprinkler systems market is segmented as below:
By Product
- Deluge fire sprinkler systems
- Wet pipe fire sprinkler systems
- Pre-action fire sprinkler systems
- Dry pipe fire sprinkler systems
By End-user
- Commercial
- Industrial
- Residential
By Component
- Sprinkler heads
- Control valves
- Pipes and fittings
- Alarms and sensors
By Geographical Landscape
- APAC
- North America
- Europe
- Middle East and Africa
- South America
This study identifies the automation of fire safety systems as one of the prime reasons driving the fire sprinkler systems market growth during the next few years. Also, augmented use of deluge systems and increase in installation of building automation systems will lead to sizable demand in the market.
The report on the fire sprinkler systems market covers the following areas:
- Fire Sprinkler Systems Market sizing
- Fire Sprinkler Systems Market forecast
- Fire Sprinkler Systems Market industry analysis
The robust vendor analysis is designed to help clients improve their market position, and in line with this, this report provides a detailed analysis of several leading fire sprinkler systems market vendors that include AI Fire LLC, API Group Corp., Cox Fire Protection Inc., Fields Fire Protection, G.w. Sprinkler A S, Grundfos Holding AS, HD Fire Protect Pvt. Ltd., HOCHIKI Corp., Honeywell International Inc., Johnson Controls International PLC, Kauffman Co., Midwest Automatic Fire Sprinkler Co., Minimax GmbH, NAFFCO FZCO, Pryor Automatic Fire Sprinkler Inc., SFP Holding, Inc., Siemens AG, Siron Fire Protection, The Reliable Automatic Sprinkler Co. Inc., and Victaulic Co.. Also, the fire sprinkler systems market analysis report includes information on upcoming trends and challenges that will influence market growth. This is to help companies strategize and leverage all forthcoming growth opportunities.
The publisher presents a detailed picture of the market by the way of study, synthesis, and summation of data from multiple sources by an analysis of key parameters such as profit, pricing, competition, and promotions. It presents various market facets by identifying the key industry influencers. The data presented is comprehensive, reliable, and a result of extensive primary and secondary research. The market research reports provide a complete competitive landscape and an in-depth vendor selection methodology and analysis using qualitative and quantitative research to forecast accurate market growth.
Table of Contents
1 Executive Summary
- 1.1 Market overview
- Executive Summary - Chart on Market Overview
- Executive Summary - Data Table on Market Overview
- Executive Summary - Chart on Global Market Characteristics
- Executive Summary - Chart on Market By Geographical Landscape
- Executive Summary - Chart on Market Segmentation by Product
- Executive Summary - Chart on Market Segmentation by End-user
- Executive Summary - Chart on Market Segmentation by Component
- Executive Summary - Chart on Incremental Growth
- Executive Summary - Data Table on Incremental Growth
- Executive Summary - Chart on Company Market Positioning
2 Technavio Analysis
- 2.1 Analysis of price sensitivity, lifecycle, customer purchase basket, adoption rates, and purchase criteria
- Analysis of price sensitivity, lifecycle, customer purchase basket, adoption rates, and purchase criteria
- 2.2 Criticality of inputs and Factors of differentiation
- Overview on criticality of inputs and factors of differentiation
- 2.3 Factors of disruption
- Overview on factors of disruption
- 2.4 Impact of drivers and challenges
- Impact of drivers and challenges in 2024 and 2029
3 Market Landscape
- 3.1 Market ecosystem
- Parent Market
- Data Table on - Parent Market
- 3.2 Market characteristics
- Market characteristics analysis
- 3.3 Value chain analysis
- Value chain analysis
4 Market Sizing
- 4.1 Market definition
- Offerings of companies included in the market definition
- 4.2 Market segment analysis
- Market segments
- 4.3 Market size 2024
- 4.4 Market outlook: Forecast for 2024-2029
- Chart on Global - Market size and forecast 2024-2029 ($ million)
- Data Table on Global - Market size and forecast 2024-2029 ($ million)
- Chart on Global Market: Year-over-year growth 2024-2029 (%)
- Data Table on Global Market: Year-over-year growth 2024-2029 (%)
5 Historic Market Size
- 5.1 Global Fire Sprinkler Systems Market 2019 - 2023
- Historic Market Size - Data Table on Global Fire Sprinkler Systems Market 2019 - 2023 ($ million)
- 5.2 Product segment analysis 2019 - 2023
- Historic Market Size - Product Segment 2019 - 2023 ($ million)
- 5.3 End-user segment analysis 2019 - 2023
- Historic Market Size - End-user Segment 2019 - 2023 ($ million)
- 5.4 Component segment analysis 2019 - 2023
- Historic Market Size - Component Segment 2019 - 2023 ($ million)
- 5.5 Geography segment analysis 2019 - 2023
- Historic Market Size - Geography Segment 2019 - 2023 ($ million)
- 5.6 Country segment analysis 2019 - 2023
- Historic Market Size - Country Segment 2019 - 2023 ($ million)
6 Qualitative Analysis
- 6.1 The AI impact on Global Fire Sprinkler Systems Market
7 Five Forces Analysis
- 7.1 Five forces summary
- Five forces analysis - Comparison between 2024 and 2029
- 7.2 Bargaining power of buyers
- Bargaining power of buyers - Impact of key factors 2024 and 2029
- 7.3 Bargaining power of suppliers
- Bargaining power of suppliers - Impact of key factors in 2024 and 2029
- 7.4 Threat of new entrants
- Threat of new entrants - Impact of key factors in 2024 and 2029
- 7.5 Threat of substitutes
- Threat of substitutes - Impact of key factors in 2024 and 2029
- 7.6 Threat of rivalry
- Threat of rivalry - Impact of key factors in 2024 and 2029
- 7.7 Market condition
- Chart on Market condition - Five forces 2024 and 2029
8 Market Segmentation by Product
- 8.1 Market segments
- Chart on Product - Market share 2024-2029 (%)
- Data Table on Product - Market share 2024-2029 (%)
- 8.2 Comparison by Product
- Chart on Comparison by Product
- Data Table on Comparison by Product
- 8.3 Deluge fire sprinkler systems - Market size and forecast 2024-2029
- Chart on Deluge fire sprinkler systems - Market size and forecast 2024-2029 ($ million)
- Data Table on Deluge fire sprinkler systems - Market size and forecast 2024-2029 ($ million)
- Chart on Deluge fire sprinkler systems - Year-over-year growth 2024-2029 (%)
- Data Table on Deluge fire sprinkler systems - Year-over-year growth 2024-2029 (%)
- 8.4 Wet pipe fire sprinkler systems - Market size and forecast 2024-2029
- Chart on Wet pipe fire sprinkler systems - Market size and forecast 2024-2029 ($ million)
- Data Table on Wet pipe fire sprinkler systems - Market size and forecast 2024-2029 ($ million)
- Chart on Wet pipe fire sprinkler systems - Year-over-year growth 2024-2029 (%)
- Data Table on Wet pipe fire sprinkler systems - Year-over-year growth 2024-2029 (%)
- 8.5 Pre-action fire sprinkler systems - Market size and forecast 2024-2029
- Chart on Pre-action fire sprinkler systems - Market size and forecast 2024-2029 ($ million)
- Data Table on Pre-action fire sprinkler systems - Market size and forecast 2024-2029 ($ million)
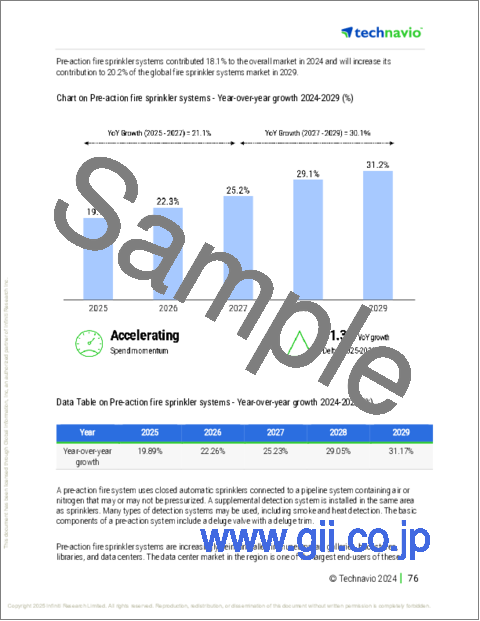
- Chart on Pre-action fire sprinkler systems - Year-over-year growth 2024-2029 (%)
- Data Table on Pre-action fire sprinkler systems - Year-over-year growth 2024-2029 (%)
- 8.6 Dry pipe fire sprinkler systems - Market size and forecast 2024-2029
- Chart on Dry pipe fire sprinkler systems - Market size and forecast 2024-2029 ($ million)
- Data Table on Dry pipe fire sprinkler systems - Market size and forecast 2024-2029 ($ million)
- Chart on Dry pipe fire sprinkler systems - Year-over-year growth 2024-2029 (%)
- Data Table on Dry pipe fire sprinkler systems - Year-over-year growth 2024-2029 (%)
- 8.7 Market opportunity by Product
- Market opportunity by Product ($ million)
- Data Table on Market opportunity by Product ($ million)
9 Market Segmentation by End-user
- 9.1 Market segments
- Chart on End-user - Market share 2024-2029 (%)
- Data Table on End-user - Market share 2024-2029 (%)
- 9.2 Comparison by End-user
- Chart on Comparison by End-user
- Data Table on Comparison by End-user
- 9.3 Commercial - Market size and forecast 2024-2029
- Chart on Commercial - Market size and forecast 2024-2029 ($ million)
- Data Table on Commercial - Market size and forecast 2024-2029 ($ million)
- Chart on Commercial - Year-over-year growth 2024-2029 (%)
- Data Table on Commercial - Year-over-year growth 2024-2029 (%)
- 9.4 Industrial - Market size and forecast 2024-2029
- Chart on Industrial - Market size and forecast 2024-2029 ($ million)
- Data Table on Industrial - Market size and forecast 2024-2029 ($ million)
- Chart on Industrial - Year-over-year growth 2024-2029 (%)
- Data Table on Industrial - Year-over-year growth 2024-2029 (%)
- 9.5 Residential - Market size and forecast 2024-2029
- Chart on Residential - Market size and forecast 2024-2029 ($ million)
- Data Table on Residential - Market size and forecast 2024-2029 ($ million)
- Chart on Residential - Year-over-year growth 2024-2029 (%)
- Data Table on Residential - Year-over-year growth 2024-2029 (%)
- 9.6 Market opportunity by End-user
- Market opportunity by End-user ($ million)
- Data Table on Market opportunity by End-user ($ million)
10 Market Segmentation by Component
- 10.1 Market segments
- Chart on Component - Market share 2024-2029 (%)
- Data Table on Component - Market share 2024-2029 (%)
- 10.2 Comparison by Component
- Chart on Comparison by Component
- Data Table on Comparison by Component
- 10.3 Sprinkler heads - Market size and forecast 2024-2029
- Chart on Sprinkler heads - Market size and forecast 2024-2029 ($ million)
- Data Table on Sprinkler heads - Market size and forecast 2024-2029 ($ million)
- Chart on Sprinkler heads - Year-over-year growth 2024-2029 (%)
- Data Table on Sprinkler heads - Year-over-year growth 2024-2029 (%)
- 10.4 Control valves - Market size and forecast 2024-2029
- Chart on Control valves - Market size and forecast 2024-2029 ($ million)
- Data Table on Control valves - Market size and forecast 2024-2029 ($ million)
- Chart on Control valves - Year-over-year growth 2024-2029 (%)
- Data Table on Control valves - Year-over-year growth 2024-2029 (%)
- 10.5 Pipes and fittings - Market size and forecast 2024-2029
- Chart on Pipes and fittings - Market size and forecast 2024-2029 ($ million)
- Data Table on Pipes and fittings - Market size and forecast 2024-2029 ($ million)
- Chart on Pipes and fittings - Year-over-year growth 2024-2029 (%)
- Data Table on Pipes and fittings - Year-over-year growth 2024-2029 (%)
- 10.6 Alarms and sensors - Market size and forecast 2024-2029
- Chart on Alarms and sensors - Market size and forecast 2024-2029 ($ million)
- Data Table on Alarms and sensors - Market size and forecast 2024-2029 ($ million)
- Chart on Alarms and sensors - Year-over-year growth 2024-2029 (%)
- Data Table on Alarms and sensors - Year-over-year growth 2024-2029 (%)
- 10.7 Market opportunity by Component
- Market opportunity by Component ($ million)
- Data Table on Market opportunity by Component ($ million)
11 Customer Landscape
- 11.1 Customer landscape overview
- Analysis of price sensitivity, lifecycle, customer purchase basket, adoption rates, and purchase criteria
12 Geographic Landscape
- 12.1 Geographic segmentation
- Chart on Market share By Geographical Landscape 2024-2029 (%)
- Data Table on Market share By Geographical Landscape 2024-2029 (%)
- 12.2 Geographic comparison
- Chart on Geographic comparison
- Data Table on Geographic comparison
- 12.3 APAC - Market size and forecast 2024-2029
- Chart on APAC - Market size and forecast 2024-2029 ($ million)
- Data Table on APAC - Market size and forecast 2024-2029 ($ million)
- Chart on APAC - Year-over-year growth 2024-2029 (%)
- Data Table on APAC - Year-over-year growth 2024-2029 (%)
- 12.4 North America - Market size and forecast 2024-2029
- Chart on North America - Market size and forecast 2024-2029 ($ million)
- Data Table on North America - Market size and forecast 2024-2029 ($ million)
- Chart on North America - Year-over-year growth 2024-2029 (%)
- Data Table on North America - Year-over-year growth 2024-2029 (%)
- 12.5 Europe - Market size and forecast 2024-2029
- Chart on Europe - Market size and forecast 2024-2029 ($ million)
- Data Table on Europe - Market size and forecast 2024-2029 ($ million)
- Chart on Europe - Year-over-year growth 2024-2029 (%)
- Data Table on Europe - Year-over-year growth 2024-2029 (%)
- 12.6 Middle East and Africa - Market size and forecast 2024-2029
- Chart on Middle East and Africa - Market size and forecast 2024-2029 ($ million)
- Data Table on Middle East and Africa - Market size and forecast 2024-2029 ($ million)
- Chart on Middle East and Africa - Year-over-year growth 2024-2029 (%)
- Data Table on Middle East and Africa - Year-over-year growth 2024-2029 (%)
- 12.7 South America - Market size and forecast 2024-2029
- Chart on South America - Market size and forecast 2024-2029 ($ million)
- Data Table on South America - Market size and forecast 2024-2029 ($ million)
- Chart on South America - Year-over-year growth 2024-2029 (%)
- Data Table on South America - Year-over-year growth 2024-2029 (%)
- 12.8 US - Market size and forecast 2024-2029
- Chart on US - Market size and forecast 2024-2029 ($ million)
- Data Table on US - Market size and forecast 2024-2029 ($ million)
- Chart on US - Year-over-year growth 2024-2029 (%)
- Data Table on US - Year-over-year growth 2024-2029 (%)
- 12.9 China - Market size and forecast 2024-2029
- Chart on China - Market size and forecast 2024-2029 ($ million)
- Data Table on China - Market size and forecast 2024-2029 ($ million)
- Chart on China - Year-over-year growth 2024-2029 (%)
- Data Table on China - Year-over-year growth 2024-2029 (%)
- 12.10 Japan - Market size and forecast 2024-2029
- Chart on Japan - Market size and forecast 2024-2029 ($ million)
- Data Table on Japan - Market size and forecast 2024-2029 ($ million)
- Chart on Japan - Year-over-year growth 2024-2029 (%)
- Data Table on Japan - Year-over-year growth 2024-2029 (%)
- 12.11 India - Market size and forecast 2024-2029
- Chart on India - Market size and forecast 2024-2029 ($ million)
- Data Table on India - Market size and forecast 2024-2029 ($ million)
- Chart on India - Year-over-year growth 2024-2029 (%)
- Data Table on India - Year-over-year growth 2024-2029 (%)
- 12.12 South Korea - Market size and forecast 2024-2029
- Chart on South Korea - Market size and forecast 2024-2029 ($ million)
- Data Table on South Korea - Market size and forecast 2024-2029 ($ million)
- Chart on South Korea - Year-over-year growth 2024-2029 (%)
- Data Table on South Korea - Year-over-year growth 2024-2029 (%)
- 12.13 Canada - Market size and forecast 2024-2029
- Chart on Canada - Market size and forecast 2024-2029 ($ million)
- Data Table on Canada - Market size and forecast 2024-2029 ($ million)
- Chart on Canada - Year-over-year growth 2024-2029 (%)
- Data Table on Canada - Year-over-year growth 2024-2029 (%)
- 12.14 Australia - Market size and forecast 2024-2029
- Chart on Australia - Market size and forecast 2024-2029 ($ million)
- Data Table on Australia - Market size and forecast 2024-2029 ($ million)
- Chart on Australia - Year-over-year growth 2024-2029 (%)
- Data Table on Australia - Year-over-year growth 2024-2029 (%)
- 12.15 UK - Market size and forecast 2024-2029
- Chart on UK - Market size and forecast 2024-2029 ($ million)
- Data Table on UK - Market size and forecast 2024-2029 ($ million)
- Chart on UK - Year-over-year growth 2024-2029 (%)
- Data Table on UK - Year-over-year growth 2024-2029 (%)
- 12.16 Germany - Market size and forecast 2024-2029
- Chart on Germany - Market size and forecast 2024-2029 ($ million)
- Data Table on Germany - Market size and forecast 2024-2029 ($ million)
- Chart on Germany - Year-over-year growth 2024-2029 (%)
- Data Table on Germany - Year-over-year growth 2024-2029 (%)
- 12.17 France - Market size and forecast 2024-2029
- Chart on France - Market size and forecast 2024-2029 ($ million)
- Data Table on France - Market size and forecast 2024-2029 ($ million)
- Chart on France - Year-over-year growth 2024-2029 (%)
- Data Table on France - Year-over-year growth 2024-2029 (%)
- 12.18 Market opportunity By Geographical Landscape
- Market opportunity By Geographical Landscape ($ million)
- Data Tables on Market opportunity By Geographical Landscape ($ million)
13 Drivers, Challenges, and Opportunity/Restraints
- 13.1 Market drivers
- 13.2 Market challenges
- 13.3 Impact of drivers and challenges
- Impact of drivers and challenges in 2024 and 2029
- 13.4 Market opportunities/restraints
14 Competitive Landscape
- 14.1 Overview
- 14.2 Competitive Landscape
- Overview on criticality of inputs and factors of differentiation
- 14.3 Landscape disruption
- Overview on factors of disruption
- 14.4 Industry risks
- Impact of key risks on business
15 Competitive Analysis
- 15.1 Companies profiled
- Companies covered
- 15.2 Company ranking index
- Company ranking index
- 15.3 Market positioning of companies
- Matrix on companies position and classification
- 15.4 AI Fire LLC
- AI Fire LLC - Overview
- AI Fire LLC - Business segments
- AI Fire LLC - Key offerings
- AI Fire LLC - Segment focus
- SWOT
- 15.5 API Group Corp.
- API Group Corp. - Overview
- API Group Corp. - Business segments
- API Group Corp. - Key news
- API Group Corp. - Key offerings
- API Group Corp. - Segment focus
- SWOT
- 15.6 Cox Fire Protection Inc.
- Cox Fire Protection Inc. - Overview
- Cox Fire Protection Inc. - Product / Service
- Cox Fire Protection Inc. - Key offerings
- SWOT
- 15.7 Fields Fire Protection
- Fields Fire Protection - Overview
- Fields Fire Protection - Product / Service
- Fields Fire Protection - Key offerings
- SWOT
- 15.8 G.w. Sprinkler A S
- G.w. Sprinkler A S - Overview
- G.w. Sprinkler A S - Product / Service
- G.w. Sprinkler A S - Key offerings
- SWOT
- 15.9 HD Fire Protect Pvt. Ltd.
- HD Fire Protect Pvt. Ltd. - Overview
- HD Fire Protect Pvt. Ltd. - Product / Service
- HD Fire Protect Pvt. Ltd. - Key offerings
- SWOT
- 15.10 HOCHIKI Corp.
- HOCHIKI Corp. - Overview
- HOCHIKI Corp. - Product / Service
- HOCHIKI Corp. - Key offerings
- SWOT
- 15.11 Honeywell International Inc.
- Honeywell International Inc. - Overview
- Honeywell International Inc. - Business segments
- Honeywell International Inc. - Key news
- Honeywell International Inc. - Key offerings
- Honeywell International Inc. - Segment focus
- SWOT
- 15.12 Johnson Controls International Plc
- Johnson Controls International Plc - Overview
- Johnson Controls International Plc - Business segments
- Johnson Controls International Plc - Key news
- Johnson Controls International Plc - Key offerings
- Johnson Controls International Plc - Segment focus
- SWOT
- 15.13 Kauffman Co.
- Kauffman Co. - Overview
- Kauffman Co. - Product / Service
- Kauffman Co. - Key offerings
- SWOT
- 15.14 Minimax GmbH
- Minimax GmbH - Overview
- Minimax GmbH - Product / Service
- Minimax GmbH - Key offerings
- SWOT
- 15.15 Pryor Automatic Fire Sprinkler Inc.
- Pryor Automatic Fire Sprinkler Inc. - Overview
- Pryor Automatic Fire Sprinkler Inc. - Product / Service
- Pryor Automatic Fire Sprinkler Inc. - Key offerings
- SWOT
- 15.16 Siemens AG
- Siemens AG - Overview
- Siemens AG - Business segments
- Siemens AG - Key news
- Siemens AG - Key offerings
- Siemens AG - Segment focus
- SWOT
- 15.17 Siron Fire Protection
- Siron Fire Protection - Overview
- Siron Fire Protection - Product / Service
- Siron Fire Protection - Key offerings
- SWOT
- 15.18 The Reliable Automatic Sprinkler Co. Inc.
- The Reliable Automatic Sprinkler Co. Inc. - Overview
- The Reliable Automatic Sprinkler Co. Inc. - Product / Service
- The Reliable Automatic Sprinkler Co. Inc. - Key offerings
- SWOT
16 Appendix
- 16.1 Scope of the report
- 16.2 Inclusions and exclusions checklist
- Inclusions checklist
- Exclusions checklist
- 16.3 Currency conversion rates for US$
- Currency conversion rates for US$
- 16.4 Research methodology
- Research methodology
- 16.5 Data procurement
- Information sources
- 16.6 Data validation
- Data validation
- 16.7 Validation techniques employed for market sizing
- Validation techniques employed for market sizing
- 16.8 Data synthesis
- Data synthesis
- 16.9 360 degree market analysis
- 360 degree market analysis
- 16.10 List of abbreviations
- List of abbreviations
