|
|
市場調査レポート
商品コード
1666752
無糖食品および飲料の世界市場 2025~2029年Global Sugar-free Food and Beverage Market 2025-2029 |
||||||

|
|||||||
カスタマイズ可能
|
|||||||


| 無糖食品および飲料の世界市場 2025~2029年 |
|
出版日: 2025年02月20日
発行: TechNavio
ページ情報: 英文 255 Pages
納期: 即納可能
|

全表示
- 概要
- 目次
無糖食品および飲料市場は2024-2029年に589億米ドル、予測期間中のCAGRは11.3%で成長すると予測されます。
当レポートでは、無糖食品および飲料市場の全体的な分析、市場規模・予測、動向、成長促進要因、課題、約25のベンダーを網羅したベンダー分析などを掲載しています。
現在の市場シナリオ、最新動向と促進要因、市場環境全体に関する最新分析を提供しています。市場は、オンライン小売の影響力の拡大、天然由来の甘味料への需要、製品のプレミアム化が牽引しています。
| 市場範囲 | |
|---|---|
| 基準年 | 2025 |
| 終了年 | 2029 |
| 予測期間 | 2025-2029 |
| 成長モメンタム | 加速 |
| 前年比2025年 | 9.9% |
| CAGR | 11.3% |
| 増分額 | 589億米ドル |
本調査は、業界の主要参加者からのインプットを含め、一次情報と二次情報を客観的に組み合わせて実施しました。本レポートには、主要企業の分析に加え、包括的な市場規模データ、地域分析によるセグメント、ベンダー情勢が含まれています。レポートには過去データと予測データがあります。
本調査では、今後数年間の無糖食品および飲料市場の成長を促進する主な要因の1つとして、プライベートブランド(PB)の台頭を挙げています。また、無糖食品および飲料を提供する専門小売店や、有機無糖食品や飲食品への需要の高まりは、市場の大きな需要につながるでしょう。
目次
第1章 エグゼクティブサマリー
- 市場概要
第2章 Technavio別分析
- 価格・ライフサイクル・顧客購入バスケット・採用率・購入基準の分析
- インプットの重要性と差別化の要因
- 混乱の要因
- 促進要因と課題の影響
第3章 市場情勢
- 市場エコシステム
- 市場の特徴
- バリューチェーン分析
第4章 市場規模
- 市場の定義
- 市場セグメント分析
- 市場規模 2024
- 市場の見通し 2024-2029
第5章 市場規模実績
- 無糖食品および飲料の世界市場 2019-2023
- エンドユーザー別セグメント分析 2019-2023
- 製品別セグメント分析 2019-2023
- 製品タイプ別セグメント分析 2019-2023
- パッケージング別セグメント分析 2019-2023
- 地域別セグメント分析 2019-2023
- 国別セグメント分析 2019-2023
第6章 定性分析
- AIの影響:無糖食品および飲料の世界市場
第7章 ファイブフォース分析
- ファイブフォースの要約
- 買い手の交渉力
- 供給企業の交渉力
- 新規参入業者の脅威
- 代替品の脅威
- 競争の脅威
- 市況
第8章 市場セグメンテーション:エンドユーザー別
- 市場セグメント
- 比較:エンドユーザー別
- スーパーマーケットまたはハイパーマーケット:市場規模と予測 2024-2029
- コンビニエンスストア:市場規模と予測 2024-2029
- オンラインストア:市場規模と予測 2024-2029
- 専門店:市場規模と予測 2024-2029
- 市場機会:エンドユーザー別
第9章 市場セグメンテーション:製品別
- 市場セグメント
- 比較:製品別
- 砂糖不使用飲料:市場規模と予測 2024-2029
- 無糖乳製品:市場規模と予測 2024-2029
- 砂糖不使用の菓子類:市場規模と予測 2024-2029
- 砂糖不使用のベーカリー:市場規模と予測 2024-2029
- 砂糖不使用アイスクリーム:市場規模と予測 2024-2029
- 市場機会:製品別
第10章 市場セグメンテーション:製品タイプ別
- 市場セグメント
- 比較:製品タイプ別
- 人工甘味料:市場規模と予測 2024-2029
- 天然甘味料:市場規模と予測 2024-2029
- 糖アルコール:市場規模と予測 2024-2029
- 市場機会:製品タイプ別
第11章 市場セグメンテーション:パッケージング別
- 市場セグメント
- 比較:パッケージング別
- ボトルと缶:市場規模と予測 2024-2029
- パウチとサシェ:市場規模と予測 2024-2029
- 箱とカートン:市場規模と予測 2024-2029
- 市場機会:パッケージング別
第12章 顧客情勢
- 顧客情勢の概要
第13章 地域別情勢
- 地域別セグメンテーション
- 地域別比較
- 北米:市場規模と予測 2024-2029
- 欧州:市場規模と予測 2024-2029
- アジア太平洋:市場規模と予測 2024-2029
- 南米:市場規模と予測 2024-2029
- 中東・アフリカ:市場規模と予測 2024-2029
- 米国:市場規模と予測 2024-2029
- 中国:市場規模と予測 2024-2029
- カナダ:市場規模と予測 2024-2029
- ドイツ:市場規模と予測 2024-2029
- イタリア:市場規模と予測 2024-2029
- 英国:市場規模と予測 2024-2029
- フランス:市場規模と予測 2024-2029
- ブラジル:市場規模と予測 2024-2029
- インド:市場規模と予測 2024-2029
- オーストラリア:市場規模と予測 2024-2029
- 市場機会:地域情勢別
第14章 促進要因・課題・機会・抑制要因
- 市場促進要因
- 市場の課題
- 促進要因と課題の影響
- 市場の機会・抑制要因
第15章 競合情勢
- 概要
- 競合情勢
- 混乱の状況
- 業界のリスク
第16章 競合分析
- 企業プロファイル
- 企業ランキング指数
- 企業の市場ポジショニング
- Atkinson Candy Co.
- Chocoladefabriken Lindt and Sprungli AG
- Flowers Foods Inc.
- General Mills Inc.
- Gujarat Cooperative Milk Marketing Federation Ltd.
- Jones Soda Co.
- Kellogg Co.
- Keurig Dr Pepper Inc.
- Monster Energy Co.
- Nestle SA
- PepsiCo Inc.
- Russell Stover Chocolates
- The Coca Cola Co.
- The Hershey Co.
- The Kraft Heinz Co.
第17章 付録
The sugar-free food and beverage market is forecasted to grow by USD 58.9 billion during 2024-2029, accelerating at a CAGR of 11.3% during the forecast period. The report on the sugar-free food and beverage market provides a holistic analysis, market size and forecast, trends, growth drivers, and challenges, as well as vendor analysis covering around 25 vendors.
The report offers an up-to-date analysis regarding the current market scenario, the latest trends and drivers, and the overall market environment. The market is driven by growing influence of online retailing, demand for naturally derived sweeteners, and product premiumization.
| Market Scope | |
|---|---|
| Base Year | 2025 |
| End Year | 2029 |
| Series Year | 2025-2029 |
| Growth Momentum | Accelerate |
| YOY 2025 | 9.9% |
| CAGR | 11.3% |
| Incremental Value | $58.9 bn |
The study was conducted using an objective combination of primary and secondary information including inputs from key participants in the industry. The report contains a comprehensive market size data, segment with regional analysis and vendor landscape in addition to an analysis of the key companies. Reports have historic and forecast data.
Technavio's sugar-free food and beverage market is segmented as below:
By End-user
- Supermarkets or hypermarkets
- Convenience stores
- Online stores
- Specialty stores
By Product
- Sugar-free beverages
- Sugar-free dairy products
- Sugar-free confectionery
- Sugar-free bakery
- Sugar-free ice-creams
By Product Type
- Artificial sweeteners
- Natural sweeteners
- Sugar alcohols
By Packaging
- Bottles and cans
- Pouches and sachets
- Boxes and cartons
By Geographical Landscape
- North America
- Europe
- APAC
- South America
- Middle East and Africa
This study identifies the increasing prominence of private-label brands as one of the prime reasons driving the sugar-free food and beverage market growth during the next few years. Also, specialty retailers offering sugar-free food and beverage and growing demand for organic sugar-free foods and beverages will lead to sizable demand in the market.
The report on the sugar-free food and beverage market covers the following areas:
- Sugar-Free Food And Beverage Market sizing
- Sugar-Free Food And Beverage Market forecast
- Sugar-Free Food And Beverage Market industry analysis
The robust vendor analysis is designed to help clients improve their market position, and in line with this, this report provides a detailed analysis of several leading sugar-free food and beverage market vendors that include Atkinson Candy Co., Britvic PLC, Chocoladefabriken Lindt and Sprungli AG, Flowers Foods Inc., General Mills Inc., Gujarat Cooperative Milk Marketing Federation Ltd., Jones Soda Co., Kellogg Co., Keurig DR Pepper Inc., Monster Energy Co., Nestle SA, PepsiCo Inc., Russell Stover Chocolates, Suntory Beverage and Food Ltd., The Coca Cola Co., The Hershey Co., The Kraft Heinz Co., Turkey Hill Dairy, Vadilal Industries Ltd., and Wells Enterprises Inc.. Also, the sugar-free food and beverage market analysis report includes information on upcoming trends and challenges that will influence market growth. This is to help companies strategize and leverage all forthcoming growth opportunities.
The publisher presents a detailed picture of the market by the way of study, synthesis, and summation of data from multiple sources by an analysis of key parameters such as profit, pricing, competition, and promotions. It presents various market facets by identifying the key industry influencers. The data presented is comprehensive, reliable, and a result of extensive primary and secondary research. The market research reports provide a complete competitive landscape and an in-depth vendor selection methodology and analysis using qualitative and quantitative research to forecast accurate market growth.
Table of Contents
1 Executive Summary
- 1.1 Market overview
- Executive Summary - Chart on Market Overview
- Executive Summary - Data Table on Market Overview
- Executive Summary - Chart on Global Market Characteristics
- Executive Summary - Chart on Market By Geographical Landscape
- Executive Summary - Chart on Market Segmentation by End-user
- Executive Summary - Chart on Market Segmentation by Product
- Executive Summary - Chart on Market Segmentation by Product Type
- Executive Summary - Chart on Market Segmentation by Packaging
- Executive Summary - Chart on Incremental Growth
- Executive Summary - Data Table on Incremental Growth
- Executive Summary - Chart on Company Market Positioning
2 Technavio Analysis
- 2.1 Analysis of price sensitivity, lifecycle, customer purchase basket, adoption rates, and purchase criteria
- Analysis of price sensitivity, lifecycle, customer purchase basket, adoption rates, and purchase criteria
- 2.2 Criticality of inputs and Factors of differentiation
- Overview on criticality of inputs and factors of differentiation
- 2.3 Factors of disruption
- Overview on factors of disruption
- 2.4 Impact of drivers and challenges
- Impact of drivers and challenges in 2024 and 2029
3 Market Landscape
- 3.1 Market ecosystem
- Parent Market
- Data Table on - Parent Market
- 3.2 Market characteristics
- Market characteristics analysis
- 3.3 Value chain analysis
- Value chain analysis
4 Market Sizing
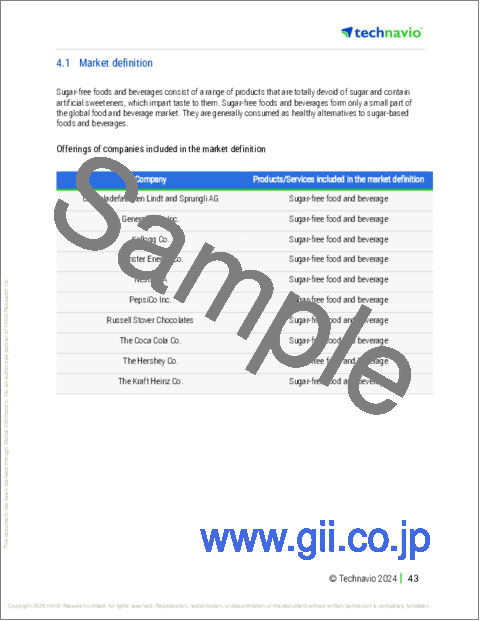
- 4.1 Market definition
- Offerings of companies included in the market definition
- 4.2 Market segment analysis
- Market segments
- 4.3 Market size 2024
- 4.4 Market outlook: Forecast for 2024-2029
- Chart on Global - Market size and forecast 2024-2029 ($ billion)
- Data Table on Global - Market size and forecast 2024-2029 ($ billion)
- Chart on Global Market: Year-over-year growth 2024-2029 (%)
- Data Table on Global Market: Year-over-year growth 2024-2029 (%)
5 Historic Market Size
- 5.1 Global Sugar-Free Food And Beverage Market 2019 - 2023
- Historic Market Size - Data Table on Global Sugar-Free Food And Beverage Market 2019 - 2023 ($ billion)
- 5.2 End-user segment analysis 2019 - 2023
- Historic Market Size - End-user Segment 2019 - 2023 ($ billion)
- 5.3 Product segment analysis 2019 - 2023
- Historic Market Size - Product Segment 2019 - 2023 ($ billion)
- 5.4 Product Type segment analysis 2019 - 2023
- Historic Market Size - Product Type Segment 2019 - 2023 ($ billion)
- 5.5 Packaging segment analysis 2019 - 2023
- Historic Market Size - Packaging Segment 2019 - 2023 ($ billion)
- 5.6 Geography segment analysis 2019 - 2023
- Historic Market Size - Geography Segment 2019 - 2023 ($ billion)
- 5.7 Country segment analysis 2019 - 2023
- Historic Market Size - Country Segment 2019 - 2023 ($ billion)
6 Qualitative Analysis
- 6.1 The AI impact on Global Sugar-Free Food and Beverage Market
7 Five Forces Analysis
- 7.1 Five forces summary
- Five forces analysis - Comparison between 2024 and 2029
- 7.2 Bargaining power of buyers
- Bargaining power of buyers - Impact of key factors 2024 and 2029
- 7.3 Bargaining power of suppliers
- Bargaining power of suppliers - Impact of key factors in 2024 and 2029
- 7.4 Threat of new entrants
- Threat of new entrants - Impact of key factors in 2024 and 2029
- 7.5 Threat of substitutes
- Threat of substitutes - Impact of key factors in 2024 and 2029
- 7.6 Threat of rivalry
- Threat of rivalry - Impact of key factors in 2024 and 2029
- 7.7 Market condition
- Chart on Market condition - Five forces 2024 and 2029
8 Market Segmentation by End-user
- 8.1 Market segments
- Chart on End-user - Market share 2024-2029 (%)
- Data Table on End-user - Market share 2024-2029 (%)
- 8.2 Comparison by End-user
- Chart on Comparison by End-user
- Data Table on Comparison by End-user
- 8.3 Supermarkets or hypermarkets - Market size and forecast 2024-2029
- Chart on Supermarkets or hypermarkets - Market size and forecast 2024-2029 ($ billion)
- Data Table on Supermarkets or hypermarkets - Market size and forecast 2024-2029 ($ billion)
- Chart on Supermarkets or hypermarkets - Year-over-year growth 2024-2029 (%)
- Data Table on Supermarkets or hypermarkets - Year-over-year growth 2024-2029 (%)
- 8.4 Convenience stores - Market size and forecast 2024-2029
- Chart on Convenience stores - Market size and forecast 2024-2029 ($ billion)
- Data Table on Convenience stores - Market size and forecast 2024-2029 ($ billion)
- Chart on Convenience stores - Year-over-year growth 2024-2029 (%)
- Data Table on Convenience stores - Year-over-year growth 2024-2029 (%)
- 8.5 Online stores - Market size and forecast 2024-2029
- Chart on Online stores - Market size and forecast 2024-2029 ($ billion)
- Data Table on Online stores - Market size and forecast 2024-2029 ($ billion)
- Chart on Online stores - Year-over-year growth 2024-2029 (%)
- Data Table on Online stores - Year-over-year growth 2024-2029 (%)
- 8.6 Specialty stores - Market size and forecast 2024-2029
- Chart on Specialty stores - Market size and forecast 2024-2029 ($ billion)
- Data Table on Specialty stores - Market size and forecast 2024-2029 ($ billion)
- Chart on Specialty stores - Year-over-year growth 2024-2029 (%)
- Data Table on Specialty stores - Year-over-year growth 2024-2029 (%)
- 8.7 Market opportunity by End-user
- Market opportunity by End-user ($ billion)
- Data Table on Market opportunity by End-user ($ billion)
9 Market Segmentation by Product
- 9.1 Market segments
- Chart on Product - Market share 2024-2029 (%)
- Data Table on Product - Market share 2024-2029 (%)
- 9.2 Comparison by Product
- Chart on Comparison by Product
- Data Table on Comparison by Product
- 9.3 Sugar-free beverages - Market size and forecast 2024-2029
- Chart on Sugar-free beverages - Market size and forecast 2024-2029 ($ billion)
- Data Table on Sugar-free beverages - Market size and forecast 2024-2029 ($ billion)
- Chart on Sugar-free beverages - Year-over-year growth 2024-2029 (%)
- Data Table on Sugar-free beverages - Year-over-year growth 2024-2029 (%)
- 9.4 Sugar-free dairy products - Market size and forecast 2024-2029
- Chart on Sugar-free dairy products - Market size and forecast 2024-2029 ($ billion)
- Data Table on Sugar-free dairy products - Market size and forecast 2024-2029 ($ billion)
- Chart on Sugar-free dairy products - Year-over-year growth 2024-2029 (%)
- Data Table on Sugar-free dairy products - Year-over-year growth 2024-2029 (%)
- 9.5 Sugar-free confectionery - Market size and forecast 2024-2029
- Chart on Sugar-free confectionery - Market size and forecast 2024-2029 ($ billion)
- Data Table on Sugar-free confectionery - Market size and forecast 2024-2029 ($ billion)
- Chart on Sugar-free confectionery - Year-over-year growth 2024-2029 (%)
- Data Table on Sugar-free confectionery - Year-over-year growth 2024-2029 (%)
- 9.6 Sugar-free bakery - Market size and forecast 2024-2029
- Chart on Sugar-free bakery - Market size and forecast 2024-2029 ($ billion)
- Data Table on Sugar-free bakery - Market size and forecast 2024-2029 ($ billion)
- Chart on Sugar-free bakery - Year-over-year growth 2024-2029 (%)
- Data Table on Sugar-free bakery - Year-over-year growth 2024-2029 (%)
- 9.7 Sugar-free ice-creams - Market size and forecast 2024-2029
- Chart on Sugar-free ice-creams - Market size and forecast 2024-2029 ($ billion)
- Data Table on Sugar-free ice-creams - Market size and forecast 2024-2029 ($ billion)
- Chart on Sugar-free ice-creams - Year-over-year growth 2024-2029 (%)
- Data Table on Sugar-free ice-creams - Year-over-year growth 2024-2029 (%)
- 9.8 Market opportunity by Product
- Market opportunity by Product ($ billion)
- Data Table on Market opportunity by Product ($ billion)
10 Market Segmentation by Product Type
- 10.1 Market segments
- Chart on Product Type - Market share 2024-2029 (%)
- Data Table on Product Type - Market share 2024-2029 (%)
- 10.2 Comparison by Product Type
- Chart on Comparison by Product Type
- Data Table on Comparison by Product Type
- 10.3 Artificial sweeteners - Market size and forecast 2024-2029
- Chart on Artificial sweeteners - Market size and forecast 2024-2029 ($ billion)
- Data Table on Artificial sweeteners - Market size and forecast 2024-2029 ($ billion)
- Chart on Artificial sweeteners - Year-over-year growth 2024-2029 (%)
- Data Table on Artificial sweeteners - Year-over-year growth 2024-2029 (%)
- 10.4 Natural sweeteners - Market size and forecast 2024-2029
- Chart on Natural sweeteners - Market size and forecast 2024-2029 ($ billion)
- Data Table on Natural sweeteners - Market size and forecast 2024-2029 ($ billion)
- Chart on Natural sweeteners - Year-over-year growth 2024-2029 (%)
- Data Table on Natural sweeteners - Year-over-year growth 2024-2029 (%)
- 10.5 Sugar alcohols - Market size and forecast 2024-2029
- Chart on Sugar alcohols - Market size and forecast 2024-2029 ($ billion)
- Data Table on Sugar alcohols - Market size and forecast 2024-2029 ($ billion)
- Chart on Sugar alcohols - Year-over-year growth 2024-2029 (%)
- Data Table on Sugar alcohols - Year-over-year growth 2024-2029 (%)
- 10.6 Market opportunity by Product Type
- Market opportunity by Product Type ($ billion)
- Data Table on Market opportunity by Product Type ($ billion)
11 Market Segmentation by Packaging
- 11.1 Market segments
- Chart on Packaging - Market share 2024-2029 (%)
- Data Table on Packaging - Market share 2024-2029 (%)
- 11.2 Comparison by Packaging
- Chart on Comparison by Packaging
- Data Table on Comparison by Packaging
- 11.3 Bottles and cans - Market size and forecast 2024-2029
- Chart on Bottles and cans - Market size and forecast 2024-2029 ($ billion)
- Data Table on Bottles and cans - Market size and forecast 2024-2029 ($ billion)
- Chart on Bottles and cans - Year-over-year growth 2024-2029 (%)
- Data Table on Bottles and cans - Year-over-year growth 2024-2029 (%)
- 11.4 Pouches and sachets - Market size and forecast 2024-2029
- Chart on Pouches and sachets - Market size and forecast 2024-2029 ($ billion)
- Data Table on Pouches and sachets - Market size and forecast 2024-2029 ($ billion)
- Chart on Pouches and sachets - Year-over-year growth 2024-2029 (%)
- Data Table on Pouches and sachets - Year-over-year growth 2024-2029 (%)
- 11.5 Boxes and cartons - Market size and forecast 2024-2029
- Chart on Boxes and cartons - Market size and forecast 2024-2029 ($ billion)
- Data Table on Boxes and cartons - Market size and forecast 2024-2029 ($ billion)
- Chart on Boxes and cartons - Year-over-year growth 2024-2029 (%)
- Data Table on Boxes and cartons - Year-over-year growth 2024-2029 (%)
- 11.6 Market opportunity by Packaging
- Market opportunity by Packaging ($ billion)
- Data Table on Market opportunity by Packaging ($ billion)
12 Customer Landscape
- 12.1 Customer landscape overview
- Analysis of price sensitivity, lifecycle, customer purchase basket, adoption rates, and purchase criteria
13 Geographic Landscape
- 13.1 Geographic segmentation
- Chart on Market share By Geographical Landscape 2024-2029 (%)
- Data Table on Market share By Geographical Landscape 2024-2029 (%)
- 13.2 Geographic comparison
- Chart on Geographic comparison
- Data Table on Geographic comparison
- 13.3 North America - Market size and forecast 2024-2029
- Chart on North America - Market size and forecast 2024-2029 ($ billion)
- Data Table on North America - Market size and forecast 2024-2029 ($ billion)
- Chart on North America - Year-over-year growth 2024-2029 (%)
- Data Table on North America - Year-over-year growth 2024-2029 (%)
- 13.4 Europe - Market size and forecast 2024-2029
- Chart on Europe - Market size and forecast 2024-2029 ($ billion)
- Data Table on Europe - Market size and forecast 2024-2029 ($ billion)
- Chart on Europe - Year-over-year growth 2024-2029 (%)
- Data Table on Europe - Year-over-year growth 2024-2029 (%)
- 13.5 APAC - Market size and forecast 2024-2029
- Chart on APAC - Market size and forecast 2024-2029 ($ billion)
- Data Table on APAC - Market size and forecast 2024-2029 ($ billion)
- Chart on APAC - Year-over-year growth 2024-2029 (%)
- Data Table on APAC - Year-over-year growth 2024-2029 (%)
- 13.6 South America - Market size and forecast 2024-2029
- Chart on South America - Market size and forecast 2024-2029 ($ billion)
- Data Table on South America - Market size and forecast 2024-2029 ($ billion)
- Chart on South America - Year-over-year growth 2024-2029 (%)
- Data Table on South America - Year-over-year growth 2024-2029 (%)
- 13.7 Middle East and Africa - Market size and forecast 2024-2029
- Chart on Middle East and Africa - Market size and forecast 2024-2029 ($ billion)
- Data Table on Middle East and Africa - Market size and forecast 2024-2029 ($ billion)
- Chart on Middle East and Africa - Year-over-year growth 2024-2029 (%)
- Data Table on Middle East and Africa - Year-over-year growth 2024-2029 (%)
- 13.8 US - Market size and forecast 2024-2029
- Chart on US - Market size and forecast 2024-2029 ($ billion)
- Data Table on US - Market size and forecast 2024-2029 ($ billion)
- Chart on US - Year-over-year growth 2024-2029 (%)
- Data Table on US - Year-over-year growth 2024-2029 (%)
- 13.9 China - Market size and forecast 2024-2029
- Chart on China - Market size and forecast 2024-2029 ($ billion)
- Data Table on China - Market size and forecast 2024-2029 ($ billion)
- Chart on China - Year-over-year growth 2024-2029 (%)
- Data Table on China - Year-over-year growth 2024-2029 (%)
- 13.10 Canada - Market size and forecast 2024-2029
- Chart on Canada - Market size and forecast 2024-2029 ($ billion)
- Data Table on Canada - Market size and forecast 2024-2029 ($ billion)
- Chart on Canada - Year-over-year growth 2024-2029 (%)
- Data Table on Canada - Year-over-year growth 2024-2029 (%)
- 13.11 Germany - Market size and forecast 2024-2029
- Chart on Germany - Market size and forecast 2024-2029 ($ billion)
- Data Table on Germany - Market size and forecast 2024-2029 ($ billion)
- Chart on Germany - Year-over-year growth 2024-2029 (%)
- Data Table on Germany - Year-over-year growth 2024-2029 (%)
- 13.12 Italy - Market size and forecast 2024-2029
- Chart on Italy - Market size and forecast 2024-2029 ($ billion)
- Data Table on Italy - Market size and forecast 2024-2029 ($ billion)
- Chart on Italy - Year-over-year growth 2024-2029 (%)
- Data Table on Italy - Year-over-year growth 2024-2029 (%)
- 13.13 UK - Market size and forecast 2024-2029
- Chart on UK - Market size and forecast 2024-2029 ($ billion)
- Data Table on UK - Market size and forecast 2024-2029 ($ billion)
- Chart on UK - Year-over-year growth 2024-2029 (%)
- Data Table on UK - Year-over-year growth 2024-2029 (%)
- 13.14 France - Market size and forecast 2024-2029
- Chart on France - Market size and forecast 2024-2029 ($ billion)
- Data Table on France - Market size and forecast 2024-2029 ($ billion)
- Chart on France - Year-over-year growth 2024-2029 (%)
- Data Table on France - Year-over-year growth 2024-2029 (%)
- 13.15 Brazil - Market size and forecast 2024-2029
- Chart on Brazil - Market size and forecast 2024-2029 ($ billion)
- Data Table on Brazil - Market size and forecast 2024-2029 ($ billion)
- Chart on Brazil - Year-over-year growth 2024-2029 (%)
- Data Table on Brazil - Year-over-year growth 2024-2029 (%)
- 13.16 India - Market size and forecast 2024-2029
- Chart on India - Market size and forecast 2024-2029 ($ billion)
- Data Table on India - Market size and forecast 2024-2029 ($ billion)
- Chart on India - Year-over-year growth 2024-2029 (%)
- Data Table on India - Year-over-year growth 2024-2029 (%)
- 13.17 Australia - Market size and forecast 2024-2029
- Chart on Australia - Market size and forecast 2024-2029 ($ billion)
- Data Table on Australia - Market size and forecast 2024-2029 ($ billion)
- Chart on Australia - Year-over-year growth 2024-2029 (%)
- Data Table on Australia - Year-over-year growth 2024-2029 (%)
- 13.18 Market opportunity By Geographical Landscape
- Market opportunity By Geographical Landscape ($ billion)
- Data Tables on Market opportunity By Geographical Landscape ($ billion)
14 Drivers, Challenges, and Opportunity/Restraints
- 14.1 Market drivers
- 14.2 Market challenges
- 14.3 Impact of drivers and challenges
- Impact of drivers and challenges in 2024 and 2029
- 14.4 Market opportunities/restraints
15 Competitive Landscape
- 15.1 Overview
- 15.2 Competitive Landscape
- Overview on criticality of inputs and factors of differentiation
- 15.3 Landscape disruption
- Overview on factors of disruption
- 15.4 Industry risks
- Impact of key risks on business
16 Competitive Analysis
- 16.1 Companies profiled
- Companies covered
- 16.2 Company ranking index
- Company ranking index
- 16.3 Market positioning of companies
- Matrix on companies position and classification
- 16.4 Atkinson Candy Co.
- Atkinson Candy Co. - Overview
- Atkinson Candy Co. - Product / Service
- Atkinson Candy Co. - Key offerings
- SWOT
- 16.5 Chocoladefabriken Lindt and Sprungli AG
- Chocoladefabriken Lindt and Sprungli AG - Overview
- Chocoladefabriken Lindt and Sprungli AG - Business segments
- Chocoladefabriken Lindt and Sprungli AG - Key news
- Chocoladefabriken Lindt and Sprungli AG - Key offerings
- Chocoladefabriken Lindt and Sprungli AG - Segment focus
- SWOT
- 16.6 Flowers Foods Inc.
- Flowers Foods Inc. - Overview
- Flowers Foods Inc. - Product / Service
- Flowers Foods Inc. - Key news
- Flowers Foods Inc. - Key offerings
- SWOT
- 16.7 General Mills Inc.
- General Mills Inc. - Overview
- General Mills Inc. - Business segments
- General Mills Inc. - Key news
- General Mills Inc. - Key offerings
- General Mills Inc. - Segment focus
- SWOT
- 16.8 Gujarat Cooperative Milk Marketing Federation Ltd.
- Gujarat Cooperative Milk Marketing Federation Ltd. - Overview
- Gujarat Cooperative Milk Marketing Federation Ltd. - Product / Service
- Gujarat Cooperative Milk Marketing Federation Ltd. - Key offerings
- SWOT
- 16.9 Jones Soda Co.
- Jones Soda Co. - Overview
- Jones Soda Co. - Product / Service
- Jones Soda Co. - Key offerings
- SWOT
- 16.10 Kellogg Co.
- Kellogg Co. - Overview
- Kellogg Co. - Business segments
- Kellogg Co. - Key offerings
- Kellogg Co. - Segment focus
- SWOT
- 16.11 Keurig Dr Pepper Inc.
- Keurig Dr Pepper Inc. - Overview
- Keurig Dr Pepper Inc. - Business segments
- Keurig Dr Pepper Inc. - Key news
- Keurig Dr Pepper Inc. - Key offerings
- Keurig Dr Pepper Inc. - Segment focus
- SWOT
- 16.12 Monster Energy Co.
- Monster Energy Co. - Overview
- Monster Energy Co. - Product / Service
- Monster Energy Co. - Key offerings
- SWOT
- 16.13 Nestle SA
- Nestle SA - Overview
- Nestle SA - Business segments
- Nestle SA - Key news
- Nestle SA - Key offerings
- Nestle SA - Segment focus
- SWOT
- 16.14 PepsiCo Inc.
- PepsiCo Inc. - Overview
- PepsiCo Inc. - Business segments
- PepsiCo Inc. - Key news
- PepsiCo Inc. - Key offerings
- PepsiCo Inc. - Segment focus
- SWOT
- 16.15 Russell Stover Chocolates
- Russell Stover Chocolates - Overview
- Russell Stover Chocolates - Product / Service
- Russell Stover Chocolates - Key offerings
- SWOT
- 16.16 The Coca Cola Co.
- The Coca Cola Co. - Overview
- The Coca Cola Co. - Business segments
- The Coca Cola Co. - Key news
- The Coca Cola Co. - Key offerings
- The Coca Cola Co. - Segment focus
- SWOT
- 16.17 The Hershey Co.
- The Hershey Co. - Overview
- The Hershey Co. - Business segments
- The Hershey Co. - Key news
- The Hershey Co. - Key offerings
- The Hershey Co. - Segment focus
- SWOT
- 16.18 The Kraft Heinz Co.
- The Kraft Heinz Co. - Overview
- The Kraft Heinz Co. - Business segments
- The Kraft Heinz Co. - Key news
- The Kraft Heinz Co. - Key offerings
- The Kraft Heinz Co. - Segment focus
- SWOT
17 Appendix
- 17.1 Scope of the report
- 17.2 Inclusions and exclusions checklist
- Inclusions checklist
- Exclusions checklist
- 17.3 Currency conversion rates for US$
- Currency conversion rates for US$
- 17.4 Research methodology
- Research methodology
- 17.5 Data procurement
- Information sources
- 17.6 Data validation
- Data validation
- 17.7 Validation techniques employed for market sizing
- Validation techniques employed for market sizing
- 17.8 Data synthesis
- Data synthesis
- 17.9 360 degree market analysis
- 360 degree market analysis
- 17.10 List of abbreviations
- List of abbreviations

