|
|
市場調査レポート
商品コード
1660848
ブティックホテルの世界市場(2025年~2029年)Global Boutique Hotels Market 2025-2029 |
||||||

|
|||||||
カスタマイズ可能
|
|||||||

| ブティックホテルの世界市場(2025年~2029年) |
|
出版日: 2025年02月15日
発行: TechNavio
ページ情報: 英文 206 Pages
納期: 即納可能
|

全表示
- 概要
- 目次
世界のブティックホテルの市場規模は、2024年~2029年に113億5,850万米ドルに達し、予測期間中のCAGRは7.1%で成長すると予測されています。
当レポートでは、ブティックホテル市場の全体的な分析、市場規模・予測、動向、成長促進要因、課題、約25のベンダーを網羅したベンダー分析などを掲載しています。
当レポートは、現在の市場シナリオ、最新動向と促進要因、市場環境全体に関する最新分析を提供しています。観光産業の拡大、ブティックホテルのオンライン予約の急速な普及、ソーシャルメディアユーザーの増加が市場を牽引しています。
| 市場範囲 | |
|---|---|
| 基準年 | 2025年 |
| 終了年 | 2029年 |
| 予測期間 | 2025年~2029年 |
| 成長モメンタム | 加速 |
| 前年比2025年 | 6.5% |
| CAGR | 7.1% |
| 増分額 | 113億5,850万米ドル |
本調査は、業界の主要参入企業からのインプットを含め、一次情報と二次情報を客観的に組み合わせて実施しました。レポートには、主要企業の分析に加え、包括的な市場規模データ、地域分析によるセグメント、ベンダー情勢が含まれています。レポートには実績データと予測データがあります。
本調査では、ブティックホテルのユニークで本格的な体験が、今後数年間のブティックホテル市場の成長を促進する主要な理由の1つであると特定しています。また、ブティックホテルにおけるウェルネスに焦点を当てたアメニティや地域文化の統合に対する需要の高まりは、市場の大きな需要につながる見込みです。
目次
第1章 エグゼクティブサマリー
- 市場概要
第2章 Technavioの分析
- 価格感度・ライフサイクル・顧客購入バスケット・採用率・購入基準の分析
- インプットの重要性と差別化の要因
- ディスラプションの要因
- 促進要因と課題の影響
第3章 市場情勢
- 市場エコシステム
- 市場の特徴
- バリューチェーン分析
第4章 市場規模
- 市場の定義
- 市場セグメント分析
- 市場規模(2024年)
- 市場の見通し(2024年~2029年)
第5章 市場規模実績
- ブティックホテルの世界市場(2019年~2023年)
- タイプセグメント分析(2019年~2023年)
- チャネルセグメント分析(2019年~2023年)
- サービスタイプセグメント分析(2019年~2023年)
- 地域セグメント分析(2019年~2023年)
- 国セグメント分析(2019年~2023年)
第6章 定性分析
- AIの影響:ブティックホテルの世界市場
第7章 ファイブフォース分析
- ファイブフォースの要約
- 買い手の交渉力
- 供給企業の交渉力
- 新規参入業者の脅威
- 代替品の脅威
- 競争の脅威
- 市況
第8章 市場セグメンテーション:タイプ別
- 市場セグメント
- 比較:タイプ別
- ビジネスホテル:市場規模と予測(2024年~2029年)
- スイートホテル:市場規模と予測(2024年~2029年)
- 空港ホテル:市場規模と予測(2024年~2029年)
- リゾートホテル:市場規模と予測(2024年~2029年)
- 市場機会:タイプ別
第9章 市場セグメンテーション:チャネル別
- 市場セグメント
- 比較:チャネル別
- オンライン予約:市場規模と予測(2024年~2029年)
- 直接予約:市場規模と予測(2024年~2029年)
- 市場機会:チャネル別
第10章 市場セグメンテーション:サービスタイプ別
- 市場セグメント
- 比較:サービスタイプ別
- ラグジュアリーブティックホテル:市場規模と予測(2024年~2029年)
- バジェットブティックホテル:市場規模と予測(2024年~2029年)
- 家族向けブティックホテル:市場規模と予測(2024年~2029年)
- 大人限定ブティックホテル:市場規模と予測(2024年~2029年)
- 市場機会:サービスタイプ別
第11章 顧客情勢
- 顧客情勢の概要
第12章 地域別情勢
- 地域別セグメンテーション
- 地域別比較
- 北米:市場規模と予測(2024年~2029年)
- 欧州:市場規模と予測(2024年~2029年)
- アジア太平洋:市場規模と予測(2024年~2029年)
- 南米:市場規模と予測(2024年~2029年)
- 中東・アフリカ:市場規模と予測(2024年~2029年)
- 米国:市場規模と予測(2024年~2029年)
- カナダ:市場規模と予測(2024年~2029年)
- 中国:市場規模と予測(2024年~2029年)
- 英国:市場規模と予測(2024年~2029年)
- ドイツ:市場規模と予測(2024年~2029年)
- 日本:市場規模と予測(2024年~2029年)
- インド:市場規模と予測(2024年~2029年)
- ブラジル:市場規模と予測(2024年~2029年)
- フランス:市場規模と予測(2024年~2029年)
- イタリア:市場規模と予測(2024年~2029年)
- 市場機会:地域情勢別
第13章 促進要因・課題・機会・抑制要因
- 市場促進要因
- 市場の課題
- 促進要因と課題の影響
- 市場の機会・抑制要因
第14章 競合情勢
- 概要
- 競合情勢
- ディスラプションの状況
- 業界のリスク
第15章 競合分析
- 企業プロファイル
- 企業ランキング指数
- 企業の市場ポジショニング
- Dubai Holding LLC
- Farmhouse Inn
- Four Seasons Hotels Ltd.
- Hilton Worldwide Holdings Inc.
- Hyatt Hotels Corp.
- InterContinental Hotels Group Plc
- ITC Ltd.
- Kerzner International Ltd.
- Mandarin Oriental International Ltd.
- Marriott International Inc.
- Shangri La Asia Ltd.
- The Indian Hotel Co. Ltd.
- The Pod Pte Ltd.
- The Travel Corp.
- Triple Creek Ranch
第16章 付録
The boutique hotels market is forecasted to grow by USD 11358.5 million during 2024-2029, accelerating at a CAGR of 7.1% during the forecast period. The report on the boutique hotels market provides a holistic analysis, market size and forecast, trends, growth drivers, and challenges, as well as vendor analysis covering around 25 vendors.
The report offers an up-to-date analysis regarding the current market scenario, the latest trends and drivers, and the overall market environment. The market is driven by expanding tourism industry, rapid adoption of online booking of boutique hotels, and increased social media users.
| Market Scope | |
|---|---|
| Base Year | 2025 |
| End Year | 2029 |
| Series Year | 2025-2029 |
| Growth Momentum | Accelerate |
| YOY 2025 | 6.5% |
| CAGR | 7.1% |
| Incremental Value | $11358.5 mn |
The study was conducted using an objective combination of primary and secondary information including inputs from key participants in the industry. The report contains a comprehensive market size data, segment with regional analysis and vendor landscape in addition to an analysis of the key companies. Reports have historic and forecast data.
Technavio's boutique hotels market is segmented as below:
By Type
- Business hotels
- Suite hotels
- Airport hotels
- Resort hotels
By Channel
- Online booking
- In-person booking
By Service Type
- Luxury boutique hotels
- Budget boutique hotels
- Family-friendly boutique hotels
- Adults-only boutique hotels
By Geographical Landscape
- North America
- Europe
- APAC
- South America
- Middle East and Africa
This study identifies the unique and authentic experience of boutique hotels as one of the prime reasons driving the boutique hotels market growth during the next few years. Also, rising demand for wellness-focused amenities and integration of local culture in boutique hotels will lead to sizable demand in the market.
The report on the boutique hotels market covers the following areas:
- Boutique Hotels Market sizing
- Boutique Hotels Market forecast
- Boutique Hotels Market industry analysis
The robust vendor analysis is designed to help clients improve their market position, and in line with this, this report provides a detailed analysis of several leading boutique hotels market vendors that include Dubai Holding LLC, Farmhouse Inn, Four Seasons Hotels Ltd., Hilton Worldwide Holdings Inc., Hyatt Hotels Corp., InterContinental Hotels Group PLC, ITC Ltd., Kerzner International Ltd., Koyasan guesthouse Kokuu, Mandarin Oriental International Ltd., Marriott International Inc., Shangri La Asia Ltd., The Indian Hotel Co. Ltd., The Pod Pte Ltd., The Travel Corp., Triple Creek Ranch, and Yotel Ltd.. Also, the boutique hotels market analysis report includes information on upcoming trends and challenges that will influence market growth. This is to help companies strategize and leverage all forthcoming growth opportunities.
The publisher presents a detailed picture of the market by the way of study, synthesis, and summation of data from multiple sources by an analysis of key parameters such as profit, pricing, competition, and promotions. It presents various market facets by identifying the key industry influencers. The data presented is comprehensive, reliable, and a result of extensive primary and secondary research. The market research reports provide a complete competitive landscape and an in-depth vendor selection methodology and analysis using qualitative and quantitative research to forecast accurate market growth.
Table of Contents
1 Executive Summary
- 1.1 Market overview
- Executive Summary - Chart on Market Overview
- Executive Summary - Data Table on Market Overview
- Executive Summary - Chart on Global Market Characteristics
- Executive Summary - Chart on Market By Geographical Landscape
- Executive Summary - Chart on Market Segmentation by Type
- Executive Summary - Chart on Market Segmentation by Channel
- Executive Summary - Chart on Market Segmentation by Service Type
- Executive Summary - Chart on Incremental Growth
- Executive Summary - Data Table on Incremental Growth
- Executive Summary - Chart on Company Market Positioning
2 Technavio Analysis
- 2.1 Analysis of price sensitivity, lifecycle, customer purchase basket, adoption rates, and purchase criteria
- Analysis of price sensitivity, lifecycle, customer purchase basket, adoption rates, and purchase criteria
- 2.2 Criticality of inputs and Factors of differentiation
- Overview on criticality of inputs and factors of differentiation
- 2.3 Factors of disruption
- Overview on factors of disruption
- 2.4 Impact of drivers and challenges
- Impact of drivers and challenges in 2024 and 2029
3 Market Landscape
- 3.1 Market ecosystem
- Parent Market
- Data Table on - Parent Market
- 3.2 Market characteristics
- Market characteristics analysis
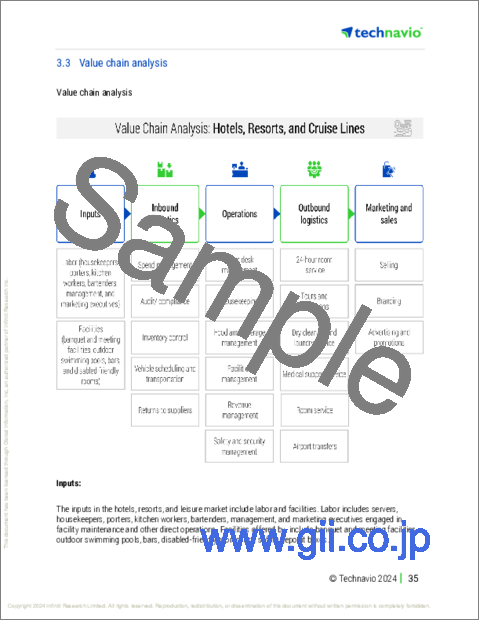
- 3.3 Value chain analysis
- Value chain analysis
4 Market Sizing
- 4.1 Market definition
- Offerings of companies included in the market definition
- 4.2 Market segment analysis
- Market segments
- 4.3 Market size 2024
- 4.4 Market outlook: Forecast for 2024-2029
- Chart on Global - Market size and forecast 2024-2029 ($ million)
- Data Table on Global - Market size and forecast 2024-2029 ($ million)
- Chart on Global Market: Year-over-year growth 2024-2029 (%)
- Data Table on Global Market: Year-over-year growth 2024-2029 (%)
5 Historic Market Size
- 5.1 Global Boutique Hotels Market 2019 - 2023
- Historic Market Size - Data Table on Global Boutique Hotels Market 2019 - 2023 ($ million)
- 5.2 Type segment analysis 2019 - 2023
- Historic Market Size - Type Segment 2019 - 2023 ($ million)
- 5.3 Channel segment analysis 2019 - 2023
- Historic Market Size - Channel Segment 2019 - 2023 ($ million)
- 5.4 Service Type segment analysis 2019 - 2023
- Historic Market Size - Service Type Segment 2019 - 2023 ($ million)
- 5.5 Geography segment analysis 2019 - 2023
- Historic Market Size - Geography Segment 2019 - 2023 ($ million)
- 5.6 Country segment analysis 2019 - 2023
- Historic Market Size - Country Segment 2019 - 2023 ($ million)
6 Qualitative Analysis
- 6.1 Impact of AI on Global Boutique Hotels Market
7 Five Forces Analysis
- 7.1 Five forces summary
- Five forces analysis - Comparison between 2024 and 2029
- 7.2 Bargaining power of buyers
- Bargaining power of buyers - Impact of key factors 2024 and 2029
- 7.3 Bargaining power of suppliers
- Bargaining power of suppliers - Impact of key factors in 2024 and 2029
- 7.4 Threat of new entrants
- Threat of new entrants - Impact of key factors in 2024 and 2029
- 7.5 Threat of substitutes
- Threat of substitutes - Impact of key factors in 2024 and 2029
- 7.6 Threat of rivalry
- Threat of rivalry - Impact of key factors in 2024 and 2029
- 7.7 Market condition
- Chart on Market condition - Five forces 2024 and 2029
8 Market Segmentation by Type
- 8.1 Market segments
- Chart on Type - Market share 2024-2029 (%)
- Data Table on Type - Market share 2024-2029 (%)
- 8.2 Comparison by Type
- Chart on Comparison by Type
- Data Table on Comparison by Type
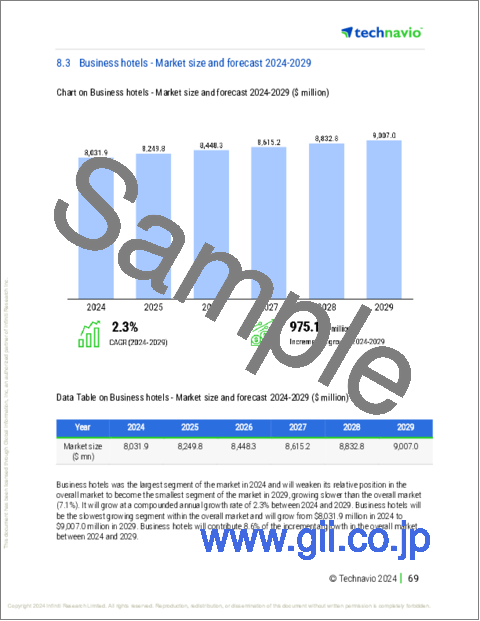
- 8.3 Business hotels - Market size and forecast 2024-2029
- Chart on Business hotels - Market size and forecast 2024-2029 ($ million)
- Data Table on Business hotels - Market size and forecast 2024-2029 ($ million)
- Chart on Business hotels - Year-over-year growth 2024-2029 (%)
- Data Table on Business hotels - Year-over-year growth 2024-2029 (%)
- 8.4 Suite hotels - Market size and forecast 2024-2029
- Chart on Suite hotels - Market size and forecast 2024-2029 ($ million)
- Data Table on Suite hotels - Market size and forecast 2024-2029 ($ million)
- Chart on Suite hotels - Year-over-year growth 2024-2029 (%)
- Data Table on Suite hotels - Year-over-year growth 2024-2029 (%)
- 8.5 Airport hotels - Market size and forecast 2024-2029
- Chart on Airport hotels - Market size and forecast 2024-2029 ($ million)
- Data Table on Airport hotels - Market size and forecast 2024-2029 ($ million)
- Chart on Airport hotels - Year-over-year growth 2024-2029 (%)
- Data Table on Airport hotels - Year-over-year growth 2024-2029 (%)
- 8.6 Resort hotels - Market size and forecast 2024-2029
- Chart on Resort hotels - Market size and forecast 2024-2029 ($ million)
- Data Table on Resort hotels - Market size and forecast 2024-2029 ($ million)
- Chart on Resort hotels - Year-over-year growth 2024-2029 (%)
- Data Table on Resort hotels - Year-over-year growth 2024-2029 (%)
- 8.7 Market opportunity by Type
- Market opportunity by Type ($ million)
- Data Table on Market opportunity by Type ($ million)
9 Market Segmentation by Channel
- 9.1 Market segments
- Chart on Channel - Market share 2024-2029 (%)
- Data Table on Channel - Market share 2024-2029 (%)
- 9.2 Comparison by Channel
- Chart on Comparison by Channel
- Data Table on Comparison by Channel
- 9.3 Online booking - Market size and forecast 2024-2029
- Chart on Online booking - Market size and forecast 2024-2029 ($ million)
- Data Table on Online booking - Market size and forecast 2024-2029 ($ million)
- Chart on Online booking - Year-over-year growth 2024-2029 (%)
- Data Table on Online booking - Year-over-year growth 2024-2029 (%)
- 9.4 In-person booking - Market size and forecast 2024-2029
- Chart on In-person booking - Market size and forecast 2024-2029 ($ million)
- Data Table on In-person booking - Market size and forecast 2024-2029 ($ million)
- Chart on In-person booking - Year-over-year growth 2024-2029 (%)
- Data Table on In-person booking - Year-over-year growth 2024-2029 (%)
- 9.5 Market opportunity by Channel
- Market opportunity by Channel ($ million)
- Data Table on Market opportunity by Channel ($ million)
10 Market Segmentation by Service Type
- 10.1 Market segments
- Chart on Service Type - Market share 2024-2029 (%)
- Data Table on Service Type - Market share 2024-2029 (%)
- 10.2 Comparison by Service Type
- Chart on Comparison by Service Type
- Data Table on Comparison by Service Type
- 10.3 Luxury boutique hotels - Market size and forecast 2024-2029
- Chart on Luxury boutique hotels - Market size and forecast 2024-2029 ($ million)
- Data Table on Luxury boutique hotels - Market size and forecast 2024-2029 ($ million)
- Chart on Luxury boutique hotels - Year-over-year growth 2024-2029 (%)
- Data Table on Luxury boutique hotels - Year-over-year growth 2024-2029 (%)
- 10.4 Budget boutique hotels - Market size and forecast 2024-2029
- Chart on Budget boutique hotels - Market size and forecast 2024-2029 ($ million)
- Data Table on Budget boutique hotels - Market size and forecast 2024-2029 ($ million)
- Chart on Budget boutique hotels - Year-over-year growth 2024-2029 (%)
- Data Table on Budget boutique hotels - Year-over-year growth 2024-2029 (%)
- 10.5 Family-friendly boutique hotels - Market size and forecast 2024-2029
- Chart on Family-friendly boutique hotels - Market size and forecast 2024-2029 ($ million)
- Data Table on Family-friendly boutique hotels - Market size and forecast 2024-2029 ($ million)
- Chart on Family-friendly boutique hotels - Year-over-year growth 2024-2029 (%)
- Data Table on Family-friendly boutique hotels - Year-over-year growth 2024-2029 (%)
- 10.6 Adults-only boutique hotels - Market size and forecast 2024-2029
- Chart on Adults-only boutique hotels - Market size and forecast 2024-2029 ($ million)
- Data Table on Adults-only boutique hotels - Market size and forecast 2024-2029 ($ million)
- Chart on Adults-only boutique hotels - Year-over-year growth 2024-2029 (%)
- Data Table on Adults-only boutique hotels - Year-over-year growth 2024-2029 (%)
- 10.7 Market opportunity by Service Type
- Market opportunity by Service Type ($ million)
- Data Table on Market opportunity by Service Type ($ million)
11 Customer Landscape
- 11.1 Customer landscape overview
- Analysis of price sensitivity, lifecycle, customer purchase basket, adoption rates, and purchase criteria
12 Geographic Landscape
- 12.1 Geographic segmentation
- Chart on Market share By Geographical Landscape 2024-2029 (%)
- Data Table on Market share By Geographical Landscape 2024-2029 (%)
- 12.2 Geographic comparison
- Chart on Geographic comparison
- Data Table on Geographic comparison
- 12.3 North America - Market size and forecast 2024-2029
- Chart on North America - Market size and forecast 2024-2029 ($ million)
- Data Table on North America - Market size and forecast 2024-2029 ($ million)
- Chart on North America - Year-over-year growth 2024-2029 (%)
- Data Table on North America - Year-over-year growth 2024-2029 (%)
- 12.4 Europe - Market size and forecast 2024-2029
- Chart on Europe - Market size and forecast 2024-2029 ($ million)
- Data Table on Europe - Market size and forecast 2024-2029 ($ million)
- Chart on Europe - Year-over-year growth 2024-2029 (%)
- Data Table on Europe - Year-over-year growth 2024-2029 (%)
- 12.5 APAC - Market size and forecast 2024-2029
- Chart on APAC - Market size and forecast 2024-2029 ($ million)
- Data Table on APAC - Market size and forecast 2024-2029 ($ million)
- Chart on APAC - Year-over-year growth 2024-2029 (%)
- Data Table on APAC - Year-over-year growth 2024-2029 (%)
- 12.6 South America - Market size and forecast 2024-2029
- Chart on South America - Market size and forecast 2024-2029 ($ million)
- Data Table on South America - Market size and forecast 2024-2029 ($ million)
- Chart on South America - Year-over-year growth 2024-2029 (%)
- Data Table on South America - Year-over-year growth 2024-2029 (%)
- 12.7 Middle East and Africa - Market size and forecast 2024-2029
- Chart on Middle East and Africa - Market size and forecast 2024-2029 ($ million)
- Data Table on Middle East and Africa - Market size and forecast 2024-2029 ($ million)
- Chart on Middle East and Africa - Year-over-year growth 2024-2029 (%)
- Data Table on Middle East and Africa - Year-over-year growth 2024-2029 (%)
- 12.8 US - Market size and forecast 2024-2029
- Chart on US - Market size and forecast 2024-2029 ($ million)
- Data Table on US - Market size and forecast 2024-2029 ($ million)
- Chart on US - Year-over-year growth 2024-2029 (%)
- Data Table on US - Year-over-year growth 2024-2029 (%)
- 12.9 Canada - Market size and forecast 2024-2029
- Chart on Canada - Market size and forecast 2024-2029 ($ million)
- Data Table on Canada - Market size and forecast 2024-2029 ($ million)
- Chart on Canada - Year-over-year growth 2024-2029 (%)
- Data Table on Canada - Year-over-year growth 2024-2029 (%)
- 12.10 China - Market size and forecast 2024-2029
- Chart on China - Market size and forecast 2024-2029 ($ million)
- Data Table on China - Market size and forecast 2024-2029 ($ million)
- Chart on China - Year-over-year growth 2024-2029 (%)
- Data Table on China - Year-over-year growth 2024-2029 (%)
- 12.11 UK - Market size and forecast 2024-2029
- Chart on UK - Market size and forecast 2024-2029 ($ million)
- Data Table on UK - Market size and forecast 2024-2029 ($ million)
- Chart on UK - Year-over-year growth 2024-2029 (%)
- Data Table on UK - Year-over-year growth 2024-2029 (%)
- 12.12 Germany - Market size and forecast 2024-2029
- Chart on Germany - Market size and forecast 2024-2029 ($ million)
- Data Table on Germany - Market size and forecast 2024-2029 ($ million)
- Chart on Germany - Year-over-year growth 2024-2029 (%)
- Data Table on Germany - Year-over-year growth 2024-2029 (%)
- 12.13 Japan - Market size and forecast 2024-2029
- Chart on Japan - Market size and forecast 2024-2029 ($ million)
- Data Table on Japan - Market size and forecast 2024-2029 ($ million)
- Chart on Japan - Year-over-year growth 2024-2029 (%)
- Data Table on Japan - Year-over-year growth 2024-2029 (%)
- 12.14 India - Market size and forecast 2024-2029
- Chart on India - Market size and forecast 2024-2029 ($ million)
- Data Table on India - Market size and forecast 2024-2029 ($ million)
- Chart on India - Year-over-year growth 2024-2029 (%)
- Data Table on India - Year-over-year growth 2024-2029 (%)
- 12.15 Brazil - Market size and forecast 2024-2029
- Chart on Brazil - Market size and forecast 2024-2029 ($ million)
- Data Table on Brazil - Market size and forecast 2024-2029 ($ million)
- Chart on Brazil - Year-over-year growth 2024-2029 (%)
- Data Table on Brazil - Year-over-year growth 2024-2029 (%)
- 12.16 France - Market size and forecast 2024-2029
- Chart on France - Market size and forecast 2024-2029 ($ million)
- Data Table on France - Market size and forecast 2024-2029 ($ million)
- Chart on France - Year-over-year growth 2024-2029 (%)
- Data Table on France - Year-over-year growth 2024-2029 (%)
- 12.17 Italy - Market size and forecast 2024-2029
- Chart on Italy - Market size and forecast 2024-2029 ($ million)
- Data Table on Italy - Market size and forecast 2024-2029 ($ million)
- Chart on Italy - Year-over-year growth 2024-2029 (%)
- Data Table on Italy - Year-over-year growth 2024-2029 (%)
- 12.18 Market opportunity By Geographical Landscape
- Market opportunity By Geographical Landscape ($ million)
- Data Tables on Market opportunity By Geographical Landscape ($ million)
13 Drivers, Challenges, and Opportunity/Restraints
- 13.1 Market drivers
- 13.2 Market challenges
- 13.3 Impact of drivers and challenges
- Impact of drivers and challenges in 2024 and 2029
- 13.4 Market opportunities/restraints
14 Competitive Landscape
- 14.1 Overview
- 14.2 Competitive Landscape
- Overview on criticality of inputs and factors of differentiation
- 14.3 Landscape disruption
- Overview on factors of disruption
- 14.4 Industry risks
- Impact of key risks on business
15 Competitive Analysis
- 15.1 Companies profiled
- Companies covered
- 15.2 Company ranking index
- Company ranking index
- 15.3 Market positioning of companies
- Matrix on companies position and classification
- 15.4 Dubai Holding LLC
- Dubai Holding LLC - Overview
- Dubai Holding LLC - Product / Service
- Dubai Holding LLC - Key offerings
- SWOT
- 15.5 Farmhouse Inn
- Farmhouse Inn - Overview
- Farmhouse Inn - Product / Service
- Farmhouse Inn - Key offerings
- SWOT
- 15.6 Four Seasons Hotels Ltd.
- Four Seasons Hotels Ltd. - Overview
- Four Seasons Hotels Ltd. - Product / Service
- Four Seasons Hotels Ltd. - Key offerings
- SWOT
- 15.7 Hilton Worldwide Holdings Inc.
- Hilton Worldwide Holdings Inc. - Overview
- Hilton Worldwide Holdings Inc. - Business segments
- Hilton Worldwide Holdings Inc. - Key offerings
- Hilton Worldwide Holdings Inc. - Segment focus
- SWOT
- 15.8 Hyatt Hotels Corp.
- Hyatt Hotels Corp. - Overview
- Hyatt Hotels Corp. - Business segments
- Hyatt Hotels Corp. - Key offerings
- Hyatt Hotels Corp. - Segment focus
- SWOT
- 15.9 InterContinental Hotels Group Plc
- InterContinental Hotels Group Plc - Overview
- InterContinental Hotels Group Plc - Product / Service
- InterContinental Hotels Group Plc - Key offerings
- SWOT
- 15.10 ITC Ltd.
- ITC Ltd. - Overview
- ITC Ltd. - Business segments
- ITC Ltd. - Key news
- ITC Ltd. - Key offerings
- ITC Ltd. - Segment focus
- SWOT
- 15.11 Kerzner International Ltd.
- Kerzner International Ltd. - Overview
- Kerzner International Ltd. - Product / Service
- Kerzner International Ltd. - Key offerings
- SWOT
- 15.12 Mandarin Oriental International Ltd.
- Mandarin Oriental International Ltd. - Overview
- Mandarin Oriental International Ltd. - Business segments
- Mandarin Oriental International Ltd. - Key offerings
- Mandarin Oriental International Ltd. - Segment focus
- SWOT
- 15.13 Marriott International Inc.
- Marriott International Inc. - Overview
- Marriott International Inc. - Business segments
- Marriott International Inc. - Key news
- Marriott International Inc. - Key offerings
- Marriott International Inc. - Segment focus
- SWOT
- 15.14 Shangri La Asia Ltd.
- Shangri La Asia Ltd. - Overview
- Shangri La Asia Ltd. - Product / Service
- Shangri La Asia Ltd. - Key offerings
- SWOT
- 15.15 The Indian Hotel Co. Ltd.
- The Indian Hotel Co. Ltd. - Overview
- The Indian Hotel Co. Ltd. - Product / Service
- The Indian Hotel Co. Ltd. - Key offerings
- SWOT
- 15.16 The Pod Pte Ltd.
- The Pod Pte Ltd. - Overview
- The Pod Pte Ltd. - Product / Service
- The Pod Pte Ltd. - Key offerings
- SWOT
- 15.17 The Travel Corp.
- The Travel Corp. - Overview
- The Travel Corp. - Product / Service
- The Travel Corp. - Key offerings
- SWOT
- 15.18 Triple Creek Ranch
- Triple Creek Ranch - Overview
- Triple Creek Ranch - Product / Service
- Triple Creek Ranch - Key offerings
- SWOT
16 Appendix
- 16.1 Scope of the report
- 16.2 Inclusions and exclusions checklist
- Inclusions checklist
- Exclusions checklist
- 16.3 Currency conversion rates for US$
- Currency conversion rates for US$
- 16.4 Research methodology
- Research methodology
- 16.5 Data procurement
- Information sources
- 16.6 Data validation
- Data validation
- 16.7 Validation techniques employed for market sizing
- Validation techniques employed for market sizing
- 16.8 Data synthesis
- Data synthesis
- 16.9 360 degree market analysis
- 360 degree market analysis
- 16.10 List of abbreviations
- List of abbreviations

