|
|
市場調査レポート
商品コード
1660830
石油・ガス上流設備の世界市場(2025年~2029年)Global Oil and Gas Upstream Equipment Market 2025-2029 |
||||||

|
|||||||
カスタマイズ可能
|
|||||||

| 石油・ガス上流設備の世界市場(2025年~2029年) |
|
出版日: 2025年02月13日
発行: TechNavio
ページ情報: 英文 229 Pages
納期: 即納可能
|

全表示
- 概要
- 目次
世界の石油・ガス上流設備の市場規模は、2024年~2029年に118億1,300万米ドルに達し、予測期間中のCAGRは3.3%で成長すると予測されています。
当レポートでは、石油・ガス上流設備市場の全体的な分析、市場規模・予測、動向、成長促進要因、課題、約25のベンダーを網羅したベンダー分析などを掲載しています。
当レポートは、現在の市場シナリオ、最新動向と促進要因、市場環境全体に関する最新分析を提供しています。パイプライン輸送への嗜好の高まり、世界のエネルギー需要の増加、掘削技術の進歩などが市場を牽引しています。
| 市場範囲 | |
|---|---|
| 基準年 | 2025年 |
| 終了年 | 2029年 |
| 予測期間 | 2025年~2029年 |
| 成長モメンタム | 加速 |
| 前年比2025年 | 3.2% |
| CAGR | 3.3% |
| 増分額 | 118億1,300万米ドル |
本調査は、業界の主要参入企業からのインプットを含め、一次情報と二次情報を客観的に組み合わせて実施しました。レポートには、主要企業の分析に加え、包括的な市場規模データ、地域別分析によるセグメント、ベンダー情勢が含まれています。レポートには実績データと予測データを掲載しています。
本調査では、今後数年間の石油・ガス上流設備市場の成長を促進する主な要因の1つとして、デジタル化と自動化の採用が増加していることを挙げています。また、遠隔監視と制御の拡大、ドローンとロボット工学の出現は、市場の大きな需要につながります。
目次
第1章 エグゼクティブサマリー
- 市場概要
第2章 Technavioの分析
- 価格感度・ライフサイクル・顧客購入バスケット・採用率・購入基準の分析
- インプットの重要性と差別化の要因
- ディスラプションの要因
- 促進要因と課題の影響
第3章 市場情勢
- 市場エコシステム
- 市場の特徴
- バリューチェーン分析
第4章 市場規模
- 市場の定義
- 市場セグメント分析
- 市場規模(2024年)
- 市場の見通し(2024年~2029年)
第5章 市場規模実績
- 石油・ガス上流設備の世界市場(2019年~2023年)
- 用途セグメント分析(2019年~2023年)
- 展開セグメント分析(2019年~2023年)
- タイプセグメント分析(2019年~2023年)
- 地域セグメント分析(2019年~2023年)
- 国セグメント分析(2019年~2023年)
第6章 定性分析
- AIの影響:石油・ガス上流設備の世界市場
第7章 ファイブフォース分析
- ファイブフォースの要約
- 買い手の交渉力
- 供給企業の交渉力
- 新規参入業者の脅威
- 代替品の脅威
- 競争の脅威
- 市況
第8章 市場セグメンテーション:用途別
- 市場セグメント
- 比較:用途別
- 探査と掘削:市場規模と予測(2024年~2029年)
- 完了と処置:市場規模と予測(2024年~2029年)
- その他:市場規模と予測(2024年~2029年)
- 市場機会:用途別
第9章 市場セグメンテーション:展開別
- 市場セグメント
- 比較:展開別
- オンショア:市場規模と予測(2024年~2029年)
- オフショア:市場規模と予測(2024年~2029年)
- 市場機会:展開別
第10章 市場セグメンテーション:タイプ別
- 市場セグメント
- 比較:タイプ別
- 掘削装置:市場規模と予測(2024年~2029年)
- 生産設備:市場規模と予測(2024年~2029年)
- 井戸介入装置:市場規模と予測(2024年~2029年)
- 圧力制御装置:市場規模と予測(2024年~2029年)
- その他:市場規模と予測(2024年~2029年)
- 市場機会:タイプ別
第11章 顧客情勢
- 顧客情勢の概要
第12章 地域別情勢
- 地域別セグメンテーション
- 地域別比較
- 北米:市場規模と予測(2024年~2029年)
- 欧州:市場規模と予測(2024年~2029年)
- アジア太平洋:市場規模と予測(2024年~2029年)
- 南米:市場規模と予測(2024年~2029年)
- 中東・アフリカ:市場規模と予測(2024年~2029年)
- 米国:市場規模と予測(2024年~2029年)
- ドイツ:市場規模と予測(2024年~2029年)
- カナダ:市場規模と予測(2024年~2029年)
- 中国:市場規模と予測(2024年~2029年)
- 英国:市場規模と予測(2024年~2029年)
- ブラジル:市場規模と予測(2024年~2029年)
- 日本:市場規模と予測(2024年~2029年)
- フランス:市場規模と予測(2024年~2029年)
- アラブ首長国連邦:市場規模と予測(2024年~2029年)
- インド:市場規模と予測(2024年~2029年)
- 市場機会:地域情勢別
第13章 促進要因・課題・機会・抑制要因
- 市場促進要因
- 市場の課題
- 促進要因と課題の影響
- 市場の機会・抑制要因
第14章 競合情勢
- 概要
- 競合情勢
- ディスラプションの状況
- 業界のリスク
第15章 競合分析
- 企業プロファイル
- 企業ランキング指数
- 企業の市場ポジショニング
- Aker Solutions ASA
- Archer Ltd.
- Atlas Copco AB
- AXON Pressure Products Inc.
- Dril Quip Inc.
- Evolution Oil Tools Inc.
- Flowserve Corp.
- Forum Energy Technologies Inc.
- General Electric Co.
- Halliburton Co.
- NOV Inc.
- Schlumberger Ltd.
- Siemens AG
- SPX FLOW Inc.
- Weatherford International Plc
第16章 付録
The oil and gas upstream equipment market is forecasted to grow by USD 11813 million during 2024-2029, accelerating at a CAGR of 3.3% during the forecast period. The report on the oil and gas upstream equipment market provides a holistic analysis, market size and forecast, trends, growth drivers, and challenges, as well as vendor analysis covering around 25 vendors.
The report offers an up-to-date analysis regarding the current market scenario, the latest trends and drivers, and the overall market environment. The market is driven by increasing preference for pipeline transportation, rising global energy demand, and advancements in drilling technology.
| Market Scope | |
|---|---|
| Base Year | 2025 |
| End Year | 2029 |
| Series Year | 2025-2029 |
| Growth Momentum | Accelerate |
| YOY 2025 | 3.2% |
| CAGR | 3.3% |
| Incremental Value | $11813 mn |
The study was conducted using an objective combination of primary and secondary information including inputs from key participants in the industry. The report contains a comprehensive market size data, segment with regional analysis and vendor landscape in addition to an analysis of the key companies. Reports have historic and forecast data.
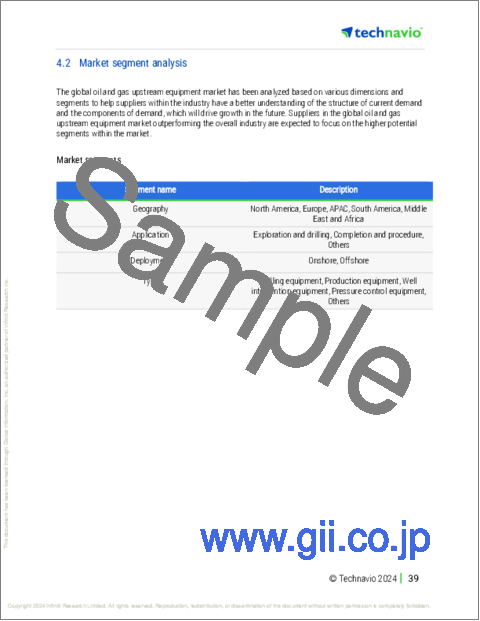
Technavio's oil and gas upstream equipment market is segmented as below:
By Application
- Exploration and drilling
- Completion and procedure
- Others
By Deployment
- Onshore
- Offshore
By Type
- Drilling equipment
- Production equipment
- Well intervention equipment
- Pressure control equipment
- Others
By Geographical Landscape
- North America
- Europe
- APAC
- South America
- Middle East and Africa
This study identifies the rising adoption of digitalization and automation as one of the prime reasons driving the oil and gas upstream equipment market growth during the next few years. Also, increasing remote monitoring and control and emergence of drones and robotics will lead to sizable demand in the market.
The report on the oil and gas upstream equipment market covers the following areas:
- Oil And Gas Upstream Equipment Market sizing
- Oil And Gas Upstream Equipment Market forecast
- Oil And Gas Upstream Equipment Market industry analysis
The robust vendor analysis is designed to help clients improve their market position, and in line with this, this report provides a detailed analysis of several leading oil and gas upstream equipment market vendors that include Aker Solutions ASA, Archer Ltd., ATB Holding Spa, Atlas Copco AB, AXON Pressure Products Inc., Dril Quip Inc., Evolution Oil Tools Inc., Flowserve Corp., Forum Energy Technologies Inc., General Electric Co., Geometrics Inc., Halliburton Co., Helmerich and Payne Inc., NOV Inc., Schlumberger Ltd., Seadrill Ltd., Siemens AG, SPX FLOW Inc., Sumitomo Corp., and Weatherford International PLC. Also, the oil and gas upstream equipment market analysis report includes information on upcoming trends and challenges that will influence market growth. This is to help companies strategize and leverage all forthcoming growth opportunities.
The publisher presents a detailed picture of the market by the way of study, synthesis, and summation of data from multiple sources by an analysis of key parameters such as profit, pricing, competition, and promotions. It presents various market facets by identifying the key industry influencers. The data presented is comprehensive, reliable, and a result of extensive primary and secondary research. The market research reports provide a complete competitive landscape and an in-depth vendor selection methodology and analysis using qualitative and quantitative research to forecast accurate market growth.
Table of Contents
1 Executive Summary
- 1.1 Market overview
- Executive Summary - Chart on Market Overview
- Executive Summary - Data Table on Market Overview
- Executive Summary - Chart on Global Market Characteristics
- Executive Summary - Chart on Market By Geographical Landscape
- Executive Summary - Chart on Market Segmentation by Application
- Executive Summary - Chart on Market Segmentation by Deployment
- Executive Summary - Chart on Market Segmentation by Type
- Executive Summary - Chart on Incremental Growth
- Executive Summary - Data Table on Incremental Growth
- Executive Summary - Chart on Company Market Positioning
2 Technavio Analysis
- 2.1 Analysis of price sensitivity, lifecycle, customer purchase basket, adoption rates, and purchase criteria
- Analysis of price sensitivity, lifecycle, customer purchase basket, adoption rates, and purchase criteria
- 2.2 Criticality of inputs and Factors of differentiation
- Overview on criticality of inputs and factors of differentiation
- 2.3 Factors of disruption
- Overview on factors of disruption
- 2.4 Impact of drivers and challenges
- Impact of drivers and challenges in 2024 and 2029
3 Market Landscape
- 3.1 Market ecosystem
- Parent Market
- Data Table on - Parent Market
- 3.2 Market characteristics
- Market characteristics analysis
- 3.3 Value chain analysis
- Value chain analysis
4 Market Sizing
- 4.1 Market definition
- Offerings of companies included in the market definition
- 4.2 Market segment analysis
- Market segments
- 4.3 Market size 2024
- 4.4 Market outlook: Forecast for 2024-2029
- Chart on Global - Market size and forecast 2024-2029 ($ million)
- Data Table on Global - Market size and forecast 2024-2029 ($ million)
- Chart on Global Market: Year-over-year growth 2024-2029 (%)
- Data Table on Global Market: Year-over-year growth 2024-2029 (%)
5 Historic Market Size
- 5.1 Global Oil And Gas Upstream Equipment Market 2019 - 2023
- Historic Market Size - Data Table on Global Oil And Gas Upstream Equipment Market 2019 - 2023 ($ million)
- 5.2 Application segment analysis 2019 - 2023
- Historic Market Size - Application Segment 2019 - 2023 ($ million)
- 5.3 Deployment segment analysis 2019 - 2023
- Historic Market Size - Deployment Segment 2019 - 2023 ($ million)
- 5.4 Type segment analysis 2019 - 2023
- Historic Market Size - Type Segment 2019 - 2023 ($ million)
- 5.5 Geography segment analysis 2019 - 2023
- Historic Market Size - Geography Segment 2019 - 2023 ($ million)
- 5.6 Country segment analysis 2019 - 2023
- Historic Market Size - Country Segment 2019 - 2023 ($ million)
6 Qualitative Analysis
- 6.1 AI Impact on Global Oil and Gas Upstream Equipment Market
7 Five Forces Analysis
- 7.1 Five forces summary
- Five forces analysis - Comparison between 2024 and 2029
- 7.2 Bargaining power of buyers
- Bargaining power of buyers - Impact of key factors 2024 and 2029
- 7.3 Bargaining power of suppliers
- Bargaining power of suppliers - Impact of key factors in 2024 and 2029
- 7.4 Threat of new entrants
- Threat of new entrants - Impact of key factors in 2024 and 2029
- 7.5 Threat of substitutes
- Threat of substitutes - Impact of key factors in 2024 and 2029
- 7.6 Threat of rivalry
- Threat of rivalry - Impact of key factors in 2024 and 2029
- 7.7 Market condition
- Chart on Market condition - Five forces 2024 and 2029
8 Market Segmentation by Application
- 8.1 Market segments
- Chart on Application - Market share 2024-2029 (%)
- Data Table on Application - Market share 2024-2029 (%)
- 8.2 Comparison by Application
- Chart on Comparison by Application
- Data Table on Comparison by Application
- 8.3 Exploration and drilling - Market size and forecast 2024-2029
- Chart on Exploration and drilling - Market size and forecast 2024-2029 ($ million)
- Data Table on Exploration and drilling - Market size and forecast 2024-2029 ($ million)
- Chart on Exploration and drilling - Year-over-year growth 2024-2029 (%)
- Data Table on Exploration and drilling - Year-over-year growth 2024-2029 (%)
- 8.4 Completion and procedure - Market size and forecast 2024-2029
- Chart on Completion and procedure - Market size and forecast 2024-2029 ($ million)
- Data Table on Completion and procedure - Market size and forecast 2024-2029 ($ million)
- Chart on Completion and procedure - Year-over-year growth 2024-2029 (%)
- Data Table on Completion and procedure - Year-over-year growth 2024-2029 (%)
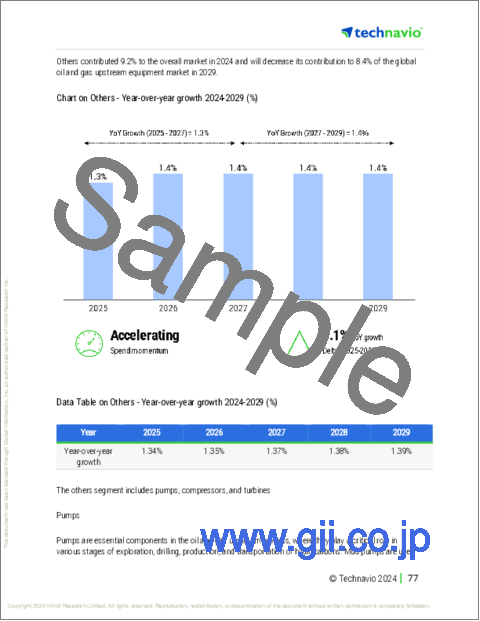
- 8.5 Others - Market size and forecast 2024-2029
- Chart on Others - Market size and forecast 2024-2029 ($ million)
- Data Table on Others - Market size and forecast 2024-2029 ($ million)
- Chart on Others - Year-over-year growth 2024-2029 (%)
- Data Table on Others - Year-over-year growth 2024-2029 (%)
- 8.6 Market opportunity by Application
- Market opportunity by Application ($ million)
- Data Table on Market opportunity by Application ($ million)
9 Market Segmentation by Deployment
- 9.1 Market segments
- Chart on Deployment - Market share 2024-2029 (%)
- Data Table on Deployment - Market share 2024-2029 (%)
- 9.2 Comparison by Deployment
- Chart on Comparison by Deployment
- Data Table on Comparison by Deployment
- 9.3 Onshore - Market size and forecast 2024-2029
- Chart on Onshore - Market size and forecast 2024-2029 ($ million)
- Data Table on Onshore - Market size and forecast 2024-2029 ($ million)
- Chart on Onshore - Year-over-year growth 2024-2029 (%)
- Data Table on Onshore - Year-over-year growth 2024-2029 (%)
- 9.4 Offshore - Market size and forecast 2024-2029
- Chart on Offshore - Market size and forecast 2024-2029 ($ million)
- Data Table on Offshore - Market size and forecast 2024-2029 ($ million)
- Chart on Offshore - Year-over-year growth 2024-2029 (%)
- Data Table on Offshore - Year-over-year growth 2024-2029 (%)
- 9.5 Market opportunity by Deployment
- Market opportunity by Deployment ($ million)
- Data Table on Market opportunity by Deployment ($ million)
10 Market Segmentation by Type
- 10.1 Market segments
- Chart on Type - Market share 2024-2029 (%)
- Data Table on Type - Market share 2024-2029 (%)
- 10.2 Comparison by Type
- Chart on Comparison by Type
- Data Table on Comparison by Type
- 10.3 Drilling equipment - Market size and forecast 2024-2029
- Chart on Drilling equipment - Market size and forecast 2024-2029 ($ million)
- Data Table on Drilling equipment - Market size and forecast 2024-2029 ($ million)
- Chart on Drilling equipment - Year-over-year growth 2024-2029 (%)
- Data Table on Drilling equipment - Year-over-year growth 2024-2029 (%)
- 10.4 Production equipment - Market size and forecast 2024-2029
- Chart on Production equipment - Market size and forecast 2024-2029 ($ million)
- Data Table on Production equipment - Market size and forecast 2024-2029 ($ million)
- Chart on Production equipment - Year-over-year growth 2024-2029 (%)
- Data Table on Production equipment - Year-over-year growth 2024-2029 (%)
- 10.5 Well intervention equipment - Market size and forecast 2024-2029
- Chart on Well intervention equipment - Market size and forecast 2024-2029 ($ million)
- Data Table on Well intervention equipment - Market size and forecast 2024-2029 ($ million)
- Chart on Well intervention equipment - Year-over-year growth 2024-2029 (%)
- Data Table on Well intervention equipment - Year-over-year growth 2024-2029 (%)
- 10.6 Pressure control equipment - Market size and forecast 2024-2029
- Chart on Pressure control equipment - Market size and forecast 2024-2029 ($ million)
- Data Table on Pressure control equipment - Market size and forecast 2024-2029 ($ million)
- Chart on Pressure control equipment - Year-over-year growth 2024-2029 (%)
- Data Table on Pressure control equipment - Year-over-year growth 2024-2029 (%)
- 10.7 Others - Market size and forecast 2024-2029
- Chart on Others - Market size and forecast 2024-2029 ($ million)
- Data Table on Others - Market size and forecast 2024-2029 ($ million)
- Chart on Others - Year-over-year growth 2024-2029 (%)
- Data Table on Others - Year-over-year growth 2024-2029 (%)
- 10.8 Market opportunity by Type
- Market opportunity by Type ($ million)
- Data Table on Market opportunity by Type ($ million)
11 Customer Landscape
- 11.1 Customer landscape overview
- Analysis of price sensitivity, lifecycle, customer purchase basket, adoption rates, and purchase criteria
12 Geographic Landscape
- 12.1 Geographic segmentation
- Chart on Market share By Geographical Landscape 2024-2029 (%)
- Data Table on Market share By Geographical Landscape 2024-2029 (%)
- 12.2 Geographic comparison
- Chart on Geographic comparison
- Data Table on Geographic comparison
- 12.3 North America - Market size and forecast 2024-2029
- Chart on North America - Market size and forecast 2024-2029 ($ million)
- Data Table on North America - Market size and forecast 2024-2029 ($ million)
- Chart on North America - Year-over-year growth 2024-2029 (%)
- Data Table on North America - Year-over-year growth 2024-2029 (%)
- 12.4 Europe - Market size and forecast 2024-2029
- Chart on Europe - Market size and forecast 2024-2029 ($ million)
- Data Table on Europe - Market size and forecast 2024-2029 ($ million)
- Chart on Europe - Year-over-year growth 2024-2029 (%)
- Data Table on Europe - Year-over-year growth 2024-2029 (%)
- 12.5 APAC - Market size and forecast 2024-2029
- Chart on APAC - Market size and forecast 2024-2029 ($ million)
- Data Table on APAC - Market size and forecast 2024-2029 ($ million)
- Chart on APAC - Year-over-year growth 2024-2029 (%)
- Data Table on APAC - Year-over-year growth 2024-2029 (%)
- 12.6 South America - Market size and forecast 2024-2029
- Chart on South America - Market size and forecast 2024-2029 ($ million)
- Data Table on South America - Market size and forecast 2024-2029 ($ million)
- Chart on South America - Year-over-year growth 2024-2029 (%)
- Data Table on South America - Year-over-year growth 2024-2029 (%)
- 12.7 Middle East and Africa - Market size and forecast 2024-2029
- Chart on Middle East and Africa - Market size and forecast 2024-2029 ($ million)
- Data Table on Middle East and Africa - Market size and forecast 2024-2029 ($ million)
- Chart on Middle East and Africa - Year-over-year growth 2024-2029 (%)
- Data Table on Middle East and Africa - Year-over-year growth 2024-2029 (%)
- 12.8 US - Market size and forecast 2024-2029
- Chart on US - Market size and forecast 2024-2029 ($ million)
- Data Table on US - Market size and forecast 2024-2029 ($ million)
- Chart on US - Year-over-year growth 2024-2029 (%)
- Data Table on US - Year-over-year growth 2024-2029 (%)
- 12.9 Germany - Market size and forecast 2024-2029
- Chart on Germany - Market size and forecast 2024-2029 ($ million)
- Data Table on Germany - Market size and forecast 2024-2029 ($ million)
- Chart on Germany - Year-over-year growth 2024-2029 (%)
- Data Table on Germany - Year-over-year growth 2024-2029 (%)
- 12.10 Canada - Market size and forecast 2024-2029
- Chart on Canada - Market size and forecast 2024-2029 ($ million)
- Data Table on Canada - Market size and forecast 2024-2029 ($ million)
- Chart on Canada - Year-over-year growth 2024-2029 (%)
- Data Table on Canada - Year-over-year growth 2024-2029 (%)
- 12.11 China - Market size and forecast 2024-2029
- Chart on China - Market size and forecast 2024-2029 ($ million)
- Data Table on China - Market size and forecast 2024-2029 ($ million)
- Chart on China - Year-over-year growth 2024-2029 (%)
- Data Table on China - Year-over-year growth 2024-2029 (%)
- 12.12 UK - Market size and forecast 2024-2029
- Chart on UK - Market size and forecast 2024-2029 ($ million)
- Data Table on UK - Market size and forecast 2024-2029 ($ million)
- Chart on UK - Year-over-year growth 2024-2029 (%)
- Data Table on UK - Year-over-year growth 2024-2029 (%)
- 12.13 Brazil - Market size and forecast 2024-2029
- Chart on Brazil - Market size and forecast 2024-2029 ($ million)
- Data Table on Brazil - Market size and forecast 2024-2029 ($ million)
- Chart on Brazil - Year-over-year growth 2024-2029 (%)
- Data Table on Brazil - Year-over-year growth 2024-2029 (%)
- 12.14 Japan - Market size and forecast 2024-2029
- Chart on Japan - Market size and forecast 2024-2029 ($ million)
- Data Table on Japan - Market size and forecast 2024-2029 ($ million)
- Chart on Japan - Year-over-year growth 2024-2029 (%)
- Data Table on Japan - Year-over-year growth 2024-2029 (%)
- 12.15 France - Market size and forecast 2024-2029
- Chart on France - Market size and forecast 2024-2029 ($ million)
- Data Table on France - Market size and forecast 2024-2029 ($ million)
- Chart on France - Year-over-year growth 2024-2029 (%)
- Data Table on France - Year-over-year growth 2024-2029 (%)
- 12.16 UAE - Market size and forecast 2024-2029
- Chart on UAE - Market size and forecast 2024-2029 ($ million)
- Data Table on UAE - Market size and forecast 2024-2029 ($ million)
- Chart on UAE - Year-over-year growth 2024-2029 (%)
- Data Table on UAE - Year-over-year growth 2024-2029 (%)
- 12.17 India - Market size and forecast 2024-2029
- Chart on India - Market size and forecast 2024-2029 ($ million)
- Data Table on India - Market size and forecast 2024-2029 ($ million)
- Chart on India - Year-over-year growth 2024-2029 (%)
- Data Table on India - Year-over-year growth 2024-2029 (%)
- 12.18 Market opportunity By Geographical Landscape
- Market opportunity By Geographical Landscape ($ million)
- Data Tables on Market opportunity By Geographical Landscape ($ million)
13 Drivers, Challenges, and Opportunity/Restraints
- 13.1 Market drivers
- 13.2 Market challenges
- 13.3 Impact of drivers and challenges
- Impact of drivers and challenges in 2024 and 2029
- 13.4 Market opportunities/restraints
14 Competitive Landscape
- 14.1 Overview
- 14.2 Competitive Landscape
- Overview on criticality of inputs and factors of differentiation
- 14.3 Landscape disruption
- Overview on factors of disruption
- 14.4 Industry risks
- Impact of key risks on business
15 Competitive Analysis
- 15.1 Companies profiled
- Companies covered
- 15.2 Company ranking index
- Company ranking index
- 15.3 Market positioning of companies
- Matrix on companies position and classification
- 15.4 Aker Solutions ASA
- Aker Solutions ASA - Overview
- Aker Solutions ASA - Business segments
- Aker Solutions ASA - Key news
- Aker Solutions ASA - Key offerings
- Aker Solutions ASA - Segment focus
- SWOT
- 15.5 Archer Ltd.
- Archer Ltd. - Overview
- Archer Ltd. - Business segments
- Archer Ltd. - Key offerings
- Archer Ltd. - Segment focus
- SWOT
- 15.6 Atlas Copco AB
- Atlas Copco AB - Overview
- Atlas Copco AB - Business segments
- Atlas Copco AB - Key news
- Atlas Copco AB - Key offerings
- Atlas Copco AB - Segment focus
- SWOT
- 15.7 AXON Pressure Products Inc.
- AXON Pressure Products Inc. - Overview
- AXON Pressure Products Inc. - Product / Service
- AXON Pressure Products Inc. - Key offerings
- SWOT
- 15.8 Dril Quip Inc.
- Dril Quip Inc. - Overview
- Dril Quip Inc. - Business segments
- Dril Quip Inc. - Key news
- Dril Quip Inc. - Key offerings
- Dril Quip Inc. - Segment focus
- SWOT
- 15.9 Evolution Oil Tools Inc.
- Evolution Oil Tools Inc. - Overview
- Evolution Oil Tools Inc. - Product / Service
- Evolution Oil Tools Inc. - Key offerings
- SWOT
- 15.10 Flowserve Corp.
- Flowserve Corp. - Overview
- Flowserve Corp. - Business segments
- Flowserve Corp. - Key offerings
- Flowserve Corp. - Segment focus
- SWOT
- 15.11 Forum Energy Technologies Inc.
- Forum Energy Technologies Inc. - Overview
- Forum Energy Technologies Inc. - Business segments
- Forum Energy Technologies Inc. - Key news
- Forum Energy Technologies Inc. - Key offerings
- Forum Energy Technologies Inc. - Segment focus
- SWOT
- 15.12 General Electric Co.
- General Electric Co. - Overview
- General Electric Co. - Business segments
- General Electric Co. - Key news
- General Electric Co. - Key offerings
- General Electric Co. - Segment focus
- SWOT
- 15.13 Halliburton Co.
- Halliburton Co. - Overview
- Halliburton Co. - Business segments
- Halliburton Co. - Key news
- Halliburton Co. - Key offerings
- Halliburton Co. - Segment focus
- SWOT
- 15.14 NOV Inc.
- NOV Inc. - Overview
- NOV Inc. - Business segments
- NOV Inc. - Key news
- NOV Inc. - Key offerings
- NOV Inc. - Segment focus
- SWOT
- 15.15 Schlumberger Ltd.
- Schlumberger Ltd. - Overview
- Schlumberger Ltd. - Business segments
- Schlumberger Ltd. - Key news
- Schlumberger Ltd. - Key offerings
- Schlumberger Ltd. - Segment focus
- SWOT
- 15.16 Siemens AG
- Siemens AG - Overview
- Siemens AG - Business segments
- Siemens AG - Key news
- Siemens AG - Key offerings
- Siemens AG - Segment focus
- SWOT
- 15.17 SPX FLOW Inc.
- SPX FLOW Inc. - Overview
- SPX FLOW Inc. - Product / Service
- SPX FLOW Inc. - Key news
- SPX FLOW Inc. - Key offerings
- SWOT
- 15.18 Weatherford International Plc
- Weatherford International Plc - Overview
- Weatherford International Plc - Business segments
- Weatherford International Plc - Key news
- Weatherford International Plc - Key offerings
- Weatherford International Plc - Segment focus
- SWOT
16 Appendix
- 16.1 Scope of the report
- 16.2 Inclusions and exclusions checklist
- Inclusions checklist
- Exclusions checklist
- 16.3 Currency conversion rates for US$
- Currency conversion rates for US$
- 16.4 Research methodology
- Research methodology
- 16.5 Data procurement
- Information sources
- 16.6 Data validation
- Data validation
- 16.7 Validation techniques employed for market sizing
- Validation techniques employed for market sizing
- 16.8 Data synthesis
- Data synthesis
- 16.9 360 degree market analysis
- 360 degree market analysis
- 16.10 List of abbreviations
- List of abbreviations
