|
|
市場調査レポート
商品コード
1660785
HVACレンタル機器の世界市場(2025年~2029年)Global HVAC Rental Equipment Market 2025-2029 |
||||||
|
|||||||
カスタマイズ可能
|
|||||||


| HVACレンタル機器の世界市場(2025年~2029年) |
|
出版日: 2025年02月15日
発行: TechNavio
ページ情報: 英文 221 Pages
納期: 即納可能
|

全表示
- 概要
- 目次
世界のHVACレンタル機器の市場規模は、2024年~2029年に21億2,160万米ドルに達し、予測期間中のCAGRは5.9%で成長すると予測されます。
当レポートでは、HVACレンタル機器市場の全体的な分析、市場規模・予測、動向、成長促進要因、課題、約25のベンダーを網羅したベンダー分析などを掲載しています。
当レポートは、現在の市場シナリオ、最新動向と促進要因、市場環境全体に関する最新分析を提供しています。市場を牽引するのは、各業界におけるクリーンルーム導入の拡大、データセンター数の増加、HVAC機器レンタル市場を牽引する有利な規制の施行などです。
| 市場範囲 | |
|---|---|
| 基準年 | 2025年 |
| 終了年 | 2029年 |
| 予測期間 | 2025年~2029年 |
| 成長モメンタム | 加速 |
| 前年比2025年 | 5.4% |
| CAGR | 5.9% |
| 増分額 | 21億2,160万米ドル |
本調査は、業界の主要参入企業からのインプットを含め、一次情報と二次情報を客観的に組み合わせて実施しました。本レポートには、主要企業の分析に加え、包括的な市場規模データ、地域分析によるセグメント、ベンダー情勢が含まれています。レポートには実績データと予測データがあります。
本調査では、エネルギー効率の高いHVACソリューションの使用が、今後数年間のHVACレンタル機器市場の成長を促進する主要な理由の1つであると特定しています。また、インダストリー4.0の採用が進み、HVACレンタル機器を使用するエンドユーザー産業からの需要が高まっていることも、市場の大きな需要につながる見込みです。
目次
第1章 エグゼクティブサマリー
- 市場概要
第2章 Technavioの分析
- 価格感度・ライフサイクル・顧客購入バスケット・採用率・購入基準の分析
- インプットの重要性と差別化の要因
- ディスラプションの要因
- 促進要因と課題の影響
第3章 市場情勢
- 市場エコシステム
- 市場の特徴
- バリューチェーン分析
第4章 市場規模
- 市場の定義
- 市場セグメント分析
- 市場規模(2024年)
- 市場の見通し(2024年~2029年)
第5章 市場規模実績
- HVACレンタル機器の世界市場(2019年~2023年)
- エンドユーザーセグメント分析(2019年~2023年)
- タイプセグメント分析(2019年~2023年)
- レンタルカテゴリーセグメント分析(2019年~2023年)
- 地域セグメント分析(2019年~2023年)
- 国セグメント分析(2019年~2023年)
第6章 定性分析
- AIの影響:HVACレンタル機器の世界市場
第7章 ファイブフォース分析
- ファイブフォースの要約
- 買い手の交渉力
- 供給企業の交渉力
- 新規参入業者の脅威
- 代替品の脅威
- 競争の脅威
- 市況
第8章 市場セグメンテーション:エンドユーザー別
- 市場セグメント
- 比較:エンドユーザー別
- 産業:市場規模と予測(2024年~2029年)
- 商業:市場規模と予測(2024年~2029年)
- 住宅:市場規模と予測(2024年~2029年)
- 市場機会:エンドユーザー別
第9章 市場セグメンテーション:タイプ別
- 市場セグメント
- 比較:タイプ別
- 空調:市場規模と予測(2024年~2029年)
- 加熱:市場規模と予測(2024年~2029年)
- 換気:市場規模と予測(2024年~2029年)
- 市場機会:タイプ別
第10章 市場セグメンテーション:レンタルカテゴリー別
- 市場セグメント
- 比較:レンタルカテゴリー別
- 短期:市場規模と予測(2024年~2029年)
- 長期:市場規模と予測(2024年~2029年)
- 市場機会:レンタルカテゴリー別
第11章 顧客情勢
- 顧客情勢の概要
第12章 地域別情勢
- 地域別セグメンテーション
- 地域別比較
- アジア太平洋:市場規模と予測(2024年~2029年)
- 北米:市場規模と予測(2024年~2029年)
- 欧州:市場規模と予測(2024年~2029年)
- 中東・アフリカ:市場規模と予測(2024年~2029年)
- 南米:市場規模と予測(2024年~2029年)
- 中国:市場規模と予測(2024年~2029年)
- 米国:市場規模と予測(2024年~2029年)
- インド:市場規模と予測(2024年~2029年)
- 日本:市場規模と予測(2024年~2029年)
- ドイツ:市場規模と予測(2024年~2029年)
- イタリア:市場規模と予測(2024年~2029年)
- カナダ:市場規模と予測(2024年~2029年)
- 英国:市場規模と予測(2024年~2029年)
- ブラジル:市場規模と予測(2024年~2029年)
- フランス:市場規模と予測(2024年~2029年)
- 市場機会:地域情勢別
第13章 促進要因・課題・機会・抑制要因
- 市場促進要因
- 市場の課題
- 促進要因と課題の影響
- 市場の機会・抑制要因
第14章 競合情勢
- 概要
- 競合情勢
- ディスラプションの状況
- 業界のリスク
第15章 競合分析
- 企業プロファイル
- 企業ランキング指数
- 企業の市場ポジショニング
- Aggreko Plc
- Andrews Sykes Group Plc
- Ashtead Group Plc
- Big Ten Rentals
- Brookfield Business Partners LP
- Carrier Global Corp.
- Caterpillar Inc.
- City Air Toronto Air Conditioning and Heating
- Entech Sales and Service LLC
- Gal Power Systems
- Herc Holdings Inc.
- Ingersoll Rand Inc.
- Johnson Controls International Plc
- Trane Technologies Plc
- United Rentals Inc.
第16章 付録
The HVAC rental equipment market is forecasted to grow by USD 2121.6 million during 2024-2029, accelerating at a CAGR of 5.9% during the forecast period. The report on the HVAC rental equipment market provides a holistic analysis, market size and forecast, trends, growth drivers, and challenges, as well as vendor analysis covering around 25 vendors.
The report offers an up-to-date analysis regarding the current market scenario, the latest trends and drivers, and the overall market environment. The market is driven by growing adoption of cleanrooms across industries, rising number of data centers, and enforcement of favorable regulations driving HVAC equipment rental market.
| Market Scope | |
|---|---|
| Base Year | 2025 |
| End Year | 2029 |
| Series Year | 2025-2029 |
| Growth Momentum | Accelerate |
| YOY 2025 | 5.4% |
| CAGR | 5.9% |
| Incremental Value | $2121.6 mn |
The study was conducted using an objective combination of primary and secondary information including inputs from key participants in the industry. The report contains a comprehensive market size data, segment with regional analysis and vendor landscape in addition to an analysis of the key companies. Reports have historic and forecast data.
Technavio's HVAC rental equipment market is segmented as below:
By End-user
- Industrial
- Commercial
- Residential
By Type
- Air conditioning
- Heating
- Ventilation
By Rental Category
- Short term
- Long term
By Geographical Landscape
- APAC
- North America
- Europe
- Middle East and Africa
- South America
This study identifies the use of energy-efficient HVAC solutions as one of the prime reasons driving the HVAC rental equipment market growth during the next few years. Also, growing adoption of industry 4.0 and rising demand from end-user industries that use HVAC rental equipment will lead to sizable demand in the market.
The report on the HVAC rental equipment market covers the following areas:
- HVAC Rental Equipment Market sizing
- HVAC Rental Equipment Market forecast
- HVAC Rental Equipment Market industry analysis
The robust vendor analysis is designed to help clients improve their market position, and in line with this, this report provides a detailed analysis of several leading HVAC rental equipment market vendors that include Aggreko PLC, Air on Location Inc., AIR SOLUTIONS, Andrews Sykes Group PLC, Ashtead Group PLC, Big Ten Rentals, Brookfield Business Partners LP, Carrier Global Corp., Caterpillar Inc., City Air Toronto Air Conditioning and Heating, Entech Sales and Service LLC, Gal Power Systems, Herc Holdings Inc., HVAC Rentals, Ingersoll Rand Inc., Johnson Controls International PLC, Reliance Comfort Ltd., TK Rentals SDN Bhd, Trane Technologies PLC, and United Rentals Inc.. Also, the HVAC rental equipment market analysis report includes information on upcoming trends and challenges that will influence market growth. This is to help companies strategize and leverage all forthcoming growth opportunities.
The publisher presents a detailed picture of the market by the way of study, synthesis, and summation of data from multiple sources by an analysis of key parameters such as profit, pricing, competition, and promotions. It presents various market facets by identifying the key industry influencers. The data presented is comprehensive, reliable, and a result of extensive primary and secondary research. The market research reports provide a complete competitive landscape and an in-depth vendor selection methodology and analysis using qualitative and quantitative research to forecast accurate market growth.
Table of Contents
1 Executive Summary
- 1.1 Market overview
- Executive Summary - Chart on Market Overview
- Executive Summary - Data Table on Market Overview
- Executive Summary - Chart on Global Market Characteristics
- Executive Summary - Chart on Market By Geographical Landscape
- Executive Summary - Chart on Market Segmentation by End-user
- Executive Summary - Chart on Market Segmentation by Type
- Executive Summary - Chart on Market Segmentation by Rental Category
- Executive Summary - Chart on Incremental Growth
- Executive Summary - Data Table on Incremental Growth
- Executive Summary - Chart on Company Market Positioning
2 Technavio Analysis
- 2.1 Analysis of price sensitivity, lifecycle, customer purchase basket, adoption rates, and purchase criteria
- Analysis of price sensitivity, lifecycle, customer purchase basket, adoption rates, and purchase criteria
- 2.2 Criticality of inputs and Factors of differentiation
- Overview on criticality of inputs and factors of differentiation
- 2.3 Factors of disruption
- Overview on factors of disruption
- 2.4 Impact of drivers and challenges
- Impact of drivers and challenges in 2024 and 2029
3 Market Landscape
- 3.1 Market ecosystem
- Parent Market
- Data Table on - Parent Market
- 3.2 Market characteristics
- Market characteristics analysis
- 3.3 Value chain analysis
- Value chain analysis
4 Market Sizing
- 4.1 Market definition
- Offerings of companies included in the market definition
- 4.2 Market segment analysis
- Market segments
- 4.3 Market size 2024
- 4.4 Market outlook: Forecast for 2024-2029
- Chart on Global - Market size and forecast 2024-2029 ($ million)
- Data Table on Global - Market size and forecast 2024-2029 ($ million)
- Chart on Global Market: Year-over-year growth 2024-2029 (%)
- Data Table on Global Market: Year-over-year growth 2024-2029 (%)
5 Historic Market Size
- 5.1 Global HVAC Rental Equipment Market 2019 - 2023
- Historic Market Size - Data Table on Global HVAC Rental Equipment Market 2019 - 2023 ($ million)
- 5.2 End-user segment analysis 2019 - 2023
- Historic Market Size - End-user Segment 2019 - 2023 ($ million)
- 5.3 Type segment analysis 2019 - 2023
- Historic Market Size - Type Segment 2019 - 2023 ($ million)
- 5.4 Rental Category segment analysis 2019 - 2023
- Historic Market Size - Rental Category Segment 2019 - 2023 ($ million)
- 5.5 Geography segment analysis 2019 - 2023
- Historic Market Size - Geography Segment 2019 - 2023 ($ million)
- 5.6 Country segment analysis 2019 - 2023
- Historic Market Size - Country Segment 2019 - 2023 ($ million)
6 Qualitative Analysis
- 6.1 AI Impact on Global HVAC Rental Equipment Market
7 Five Forces Analysis
- 7.1 Five forces summary
- Five forces analysis - Comparison between 2024 and 2029
- 7.2 Bargaining power of buyers
- Bargaining power of buyers - Impact of key factors 2024 and 2029
- 7.3 Bargaining power of suppliers
- Bargaining power of suppliers - Impact of key factors in 2024 and 2029
- 7.4 Threat of new entrants
- Threat of new entrants - Impact of key factors in 2024 and 2029
- 7.5 Threat of substitutes
- Threat of substitutes - Impact of key factors in 2024 and 2029
- 7.6 Threat of rivalry
- Threat of rivalry - Impact of key factors in 2024 and 2029
- 7.7 Market condition
- Chart on Market condition - Five forces 2024 and 2029
8 Market Segmentation by End-user
- 8.1 Market segments
- Chart on End-user - Market share 2024-2029 (%)
- Data Table on End-user - Market share 2024-2029 (%)
- 8.2 Comparison by End-user
- Chart on Comparison by End-user
- Data Table on Comparison by End-user
- 8.3 Industrial - Market size and forecast 2024-2029
- Chart on Industrial - Market size and forecast 2024-2029 ($ million)
- Data Table on Industrial - Market size and forecast 2024-2029 ($ million)
- Chart on Industrial - Year-over-year growth 2024-2029 (%)
- Data Table on Industrial - Year-over-year growth 2024-2029 (%)
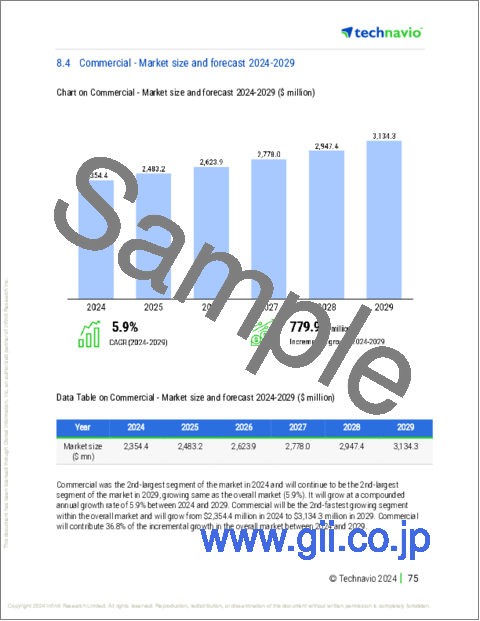
- 8.4 Commercial - Market size and forecast 2024-2029
- Chart on Commercial - Market size and forecast 2024-2029 ($ million)
- Data Table on Commercial - Market size and forecast 2024-2029 ($ million)
- Chart on Commercial - Year-over-year growth 2024-2029 (%)
- Data Table on Commercial - Year-over-year growth 2024-2029 (%)
- 8.5 Residential - Market size and forecast 2024-2029
- Chart on Residential - Market size and forecast 2024-2029 ($ million)
- Data Table on Residential - Market size and forecast 2024-2029 ($ million)
- Chart on Residential - Year-over-year growth 2024-2029 (%)
- Data Table on Residential - Year-over-year growth 2024-2029 (%)
- 8.6 Market opportunity by End-user
- Market opportunity by End-user ($ million)
- Data Table on Market opportunity by End-user ($ million)
9 Market Segmentation by Type
- 9.1 Market segments
- Chart on Type - Market share 2024-2029 (%)
- Data Table on Type - Market share 2024-2029 (%)
- 9.2 Comparison by Type
- Chart on Comparison by Type
- Data Table on Comparison by Type
- 9.3 Air conditioning - Market size and forecast 2024-2029
- Chart on Air conditioning - Market size and forecast 2024-2029 ($ million)
- Data Table on Air conditioning - Market size and forecast 2024-2029 ($ million)
- Chart on Air conditioning - Year-over-year growth 2024-2029 (%)
- Data Table on Air conditioning - Year-over-year growth 2024-2029 (%)
- 9.4 Heating - Market size and forecast 2024-2029
- Chart on Heating - Market size and forecast 2024-2029 ($ million)
- Data Table on Heating - Market size and forecast 2024-2029 ($ million)
- Chart on Heating - Year-over-year growth 2024-2029 (%)
- Data Table on Heating - Year-over-year growth 2024-2029 (%)
- 9.5 Ventilation - Market size and forecast 2024-2029
- Chart on Ventilation - Market size and forecast 2024-2029 ($ million)
- Data Table on Ventilation - Market size and forecast 2024-2029 ($ million)
- Chart on Ventilation - Year-over-year growth 2024-2029 (%)
- Data Table on Ventilation - Year-over-year growth 2024-2029 (%)
- 9.6 Market opportunity by Type
- Market opportunity by Type ($ million)
- Data Table on Market opportunity by Type ($ million)
10 Market Segmentation by Rental Category
- 10.1 Market segments
- Chart on Rental Category - Market share 2024-2029 (%)
- Data Table on Rental Category - Market share 2024-2029 (%)
- 10.2 Comparison by Rental Category
- Chart on Comparison by Rental Category
- Data Table on Comparison by Rental Category
- 10.3 Short term - Market size and forecast 2024-2029
- Chart on Short term - Market size and forecast 2024-2029 ($ million)
- Data Table on Short term - Market size and forecast 2024-2029 ($ million)
- Chart on Short term - Year-over-year growth 2024-2029 (%)
- Data Table on Short term - Year-over-year growth 2024-2029 (%)
- 10.4 Long term - Market size and forecast 2024-2029
- Chart on Long term - Market size and forecast 2024-2029 ($ million)
- Data Table on Long term - Market size and forecast 2024-2029 ($ million)
- Chart on Long term - Year-over-year growth 2024-2029 (%)
- Data Table on Long term - Year-over-year growth 2024-2029 (%)
- 10.5 Market opportunity by Rental Category
- Market opportunity by Rental Category ($ million)
- Data Table on Market opportunity by Rental Category ($ million)
11 Customer Landscape
- 11.1 Customer landscape overview
- Analysis of price sensitivity, lifecycle, customer purchase basket, adoption rates, and purchase criteria
12 Geographic Landscape
- 12.1 Geographic segmentation
- Chart on Market share By Geographical Landscape 2024-2029 (%)
- Data Table on Market share By Geographical Landscape 2024-2029 (%)
- 12.2 Geographic comparison
- Chart on Geographic comparison
- Data Table on Geographic comparison
- 12.3 APAC - Market size and forecast 2024-2029
- Chart on APAC - Market size and forecast 2024-2029 ($ million)
- Data Table on APAC - Market size and forecast 2024-2029 ($ million)
- Chart on APAC - Year-over-year growth 2024-2029 (%)
- Data Table on APAC - Year-over-year growth 2024-2029 (%)
- 12.4 North America - Market size and forecast 2024-2029
- Chart on North America - Market size and forecast 2024-2029 ($ million)
- Data Table on North America - Market size and forecast 2024-2029 ($ million)
- Chart on North America - Year-over-year growth 2024-2029 (%)
- Data Table on North America - Year-over-year growth 2024-2029 (%)
- 12.5 Europe - Market size and forecast 2024-2029
- Chart on Europe - Market size and forecast 2024-2029 ($ million)
- Data Table on Europe - Market size and forecast 2024-2029 ($ million)
- Chart on Europe - Year-over-year growth 2024-2029 (%)
- Data Table on Europe - Year-over-year growth 2024-2029 (%)
- 12.6 Middle East and Africa - Market size and forecast 2024-2029
- Chart on Middle East and Africa - Market size and forecast 2024-2029 ($ million)
- Data Table on Middle East and Africa - Market size and forecast 2024-2029 ($ million)
- Chart on Middle East and Africa - Year-over-year growth 2024-2029 (%)
- Data Table on Middle East and Africa - Year-over-year growth 2024-2029 (%)
- 12.7 South America - Market size and forecast 2024-2029
- Chart on South America - Market size and forecast 2024-2029 ($ million)
- Data Table on South America - Market size and forecast 2024-2029 ($ million)
- Chart on South America - Year-over-year growth 2024-2029 (%)
- Data Table on South America - Year-over-year growth 2024-2029 (%)
- 12.8 China - Market size and forecast 2024-2029
- Chart on China - Market size and forecast 2024-2029 ($ million)
- Data Table on China - Market size and forecast 2024-2029 ($ million)
- Chart on China - Year-over-year growth 2024-2029 (%)
- Data Table on China - Year-over-year growth 2024-2029 (%)
- 12.9 US - Market size and forecast 2024-2029
- Chart on US - Market size and forecast 2024-2029 ($ million)
- Data Table on US - Market size and forecast 2024-2029 ($ million)
- Chart on US - Year-over-year growth 2024-2029 (%)
- Data Table on US - Year-over-year growth 2024-2029 (%)
- 12.10 India - Market size and forecast 2024-2029
- Chart on India - Market size and forecast 2024-2029 ($ million)
- Data Table on India - Market size and forecast 2024-2029 ($ million)
- Chart on India - Year-over-year growth 2024-2029 (%)
- Data Table on India - Year-over-year growth 2024-2029 (%)
- 12.11 Japan - Market size and forecast 2024-2029
- Chart on Japan - Market size and forecast 2024-2029 ($ million)
- Data Table on Japan - Market size and forecast 2024-2029 ($ million)
- Chart on Japan - Year-over-year growth 2024-2029 (%)
- Data Table on Japan - Year-over-year growth 2024-2029 (%)
- 12.12 Germany - Market size and forecast 2024-2029
- Chart on Germany - Market size and forecast 2024-2029 ($ million)
- Data Table on Germany - Market size and forecast 2024-2029 ($ million)
- Chart on Germany - Year-over-year growth 2024-2029 (%)
- Data Table on Germany - Year-over-year growth 2024-2029 (%)
- 12.13 Italy - Market size and forecast 2024-2029
- Chart on Italy - Market size and forecast 2024-2029 ($ million)
- Data Table on Italy - Market size and forecast 2024-2029 ($ million)
- Chart on Italy - Year-over-year growth 2024-2029 (%)
- Data Table on Italy - Year-over-year growth 2024-2029 (%)
- 12.14 Canada - Market size and forecast 2024-2029
- Chart on Canada - Market size and forecast 2024-2029 ($ million)
- Data Table on Canada - Market size and forecast 2024-2029 ($ million)
- Chart on Canada - Year-over-year growth 2024-2029 (%)
- Data Table on Canada - Year-over-year growth 2024-2029 (%)
- 12.15 UK - Market size and forecast 2024-2029
- Chart on UK - Market size and forecast 2024-2029 ($ million)
- Data Table on UK - Market size and forecast 2024-2029 ($ million)
- Chart on UK - Year-over-year growth 2024-2029 (%)
- Data Table on UK - Year-over-year growth 2024-2029 (%)
- 12.16 Brazil - Market size and forecast 2024-2029
- Chart on Brazil - Market size and forecast 2024-2029 ($ million)
- Data Table on Brazil - Market size and forecast 2024-2029 ($ million)
- Chart on Brazil - Year-over-year growth 2024-2029 (%)
- Data Table on Brazil - Year-over-year growth 2024-2029 (%)
- 12.17 France - Market size and forecast 2024-2029
- Chart on France - Market size and forecast 2024-2029 ($ million)
- Data Table on France - Market size and forecast 2024-2029 ($ million)
- Chart on France - Year-over-year growth 2024-2029 (%)
- Data Table on France - Year-over-year growth 2024-2029 (%)
- 12.18 Market opportunity By Geographical Landscape
- Market opportunity By Geographical Landscape ($ million)
- Data Tables on Market opportunity By Geographical Landscape ($ million)
13 Drivers, Challenges, and Opportunity/Restraints
- 13.1 Market drivers
- 13.2 Market challenges
- 13.3 Impact of drivers and challenges
- Impact of drivers and challenges in 2024 and 2029
- 13.4 Market opportunities/restraints
14 Competitive Landscape
- 14.1 Overview
- 14.2 Competitive Landscape
- Overview on criticality of inputs and factors of differentiation
- 14.3 Landscape disruption
- Overview on factors of disruption
- 14.4 Industry risks
- Impact of key risks on business
15 Competitive Analysis
- 15.1 Companies profiled
- Companies covered
- 15.2 Company ranking index
- Company ranking index
- 15.3 Market positioning of companies
- Matrix on companies position and classification
- 15.4 Aggreko Plc
- Aggreko Plc - Overview
- Aggreko Plc - Product / Service
- Aggreko Plc - Key offerings
- SWOT
- 15.5 Andrews Sykes Group Plc
- Andrews Sykes Group Plc - Overview
- Andrews Sykes Group Plc - Product / Service
- Andrews Sykes Group Plc - Key offerings
- SWOT
- 15.6 Ashtead Group Plc
- Ashtead Group Plc - Overview
- Ashtead Group Plc - Business segments
- Ashtead Group Plc - Key offerings
- Ashtead Group Plc - Segment focus
- SWOT
- 15.7 Big Ten Rentals
- Big Ten Rentals - Overview
- Big Ten Rentals - Product / Service
- Big Ten Rentals - Key offerings
- SWOT
- 15.8 Brookfield Business Partners LP
- Brookfield Business Partners LP - Overview
- Brookfield Business Partners LP - Business segments
- Brookfield Business Partners LP - Key offerings
- Brookfield Business Partners LP - Segment focus
- SWOT
- 15.9 Carrier Global Corp.
- Carrier Global Corp. - Overview
- Carrier Global Corp. - Business segments
- Carrier Global Corp. - Key news
- Carrier Global Corp. - Key offerings
- Carrier Global Corp. - Segment focus
- SWOT
- 15.10 Caterpillar Inc.
- Caterpillar Inc. - Overview
- Caterpillar Inc. - Business segments
- Caterpillar Inc. - Key news
- Caterpillar Inc. - Key offerings
- Caterpillar Inc. - Segment focus
- SWOT
- 15.11 City Air Toronto Air Conditioning and Heating
- City Air Toronto Air Conditioning and Heating - Overview
- City Air Toronto Air Conditioning and Heating - Product / Service
- City Air Toronto Air Conditioning and Heating - Key offerings
- SWOT
- 15.12 Entech Sales and Service LLC
- Entech Sales and Service LLC - Overview
- Entech Sales and Service LLC - Product / Service
- Entech Sales and Service LLC - Key offerings
- SWOT
- 15.13 Gal Power Systems
- Gal Power Systems - Overview
- Gal Power Systems - Product / Service
- Gal Power Systems - Key offerings
- SWOT
- 15.14 Herc Holdings Inc.
- Herc Holdings Inc. - Overview
- Herc Holdings Inc. - Product / Service
- Herc Holdings Inc. - Key offerings
- SWOT
- 15.15 Ingersoll Rand Inc.
- Ingersoll Rand Inc. - Overview
- Ingersoll Rand Inc. - Business segments
- Ingersoll Rand Inc. - Key news
- Ingersoll Rand Inc. - Key offerings
- Ingersoll Rand Inc. - Segment focus
- SWOT
- 15.16 Johnson Controls International Plc
- Johnson Controls International Plc - Overview
- Johnson Controls International Plc - Business segments
- Johnson Controls International Plc - Key news
- Johnson Controls International Plc - Key offerings
- Johnson Controls International Plc - Segment focus
- SWOT
- 15.17 Trane Technologies Plc
- Trane Technologies Plc - Overview
- Trane Technologies Plc - Business segments
- Trane Technologies Plc - Key news
- Trane Technologies Plc - Key offerings
- Trane Technologies Plc - Segment focus
- SWOT
- 15.18 United Rentals Inc.
- United Rentals Inc. - Overview
- United Rentals Inc. - Business segments
- United Rentals Inc. - Key news
- United Rentals Inc. - Key offerings
- United Rentals Inc. - Segment focus
- SWOT
16 Appendix
- 16.1 Scope of the report
- 16.2 Inclusions and exclusions checklist
- Inclusions checklist
- Exclusions checklist
- 16.3 Currency conversion rates for US$
- Currency conversion rates for US$
- 16.4 Research methodology
- Research methodology
- 16.5 Data procurement
- Information sources
- 16.6 Data validation
- Data validation
- 16.7 Validation techniques employed for market sizing
- Validation techniques employed for market sizing
- 16.8 Data synthesis
- Data synthesis
- 16.9 360 degree market analysis
- 360 degree market analysis
- 16.10 List of abbreviations
- List of abbreviations

