|
|
市場調査レポート
商品コード
1652810
エルダーベリーの世界市場(2025年~2029年)Global Elderberry Market 2025-2029 |
||||||

|
|||||||
カスタマイズ可能
|
|||||||

| エルダーベリーの世界市場(2025年~2029年) |
|
出版日: 2025年01月23日
発行: TechNavio
ページ情報: 英文 200 Pages
納期: 即納可能
|

全表示
- 概要
- 目次
世界のエルダーベリーの市場規模は、2024年~2029年に3億4,950万米ドルに達し、予測期間中のCAGRは7.6%で成長すると予測されています。
この調査レポートは、エルダーベリー市場の全体分析、市場規模・予測、動向、成長促進要因、課題、約25のベンダーを網羅したベンダー分析などを掲載しています。
当レポートは、現在の市場シナリオ、最新動向と促進要因、市場環境全体に関する最新分析を提供しています。エルダーベリーの健康効果、オンライン小売とeコマースの浸透、都市型農業の人気上昇などが市場を牽引しています。
| 市場範囲 | |
|---|---|
| 基準年 | 2025年 |
| 終了年 | 2029年 |
| 予測期間 | 2025年~2029年 |
| 成長モメンタム | 加速 |
| 前年比2025年 | 6.9% |
| CAGR | 7.6% |
| 増分額 | 3億4,950万米ドル |
本調査では、今後数年間のエルダーベリー市場の成長を牽引する主な要因の1つとして、スーパーフルーツと機能性成分の需要増加を挙げています。また、健康サプリメントへの需要の高まりやビーガン食の人気の高まりは、市場の大きな需要につながります。
目次
第1章 エグゼクティブサマリー
- 市場概要
第2章 Technavioの分析
- 価格感度・ライフサイクル・顧客購入バスケット・採用率・購入基準の分析
- インプットの重要性と差別化の要因
- ディスラプションの要因
- 促進要因と課題の影響
第3章 市場情勢
- 市場エコシステム
- 市場の特徴
- バリューチェーン分析
第4章 市場規模
- 市場の定義
- 市場セグメント分析
- 市場規模(2024年)
- 市場の見通し(2024年~2029年)
第5章 市場規模実績
- エルダーベリーの世界市場(2019年~2023年)
- 用途セグメント分析(2019年~2023年)
- 流通チャネルセグメント分析(2019年~2023年)
- 地域セグメント分析(2019年~2023年)
- 国セグメント分析(2019年~2023年)
第6章 定性分析
- AIの影響:エルダーベリーの世界市場
第7章 ファイブフォース分析
- ファイブフォースの要約
- 買い手の交渉力
- 供給企業の交渉力
- 新規参入業者の脅威
- 代替品の脅威
- 競争の脅威
- 市況
第8章 市場セグメンテーション:用途別
- 市場セグメント
- 比較:用途別
- 健康とウェルネス:市場規模と予測(2024年~2029年)
- 飲料:市場規模と予測(2024年~2029年)
- 食品:市場規模と予測(2024年~2029年)
- その他:市場規模と予測(2024年~2029年)
- 市場機会:用途別
第9章 市場セグメンテーション:流通チャネル別
- 市場セグメント
- 比較:流通チャネル別
- オフライン:市場規模と予測(2024年~2029年)
- オンライン:市場規模と予測(2024年~2029年)
- 市場機会:流通チャネル別
第10章 顧客情勢
- 顧客情勢の概要
第11章 地域別情勢
- 地域別セグメンテーション
- 地域別比較
- 欧州:市場規模と予測(2024年~2029年)
- 北米:市場規模と予測(2024年~2029年)
- アジア太平洋:市場規模と予測(2024年~2029年)
- 南米:市場規模と予測(2024年~2029年)
- 中東・アフリカ:市場規模と予測(2024年~2029年)
- 米国:市場規模と予測(2024年~2029年)
- ドイツ:市場規模と予測(2024年~2029年)
- オーストリア:市場規模と予測(2024年~2029年)
- イタリア:市場規模と予測(2024年~2029年)
- デンマーク:市場規模と予測(2024年~2029年)
- 中国:市場規模と予測(2024年~2029年)
- アラブ首長国連邦:市場規模と予測(2024年~2029年)
- ブラジル:市場規模と予測(2024年~2029年)
- インド:市場規模と予測(2024年~2029年)
- 日本:市場規模と予測(2024年~2029年)
- 市場機会:地域情勢別
第12章 促進要因・課題・機会・抑制要因
- 市場促進要因
- 市場の課題
- 促進要因と課題の影響
- 市場の機会・抑制要因
第13章 競合情勢
- 概要
- 競合情勢
- ディスラプションの状況
- 業界のリスク
第14章 競合分析
- 企業プロファイル
- 企業ランキング指数
- 企業の市場ポジショニング
- Artemis International
- Bluebonnet Nutrition Corp.
- Dr. Willmar Schwabe GmbH and Co. KG
- Flora Inc.
- Gaia Herbs Inc.
- Honest Elderberry Co.
- Innovative Natural Solutions
- Lifeway Foods Inc.
- New Chapter Inc.
- Norms Farms
- NOW Health Group Inc.
- Paradise Herbs And Essentials Inc.
- Pharmacare US Inc.
- Pukka Herbs Ltd.
- Ransom Naturals Ltd.
第15章 付録
The elderberry market is forecasted to grow by $ 349.5 mn during 2024-2029, accelerating at a CAGR of 7.6% during the forecast period. The report on the elderberry market provides a holistic analysis, market size and forecast, trends, growth drivers, and challenges, as well as vendor analysis covering around 25 vendors.
The report offers an up-to-date analysis regarding the current market scenario, the latest trends and drivers, and the overall market environment. The market is driven by health benefits of elderberry, rising penetration of online retailing and e-commerce, and rising popularity of urban farming.
| Market Scope | |
|---|---|
| Base Year | 2025 |
| End Year | 2029 |
| Series Year | 2025-2029 |
| Growth Momentum | Accelerate |
| YOY 2025 | 6.9% |
| CAGR | 7.6% |
| Incremental Value | $349.5 mn |
Technavio's elderberry market is segmented as below:
By Application
- Health and wellness
- Beverages
- Foods
- Others
By Distribution Channel
- Offline
- Online
By Geographical Landscape
- Europe
- North America
- APAC
- South America
- Middle East and Africa
This study identifies the increasing demand for superfruits and functional ingredients as one of the prime reasons driving the elderberry market growth during the next few years. Also, growing demand for health supplements and increasing popularity of vegan diets will lead to sizable demand in the market.
The report on the elderberry market covers the following areas:
- Elderberry Market sizing
- Elderberry Market forecast
- Elderberry Market industry analysis
The robust vendor analysis is designed to help clients improve their market position, and in line with this, this report provides a detailed analysis of several leading elderberry market vendors that include Artemis International, Bluebonnet Nutrition Corp., Dr. Willmar Schwabe GmbH and Co. KG, Flora Inc., Gaia Herbs Inc., Honest Elderberry Co., Innovative Natural Solutions, Jarrow Formulas Inc., Lifeway Foods Inc., New Chapter Inc., Norms Farms, NOW Health Group Inc., Paradise Herbs And Essentials Inc., Persimmon Hill Farm, Pharmacare US Inc., Pukka Herbs Ltd., Ransom Naturals Ltd., River Hills Harvest, Supplement Manufacturing Partner, and The Elderberry Co.. Also, the elderberry market analysis report includes information on upcoming trends and challenges that will influence market growth. This is to help companies strategize and leverage all forthcoming growth opportunities.
The study was conducted using an objective combination of primary and secondary information including inputs from key participants in the industry. The report contains a comprehensive market and vendor landscape in addition to an analysis of the key vendors.
The publisher presents a detailed picture of the market by the way of study, synthesis, and summation of data from multiple sources by an analysis of key parameters such as profit, pricing, competition, and promotions. It presents various market facets by identifying the key industry influencers. The data presented is comprehensive, reliable, and a result of extensive primary and secondary research. The market research reports provide a complete competitive landscape and an in-depth vendor selection methodology and analysis using qualitative and quantitative research to forecast accurate market growth.
Table of Contents
1 Executive Summary
- 1.1 Market overview
- Executive Summary - Chart on Market Overview
- Executive Summary - Data Table on Market Overview
- Executive Summary - Chart on Global Market Characteristics
- Executive Summary - Chart on Market By Geographical Landscape
- Executive Summary - Chart on Market Segmentation by Application
- Executive Summary - Chart on Market Segmentation by Distribution Channel
- Executive Summary - Chart on Incremental Growth
- Executive Summary - Data Table on Incremental Growth
- Executive Summary - Chart on Company Market Positioning
2 Technavio Analysis
- 2.1 Analysis of price sensitivity, lifecycle, customer purchase basket, adoption rates, and purchase criteria
- Analysis of price sensitivity, lifecycle, customer purchase basket, adoption rates, and purchase criteria
- 2.2 Criticality of inputs and Factors of differentiation
- Overview on criticality of inputs and factors of differentiation
- 2.3 Factors of disruption
- Overview on factors of disruption
- 2.4 Impact of drivers and challenges
- Impact of drivers and challenges in 2024 and 2029
3 Market Landscape
- 3.1 Market ecosystem
- Parent Market
- Data Table on - Parent Market
- 3.2 Market characteristics
- Market characteristics analysis
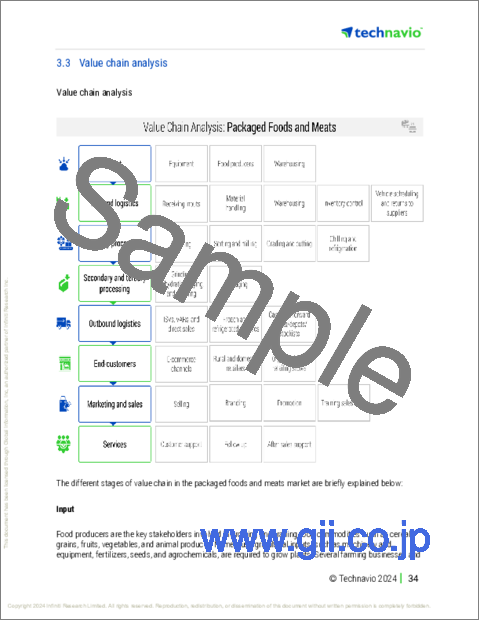
- 3.3 Value chain analysis
- Value chain analysis
4 Market Sizing
- 4.1 Market definition
- Offerings of companies included in the market definition
- 4.2 Market segment analysis
- Market segments
- 4.3 Market size 2024
- 4.4 Market outlook: Forecast for 2024-2029
- Chart on Global - Market size and forecast 2024-2029 ($ million)
- Data Table on Global - Market size and forecast 2024-2029 ($ million)
- Chart on Global Market: Year-over-year growth 2024-2029 (%)
- Data Table on Global Market: Year-over-year growth 2024-2029 (%)
5 Historic Market Size
- 5.1 Global Elderberry Market 2019 - 2023
- Historic Market Size - Data Table on Global Elderberry Market 2019 - 2023 ($ million)
- 5.2 Application segment analysis 2019 - 2023
- Historic Market Size - Application Segment 2019 - 2023 ($ million)
- 5.3 Distribution Channel segment analysis 2019 - 2023
- Historic Market Size - Distribution Channel Segment 2019 - 2023 ($ million)
- 5.4 Geography segment analysis 2019 - 2023
- Historic Market Size - Geography Segment 2019 - 2023 ($ million)
- 5.5 Country segment analysis 2019 - 2023
- Historic Market Size - Country Segment 2019 - 2023 ($ million)
6 Qualitative Analysis
- 6.1 The AI impact on Global Elderberry Market
7 Five Forces Analysis
- 7.1 Five forces summary
- Five forces analysis - Comparison between 2024 and 2029
- 7.2 Bargaining power of buyers
- Bargaining power of buyers - Impact of key factors 2024 and 2029
- 7.3 Bargaining power of suppliers
- Bargaining power of suppliers - Impact of key factors in 2024 and 2029
- 7.4 Threat of new entrants
- Threat of new entrants - Impact of key factors in 2024 and 2029
- 7.5 Threat of substitutes
- Threat of substitutes - Impact of key factors in 2024 and 2029
- 7.6 Threat of rivalry
- Threat of rivalry - Impact of key factors in 2024 and 2029
- 7.7 Market condition
- Chart on Market condition - Five forces 2024 and 2029
8 Market Segmentation by Application
- 8.1 Market segments
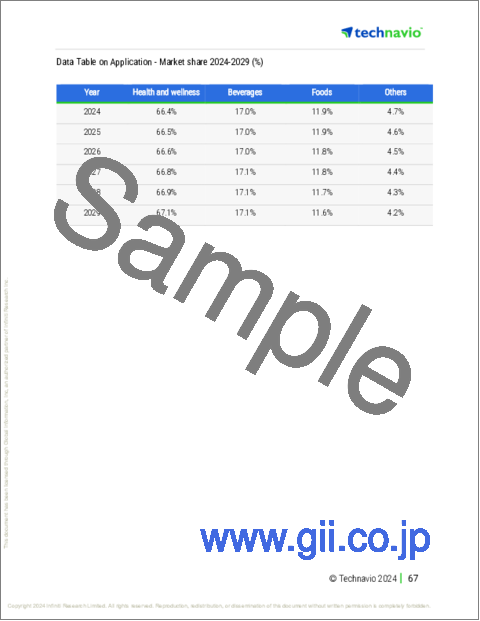
- Chart on Application - Market share 2024-2029 (%)
- Data Table on Application - Market share 2024-2029 (%)
- 8.2 Comparison by Application
- Chart on Comparison by Application
- Data Table on Comparison by Application
- 8.3 Health and wellness - Market size and forecast 2024-2029
- Chart on Health and wellness - Market size and forecast 2024-2029 ($ million)
- Data Table on Health and wellness - Market size and forecast 2024-2029 ($ million)
- Chart on Health and wellness - Year-over-year growth 2024-2029 (%)
- Data Table on Health and wellness - Year-over-year growth 2024-2029 (%)
- 8.4 Beverages - Market size and forecast 2024-2029
- Chart on Beverages - Market size and forecast 2024-2029 ($ million)
- Data Table on Beverages - Market size and forecast 2024-2029 ($ million)
- Chart on Beverages - Year-over-year growth 2024-2029 (%)
- Data Table on Beverages - Year-over-year growth 2024-2029 (%)
- 8.5 Foods - Market size and forecast 2024-2029
- Chart on Foods - Market size and forecast 2024-2029 ($ million)
- Data Table on Foods - Market size and forecast 2024-2029 ($ million)
- Chart on Foods - Year-over-year growth 2024-2029 (%)
- Data Table on Foods - Year-over-year growth 2024-2029 (%)
- 8.6 Others - Market size and forecast 2024-2029
- Chart on Others - Market size and forecast 2024-2029 ($ million)
- Data Table on Others - Market size and forecast 2024-2029 ($ million)
- Chart on Others - Year-over-year growth 2024-2029 (%)
- Data Table on Others - Year-over-year growth 2024-2029 (%)
- 8.7 Market opportunity by Application
- Market opportunity by Application ($ million)
- Data Table on Market opportunity by Application ($ million)
9 Market Segmentation by Distribution Channel
- 9.1 Market segments
- Chart on Distribution Channel - Market share 2024-2029 (%)
- Data Table on Distribution Channel - Market share 2024-2029 (%)
- 9.2 Comparison by Distribution Channel
- Chart on Comparison by Distribution Channel
- Data Table on Comparison by Distribution Channel
- 9.3 Offline - Market size and forecast 2024-2029
- Chart on Offline - Market size and forecast 2024-2029 ($ million)
- Data Table on Offline - Market size and forecast 2024-2029 ($ million)
- Chart on Offline - Year-over-year growth 2024-2029 (%)
- Data Table on Offline - Year-over-year growth 2024-2029 (%)
- 9.4 Online - Market size and forecast 2024-2029
- Chart on Online - Market size and forecast 2024-2029 ($ million)
- Data Table on Online - Market size and forecast 2024-2029 ($ million)
- Chart on Online - Year-over-year growth 2024-2029 (%)
- Data Table on Online - Year-over-year growth 2024-2029 (%)
- 9.5 Market opportunity by Distribution Channel
- Market opportunity by Distribution Channel ($ million)
- Data Table on Market opportunity by Distribution Channel ($ million)
10 Customer Landscape
- 10.1 Customer landscape overview
- Analysis of price sensitivity, lifecycle, customer purchase basket, adoption rates, and purchase criteria
11 Geographic Landscape
- 11.1 Geographic segmentation
- Chart on Market share By Geographical Landscape 2024-2029 (%)
- Data Table on Market share By Geographical Landscape 2024-2029 (%)
- 11.2 Geographic comparison
- Chart on Geographic comparison
- Data Table on Geographic comparison
- 11.3 Europe - Market size and forecast 2024-2029
- Chart on Europe - Market size and forecast 2024-2029 ($ million)
- Data Table on Europe - Market size and forecast 2024-2029 ($ million)
- Chart on Europe - Year-over-year growth 2024-2029 (%)
- Data Table on Europe - Year-over-year growth 2024-2029 (%)
- 11.4 North America - Market size and forecast 2024-2029
- Chart on North America - Market size and forecast 2024-2029 ($ million)
- Data Table on North America - Market size and forecast 2024-2029 ($ million)
- Chart on North America - Year-over-year growth 2024-2029 (%)
- Data Table on North America - Year-over-year growth 2024-2029 (%)
- 11.5 APAC - Market size and forecast 2024-2029
- Chart on APAC - Market size and forecast 2024-2029 ($ million)
- Data Table on APAC - Market size and forecast 2024-2029 ($ million)
- Chart on APAC - Year-over-year growth 2024-2029 (%)
- Data Table on APAC - Year-over-year growth 2024-2029 (%)
- 11.6 South America - Market size and forecast 2024-2029
- Chart on South America - Market size and forecast 2024-2029 ($ million)
- Data Table on South America - Market size and forecast 2024-2029 ($ million)
- Chart on South America - Year-over-year growth 2024-2029 (%)
- Data Table on South America - Year-over-year growth 2024-2029 (%)
- 11.7 Middle East and Africa - Market size and forecast 2024-2029
- Chart on Middle East and Africa - Market size and forecast 2024-2029 ($ million)
- Data Table on Middle East and Africa - Market size and forecast 2024-2029 ($ million)
- Chart on Middle East and Africa - Year-over-year growth 2024-2029 (%)
- Data Table on Middle East and Africa - Year-over-year growth 2024-2029 (%)
- 11.8 US - Market size and forecast 2024-2029
- Chart on US - Market size and forecast 2024-2029 ($ million)
- Data Table on US - Market size and forecast 2024-2029 ($ million)
- Chart on US - Year-over-year growth 2024-2029 (%)
- Data Table on US - Year-over-year growth 2024-2029 (%)
- 11.9 Germany - Market size and forecast 2024-2029
- Chart on Germany - Market size and forecast 2024-2029 ($ million)
- Data Table on Germany - Market size and forecast 2024-2029 ($ million)
- Chart on Germany - Year-over-year growth 2024-2029 (%)
- Data Table on Germany - Year-over-year growth 2024-2029 (%)
- 11.10 Austria - Market size and forecast 2024-2029
- Chart on Austria - Market size and forecast 2024-2029 ($ million)
- Data Table on Austria - Market size and forecast 2024-2029 ($ million)
- Chart on Austria - Year-over-year growth 2024-2029 (%)
- Data Table on Austria - Year-over-year growth 2024-2029 (%)
- 11.11 Italy - Market size and forecast 2024-2029
- Chart on Italy - Market size and forecast 2024-2029 ($ million)
- Data Table on Italy - Market size and forecast 2024-2029 ($ million)
- Chart on Italy - Year-over-year growth 2024-2029 (%)
- Data Table on Italy - Year-over-year growth 2024-2029 (%)
- 11.12 Denmark - Market size and forecast 2024-2029
- Chart on Denmark - Market size and forecast 2024-2029 ($ million)
- Data Table on Denmark - Market size and forecast 2024-2029 ($ million)
- Chart on Denmark - Year-over-year growth 2024-2029 (%)
- Data Table on Denmark - Year-over-year growth 2024-2029 (%)
- 11.13 China - Market size and forecast 2024-2029
- Chart on China - Market size and forecast 2024-2029 ($ million)
- Data Table on China - Market size and forecast 2024-2029 ($ million)
- Chart on China - Year-over-year growth 2024-2029 (%)
- Data Table on China - Year-over-year growth 2024-2029 (%)
- 11.14 UAE - Market size and forecast 2024-2029
- Chart on UAE - Market size and forecast 2024-2029 ($ million)
- Data Table on UAE - Market size and forecast 2024-2029 ($ million)
- Chart on UAE - Year-over-year growth 2024-2029 (%)
- Data Table on UAE - Year-over-year growth 2024-2029 (%)
- 11.15 Brazil - Market size and forecast 2024-2029
- Chart on Brazil - Market size and forecast 2024-2029 ($ million)
- Data Table on Brazil - Market size and forecast 2024-2029 ($ million)
- Chart on Brazil - Year-over-year growth 2024-2029 (%)
- Data Table on Brazil - Year-over-year growth 2024-2029 (%)
- 11.16 India - Market size and forecast 2024-2029
- Chart on India - Market size and forecast 2024-2029 ($ million)
- Data Table on India - Market size and forecast 2024-2029 ($ million)
- Chart on India - Year-over-year growth 2024-2029 (%)
- Data Table on India - Year-over-year growth 2024-2029 (%)
- 11.17 Japan - Market size and forecast 2024-2029
- Chart on Japan - Market size and forecast 2024-2029 ($ million)
- Data Table on Japan - Market size and forecast 2024-2029 ($ million)
- Chart on Japan - Year-over-year growth 2024-2029 (%)
- Data Table on Japan - Year-over-year growth 2024-2029 (%)
- 11.18 Market opportunity By Geographical Landscape
- Market opportunity By Geographical Landscape ($ million)
- Data Tables on Market opportunity By Geographical Landscape ($ million)
12 Drivers, Challenges, and Opportunity/Restraints
- 12.1 Market drivers
- 12.2 Market challenges
- 12.3 Impact of drivers and challenges
- Impact of drivers and challenges in 2024 and 2029
- 12.4 Market opportunities/restraints
13 Competitive Landscape
- 13.1 Overview
- 13.2 Competitive Landscape
- Overview on criticality of inputs and factors of differentiation
- 13.3 Landscape disruption
- Overview on factors of disruption
- 13.4 Industry risks
- Impact of key risks on business
14 Competitive Analysis
- 14.1 Companies profiled
- Companies covered
- 14.2 Company ranking index
- Company ranking index
- 14.3 Market positioning of companies
- Matrix on companies position and classification
- 14.4 Artemis International
- Artemis International - Overview
- Artemis International - Product / Service
- Artemis International - Key offerings
- SWOT
- 14.5 Bluebonnet Nutrition Corp.
- Bluebonnet Nutrition Corp. - Overview
- Bluebonnet Nutrition Corp. - Product / Service
- Bluebonnet Nutrition Corp. - Key offerings
- SWOT
- 14.6 Dr. Willmar Schwabe GmbH and Co. KG
- Dr. Willmar Schwabe GmbH and Co. KG - Overview
- Dr. Willmar Schwabe GmbH and Co. KG - Product / Service
- Dr. Willmar Schwabe GmbH and Co. KG - Key offerings
- SWOT
- 14.7 Flora Inc.
- Flora Inc. - Overview
- Flora Inc. - Product / Service
- Flora Inc. - Key offerings
- SWOT
- 14.8 Gaia Herbs Inc.
- Gaia Herbs Inc. - Overview
- Gaia Herbs Inc. - Product / Service
- Gaia Herbs Inc. - Key news
- Gaia Herbs Inc. - Key offerings
- SWOT
- 14.9 Honest Elderberry Co.
- Honest Elderberry Co. - Overview
- Honest Elderberry Co. - Product / Service
- Honest Elderberry Co. - Key offerings
- SWOT
- 14.10 Innovative Natural Solutions
- Innovative Natural Solutions - Overview
- Innovative Natural Solutions - Product / Service
- Innovative Natural Solutions - Key offerings
- SWOT
- 14.11 Lifeway Foods Inc.
- Lifeway Foods Inc. - Overview
- Lifeway Foods Inc. - Product / Service
- Lifeway Foods Inc. - Key offerings
- SWOT
- 14.12 New Chapter Inc.
- New Chapter Inc. - Overview
- New Chapter Inc. - Product / Service
- New Chapter Inc. - Key offerings
- SWOT
- 14.13 Norms Farms
- Norms Farms - Overview
- Norms Farms - Product / Service
- Norms Farms - Key offerings
- SWOT
- 14.14 NOW Health Group Inc.
- NOW Health Group Inc. - Overview
- NOW Health Group Inc. - Product / Service
- NOW Health Group Inc. - Key offerings
- SWOT
- 14.15 Paradise Herbs And Essentials Inc.
- Paradise Herbs And Essentials Inc. - Overview
- Paradise Herbs And Essentials Inc. - Product / Service
- Paradise Herbs And Essentials Inc. - Key offerings
- SWOT
- 14.16 Pharmacare US Inc.
- Pharmacare US Inc. - Overview
- Pharmacare US Inc. - Product / Service
- Pharmacare US Inc. - Key offerings
- SWOT
- 14.17 Pukka Herbs Ltd.
- Pukka Herbs Ltd. - Overview
- Pukka Herbs Ltd. - Product / Service
- Pukka Herbs Ltd. - Key offerings
- SWOT
- 14.18 Ransom Naturals Ltd.
- Ransom Naturals Ltd. - Overview
- Ransom Naturals Ltd. - Product / Service
- Ransom Naturals Ltd. - Key offerings
- SWOT
15 Appendix
- 15.1 Scope of the report
- 15.2 Inclusions and exclusions checklist
- Inclusions checklist
- Exclusions checklist
- 15.3 Currency conversion rates for US$
- Currency conversion rates for US$
- 15.4 Research methodology
- Research methodology
- 15.5 Data procurement
- Information sources
- 15.6 Data validation
- Data validation
- 15.7 Validation techniques employed for market sizing
- Validation techniques employed for market sizing
- 15.8 Data synthesis
- Data synthesis
- 15.9 360 degree market analysis
- 360 degree market analysis
- 15.10 List of abbreviations
- List of abbreviations

