|
|
市場調査レポート
商品コード
1645596
セメント系副資材の世界市場 2025~2029年Global Supplementary Cementitious Materials Market 2025-2029 |
||||||
|
|||||||
カスタマイズ可能
|
|||||||


| セメント系副資材の世界市場 2025~2029年 |
|
出版日: 2025年01月21日
発行: TechNavio
ページ情報: 英文 208 Pages
納期: 即納可能
|

全表示
- 概要
- 図表
- 目次
セメント系副資材市場は、2024~2029年にかけて142億7,120万米ドル、予測期間中のCAGRは8.8%で成長すると予測されています。
当レポートでは、セメント系副資材市場の全体的な分析、市場規模・予測、動向、成長促進要因、課題、約25のベンダーを網羅したベンダー分析などを掲載しています。
現在の市場シナリオ、最新動向と促進要因、市場環境全体に関する最新分析を提供しています。この市場は、建築・建設活動の増加、シリカフュームの支持特性、アジア太平洋の政府によって推進されているフライアッシュの使用によって牽引されています。
| 市場範囲 | |
|---|---|
| 基準年 | 2025年 |
| 終了年 | 2029年 |
| 予測期間 | 2025~2029年 |
| 成長モメンタム | 加速 |
| 前年比[2025年] | 7.9% |
| CAGR | 8.8% |
| 増分額 | 142億7,120万米ドル |
本調査では、環境にやさしいセメント技術が、今後数年間のセメント系副資材市場の成長を促進する主要要因の一つであるとしています。また、ジオポリマーの人気の高まりと、自己充填コンクリート(SCC)におけるシリカフュームの使用は、市場の大きな需要につながります。
目次
第1章 エグゼクティブサマリー
- 市場概要
第2章 Technavio分析
- 価格・ライフサイクル・顧客購入バスケット・採用率・購入基準の分析
- インプットの重要性と差別化の要因
- 混乱の要因
- 促進要因と課題の影響
第3章 市場情勢
- 市場エコシステム
- 市場の特徴
- バリューチェーン分析
第4章 市場規模
- 市場の定義
- 市場セグメント分析
- 市場規模 2024年
- 市場の展望 2024~2029年
第5章 市場規模実績
- セメント系副資材の世界市場 2019~2023年
- タイプ別セグメント分析 2019~2023年
- 用途別セグメント分析 2019~2023年
- 地域別セグメント分析 2019~2023年
- 国別セグメント分析 2019~2023年
第6章 定性分析
- AIの影響:セメント系副資材の世界市場
第7章 ファイブフォース分析
- ファイブフォースの要約
- 買い手の交渉力
- 供給企業の交渉力
- 新規参入業者の脅威
- 代替品の脅威
- 競争の脅威
- 市況
第8章 市場セグメンテーション:タイプ別
- 市場セグメント
- 比較:タイプ別
- フライアッシュ:市場規模と予測 2024~2029年
- GBFS:市場規模と予測 2024~2029年
- シリカフューム:市場規模と予測 2024~2029年
- 市場機会:タイプ別
第9章 市場セグメンテーション:用途別
- 市場セグメント
- 比較:用途別
- 住宅用:市場規模と予測 2024~2029年
- 業務用:市場規模と予測 2024~2029年
- 産業用:市場規模と予測 2024~2029年
- 市場機会:用途別
第10章 顧客情勢
- 顧客情勢概要
第11章 地域別情勢
- 地域別セグメンテーション
- 比較:地域別
- アジア太平洋:市場規模と予測 2024~2029年
- 北米:市場規模と予測 2024~2029年
- 欧州:市場規模と予測 2024~2029年
- 南米:市場規模と予測 2024~2029年
- 中東・アフリカ:市場規模と予測 2024~2029年
- 中国:市場規模と予測 2024~2029年
- 米国:市場規模と予測 2024~2029年
- インド:市場規模と予測 2024~2029年
- ブラジル:市場規模と予測 2024~2029年
- カナダ:市場規模と予測 2024~2029年
- 英国:市場規模と予測 2024~2029年
- 韓国:市場規模と予測 2024~2029年
- サウジアラビア:市場規模と予測 2024~2029年
- ドイツ:市場規模と予測 2024~2029年
- 日本:市場規模と予測 2024~2029年
- 地域情勢による市場機会
第12章 促進要因・課題・機会・抑制要因
- 市場促進要因
- 市場課題
- 促進要因と課題の影響
- 市場機会・抑制要因
第13章 競合情勢
- 概要
- 競合情勢
- 混乱の状況
- 産業のリスク
第14章 競合分析
- 企業プロファイル
- 企業ランキング指数
- 企業の市場ポジショニング
- ArcelorMittal SA
- Ashtech India Pvt. Ltd.
- BASF SE
- Boral Ltd.
- Carbon Enterprises Ltd.
- CEMEX SAB de CV
- CR Minerals Co. LLC
- CRH Plc
- Diversified Minerals Inc.
- Ferroglobe Plc
- Holcim Ltd.
- Sika AG
- Summit Materials Inc.
- Tata Steel Ltd.
- The Dow Chemical Co.
第15章 付録
Exhibits:
- Exhibits1: Executive Summary - Chart on Market Overview
- Exhibits2: Executive Summary - Data Table on Market Overview
- Exhibits3: Executive Summary - Chart on Global Market Characteristics
- Exhibits4: Executive Summary - Chart on Market By Geographical Landscape
- Exhibits5: Executive Summary - Chart on Market Segmentation by Type
- Exhibits6: Executive Summary - Chart on Market Segmentation by Application
- Exhibits7: Executive Summary - Chart on Incremental Growth
- Exhibits8: Executive Summary - Data Table on Incremental Growth
- Exhibits9: Executive Summary - Chart on Company Market Positioning
- Exhibits10: Analysis of price sensitivity, lifecycle, customer purchase basket, adoption rates, and purchase criteria
- Exhibits11: Overview on criticality of inputs and factors of differentiation
- Exhibits12: Overview on factors of disruption
- Exhibits13: Impact of drivers and challenges in 2024 and 2029
- Exhibits14: Parent Market
- Exhibits15: Data Table on - Parent Market
- Exhibits16: Market characteristics analysis
- Exhibits17: Value chain analysis
- Exhibits18: Offerings of companies included in the market definition
- Exhibits19: Market segments
- Exhibits20: Chart on Global - Market size and forecast 2024-2029 ($ million)
- Exhibits21: Data Table on Global - Market size and forecast 2024-2029 ($ million)
- Exhibits22: Chart on Global Market: Year-over-year growth 2024-2029 (%)
- Exhibits23: Data Table on Global Market: Year-over-year growth 2024-2029 (%)
- Exhibits24: Historic Market Size - Data Table on Global Supplementary Cementitious Materials Market 2019 - 2023 ($ million)
- Exhibits25: Historic Market Size - Type Segment 2019 - 2023 ($ million)
- Exhibits26: Historic Market Size - Application Segment 2019 - 2023 ($ million)
- Exhibits27: Historic Market Size - Geography Segment 2019 - 2023 ($ million)
- Exhibits28: Historic Market Size - Country Segment 2019 - 2023 ($ million)
- Exhibits29: Five forces analysis - Comparison between 2024 and 2029
- Exhibits30: Bargaining power of buyers - Impact of key factors 2024 and 2029
- Exhibits31: Bargaining power of suppliers - Impact of key factors in 2024 and 2029
- Exhibits32: Threat of new entrants - Impact of key factors in 2024 and 2029
- Exhibits33: Threat of substitutes - Impact of key factors in 2024 and 2029
- Exhibits34: Threat of rivalry - Impact of key factors in 2024 and 2029
- Exhibits35: Chart on Market condition - Five forces 2024 and 2029
- Exhibits36: Chart on Type - Market share 2024-2029 (%)
- Exhibits37: Data Table on Type - Market share 2024-2029 (%)
- Exhibits38: Chart on Comparison by Type
- Exhibits39: Data Table on Comparison by Type
- Exhibits40: Chart on Fly ash - Market size and forecast 2024-2029 ($ million)
- Exhibits41: Data Table on Fly ash - Market size and forecast 2024-2029 ($ million)
- Exhibits42: Chart on Fly ash - Year-over-year growth 2024-2029 (%)
- Exhibits43: Data Table on Fly ash - Year-over-year growth 2024-2029 (%)
- Exhibits44: Chart on GBFS - Market size and forecast 2024-2029 ($ million)
- Exhibits45: Data Table on GBFS - Market size and forecast 2024-2029 ($ million)
- Exhibits46: Chart on GBFS - Year-over-year growth 2024-2029 (%)
- Exhibits47: Data Table on GBFS - Year-over-year growth 2024-2029 (%)
- Exhibits48: Chart on Silica fume - Market size and forecast 2024-2029 ($ million)
- Exhibits49: Data Table on Silica fume - Market size and forecast 2024-2029 ($ million)
- Exhibits50: Chart on Silica fume - Year-over-year growth 2024-2029 (%)
- Exhibits51: Data Table on Silica fume - Year-over-year growth 2024-2029 (%)
- Exhibits52: Market opportunity by Type ($ million)
- Exhibits53: Data Table on Market opportunity by Type ($ million)
- Exhibits54: Chart on Application - Market share 2024-2029 (%)
- Exhibits55: Data Table on Application - Market share 2024-2029 (%)
- Exhibits56: Chart on Comparison by Application
- Exhibits57: Data Table on Comparison by Application
- Exhibits58: Chart on Residential - Market size and forecast 2024-2029 ($ million)
- Exhibits59: Data Table on Residential - Market size and forecast 2024-2029 ($ million)
- Exhibits60: Chart on Residential - Year-over-year growth 2024-2029 (%)
- Exhibits61: Data Table on Residential - Year-over-year growth 2024-2029 (%)
- Exhibits62: Chart on Commercial - Market size and forecast 2024-2029 ($ million)
- Exhibits63: Data Table on Commercial - Market size and forecast 2024-2029 ($ million)
- Exhibits64: Chart on Commercial - Year-over-year growth 2024-2029 (%)
- Exhibits65: Data Table on Commercial - Year-over-year growth 2024-2029 (%)
- Exhibits66: Chart on Industrial - Market size and forecast 2024-2029 ($ million)
- Exhibits67: Data Table on Industrial - Market size and forecast 2024-2029 ($ million)
- Exhibits68: Chart on Industrial - Year-over-year growth 2024-2029 (%)
- Exhibits69: Data Table on Industrial - Year-over-year growth 2024-2029 (%)
- Exhibits70: Market opportunity by Application ($ million)
- Exhibits71: Data Table on Market opportunity by Application ($ million)
- Exhibits72: Analysis of price sensitivity, lifecycle, customer purchase basket, adoption rates, and purchase criteria
- Exhibits73: Chart on Market share By Geographical Landscape 2024-2029 (%)
- Exhibits74: Data Table on Market share By Geographical Landscape 2024-2029 (%)
- Exhibits75: Chart on Geographic comparison
- Exhibits76: Data Table on Geographic comparison
- Exhibits77: Chart on APAC - Market size and forecast 2024-2029 ($ million)
- Exhibits78: Data Table on APAC - Market size and forecast 2024-2029 ($ million)
- Exhibits79: Chart on APAC - Year-over-year growth 2024-2029 (%)
- Exhibits80: Data Table on APAC - Year-over-year growth 2024-2029 (%)
- Exhibits81: Chart on North America - Market size and forecast 2024-2029 ($ million)
- Exhibits82: Data Table on North America - Market size and forecast 2024-2029 ($ million)
- Exhibits83: Chart on North America - Year-over-year growth 2024-2029 (%)
- Exhibits84: Data Table on North America - Year-over-year growth 2024-2029 (%)
- Exhibits85: Chart on Europe - Market size and forecast 2024-2029 ($ million)
- Exhibits86: Data Table on Europe - Market size and forecast 2024-2029 ($ million)
- Exhibits87: Chart on Europe - Year-over-year growth 2024-2029 (%)
- Exhibits88: Data Table on Europe - Year-over-year growth 2024-2029 (%)
- Exhibits89: Chart on South America - Market size and forecast 2024-2029 ($ million)
- Exhibits90: Data Table on South America - Market size and forecast 2024-2029 ($ million)
- Exhibits91: Chart on South America - Year-over-year growth 2024-2029 (%)
- Exhibits92: Data Table on South America - Year-over-year growth 2024-2029 (%)
- Exhibits93: Chart on Middle East and Africa - Market size and forecast 2024-2029 ($ million)
- Exhibits94: Data Table on Middle East and Africa - Market size and forecast 2024-2029 ($ million)
- Exhibits95: Chart on Middle East and Africa - Year-over-year growth 2024-2029 (%)
- Exhibits96: Data Table on Middle East and Africa - Year-over-year growth 2024-2029 (%)
- Exhibits97: Chart on China - Market size and forecast 2024-2029 ($ million)
- Exhibits98: Data Table on China - Market size and forecast 2024-2029 ($ million)
- Exhibits99: Chart on China - Year-over-year growth 2024-2029 (%)
- Exhibits100: Data Table on China - Year-over-year growth 2024-2029 (%)
- Exhibits101: Chart on US - Market size and forecast 2024-2029 ($ million)
- Exhibits102: Data Table on US - Market size and forecast 2024-2029 ($ million)
- Exhibits103: Chart on US - Year-over-year growth 2024-2029 (%)
- Exhibits104: Data Table on US - Year-over-year growth 2024-2029 (%)
- Exhibits105: Chart on India - Market size and forecast 2024-2029 ($ million)
- Exhibits106: Data Table on India - Market size and forecast 2024-2029 ($ million)
- Exhibits107: Chart on India - Year-over-year growth 2024-2029 (%)
- Exhibits108: Data Table on India - Year-over-year growth 2024-2029 (%)
- Exhibits109: Chart on Brazil - Market size and forecast 2024-2029 ($ million)
- Exhibits110: Data Table on Brazil - Market size and forecast 2024-2029 ($ million)
- Exhibits111: Chart on Brazil - Year-over-year growth 2024-2029 (%)
- Exhibits112: Data Table on Brazil - Year-over-year growth 2024-2029 (%)
- Exhibits113: Chart on Canada - Market size and forecast 2024-2029 ($ million)
- Exhibits114: Data Table on Canada - Market size and forecast 2024-2029 ($ million)
- Exhibits115: Chart on Canada - Year-over-year growth 2024-2029 (%)
- Exhibits116: Data Table on Canada - Year-over-year growth 2024-2029 (%)
- Exhibits117: Chart on UK - Market size and forecast 2024-2029 ($ million)
- Exhibits118: Data Table on UK - Market size and forecast 2024-2029 ($ million)
- Exhibits119: Chart on UK - Year-over-year growth 2024-2029 (%)
- Exhibits120: Data Table on UK - Year-over-year growth 2024-2029 (%)
- Exhibits121: Chart on South Korea - Market size and forecast 2024-2029 ($ million)
- Exhibits122: Data Table on South Korea - Market size and forecast 2024-2029 ($ million)
- Exhibits123: Chart on South Korea - Year-over-year growth 2024-2029 (%)
- Exhibits124: Data Table on South Korea - Year-over-year growth 2024-2029 (%)
- Exhibits125: Chart on Saudi Arabia - Market size and forecast 2024-2029 ($ million)
- Exhibits126: Data Table on Saudi Arabia - Market size and forecast 2024-2029 ($ million)
- Exhibits127: Chart on Saudi Arabia - Year-over-year growth 2024-2029 (%)
- Exhibits128: Data Table on Saudi Arabia - Year-over-year growth 2024-2029 (%)
- Exhibits129: Chart on Germany - Market size and forecast 2024-2029 ($ million)
- Exhibits130: Data Table on Germany - Market size and forecast 2024-2029 ($ million)
- Exhibits131: Chart on Germany - Year-over-year growth 2024-2029 (%)
- Exhibits132: Data Table on Germany - Year-over-year growth 2024-2029 (%)
- Exhibits133: Chart on Japan - Market size and forecast 2024-2029 ($ million)
- Exhibits134: Data Table on Japan - Market size and forecast 2024-2029 ($ million)
- Exhibits135: Chart on Japan - Year-over-year growth 2024-2029 (%)
- Exhibits136: Data Table on Japan - Year-over-year growth 2024-2029 (%)
- Exhibits137: Market opportunity By Geographical Landscape ($ million)
- Exhibits138: Data Tables on Market opportunity By Geographical Landscape ($ million)
- Exhibits139: Impact of drivers and challenges in 2024 and 2029
- Exhibits140: Overview on criticality of inputs and factors of differentiation
- Exhibits141: Overview on factors of disruption
- Exhibits142: Impact of key risks on business
- Exhibits143: Companies covered
- Exhibits144: Company ranking index
- Exhibits145: Matrix on companies position and classification
- Exhibits146: ArcelorMittal SA - Overview
- Exhibits147: ArcelorMittal SA - Business segments
- Exhibits148: ArcelorMittal SA - Key news
- Exhibits149: ArcelorMittal SA - Key offerings
- Exhibits150: ArcelorMittal SA - Segment focus
- Exhibits151: SWOT
- Exhibits152: Ashtech India Pvt. Ltd. - Overview
- Exhibits153: Ashtech India Pvt. Ltd. - Product / Service
- Exhibits154: Ashtech India Pvt. Ltd. - Key offerings
- Exhibits155: SWOT
- Exhibits156: BASF SE - Overview
- Exhibits157: BASF SE - Business segments
- Exhibits158: BASF SE - Key news
- Exhibits159: BASF SE - Key offerings
- Exhibits160: BASF SE - Segment focus
- Exhibits161: SWOT
- Exhibits162: Boral Ltd. - Overview
- Exhibits163: Boral Ltd. - Business segments
- Exhibits164: Boral Ltd. - Key offerings
- Exhibits165: Boral Ltd. - Segment focus
- Exhibits166: SWOT
- Exhibits167: Carbon Enterprises Ltd. - Overview
- Exhibits168: Carbon Enterprises Ltd. - Product / Service
- Exhibits169: Carbon Enterprises Ltd. - Key offerings
- Exhibits170: SWOT
- Exhibits171: CEMEX SAB de CV - Overview
- Exhibits172: CEMEX SAB de CV - Business segments
- Exhibits173: CEMEX SAB de CV - Key news
- Exhibits174: CEMEX SAB de CV - Key offerings
- Exhibits175: CEMEX SAB de CV - Segment focus
- Exhibits176: SWOT
- Exhibits177: CR Minerals Co. LLC - Overview
- Exhibits178: CR Minerals Co. LLC - Product / Service
- Exhibits179: CR Minerals Co. LLC - Key offerings
- Exhibits180: SWOT
- Exhibits181: CRH Plc - Overview
- Exhibits182: CRH Plc - Business segments
- Exhibits183: CRH Plc - Key news
- Exhibits184: CRH Plc - Key offerings
- Exhibits185: CRH Plc - Segment focus
- Exhibits186: SWOT
- Exhibits187: Diversified Minerals Inc. - Overview
- Exhibits188: Diversified Minerals Inc. - Product / Service
- Exhibits189: Diversified Minerals Inc. - Key offerings
- Exhibits190: SWOT
- Exhibits191: Ferroglobe Plc - Overview
- Exhibits192: Ferroglobe Plc - Business segments
- Exhibits193: Ferroglobe Plc - Key news
- Exhibits194: Ferroglobe Plc - Key offerings
- Exhibits195: Ferroglobe Plc - Segment focus
- Exhibits196: SWOT
- Exhibits197: Holcim Ltd. - Overview
- Exhibits198: Holcim Ltd. - Business segments
- Exhibits199: Holcim Ltd. - Key news
- Exhibits200: Holcim Ltd. - Key offerings
- Exhibits201: Holcim Ltd. - Segment focus
- Exhibits202: SWOT
- Exhibits203: Sika AG - Overview
- Exhibits204: Sika AG - Business segments
- Exhibits205: Sika AG - Key news
- Exhibits206: Sika AG - Key offerings
- Exhibits207: Sika AG - Segment focus
- Exhibits208: SWOT
- Exhibits209: Summit Materials Inc. - Overview
- Exhibits210: Summit Materials Inc. - Business segments
- Exhibits211: Summit Materials Inc. - Key news
- Exhibits212: Summit Materials Inc. - Key offerings
- Exhibits213: Summit Materials Inc. - Segment focus
- Exhibits214: SWOT
- Exhibits215: Tata Steel Ltd. - Overview
- Exhibits216: Tata Steel Ltd. - Business segments
- Exhibits217: Tata Steel Ltd. - Key news
- Exhibits218: Tata Steel Ltd. - Key offerings
- Exhibits219: Tata Steel Ltd. - Segment focus
- Exhibits220: SWOT
- Exhibits221: The Dow Chemical Co. - Overview
- Exhibits222: The Dow Chemical Co. - Business segments
- Exhibits223: The Dow Chemical Co. - Key news
- Exhibits224: The Dow Chemical Co. - Key offerings
- Exhibits225: The Dow Chemical Co. - Segment focus
- Exhibits226: SWOT
- Exhibits227: Inclusions checklist
- Exhibits228: Exclusions checklist
- Exhibits229: Currency conversion rates for US$
- Exhibits230: Research methodology
- Exhibits231: Information sources
- Exhibits232: Data validation
- Exhibits233: Validation techniques employed for market sizing
- Exhibits234: Data synthesis
- Exhibits235: 360 degree market analysis
- Exhibits236: List of abbreviations
The supplementary cementitious materials market is forecasted to grow by $ 14271.2 million during 2024-2029, accelerating at a CAGR of 8.8% during the forecast period. The report on the supplementary cementitious materials market provides a holistic analysis, market size and forecast, trends, growth drivers, and challenges, as well as vendor analysis covering around 25 vendors.
The report offers an up-to-date analysis regarding the current market scenario, the latest trends and drivers, and the overall market environment. The market is driven by increase in building and construction activities, supportive properties of silica fume, and use of fly ash promoted by government in apac.
| Market Scope | |
|---|---|
| Base Year | 2025 |
| End Year | 2029 |
| Series Year | 2025-2029 |
| Growth Momentum | Accelerate |
| YOY 2025 | 7.9% |
| CAGR | 8.8% |
| Incremental Value | $14271.2 mn |
Technavio's supplementary cementitious materials market is segmented as below:
By Type
- Fly ash
- GBFS
- Silica fume
By Application
- Residential
- Commercial
- Industrial
By Geographical Landscape
- APAC
- North America
- Europe
- South America
- Middle East and Africa
This study identifies the environment-friendly cement technology as one of the prime reasons driving the supplementary cementitious materials market growth during the next few years. Also, growing popularity of geopolymers and use of silica fume in self-compacting concrete (SCC) will lead to sizable demand in the market.
The report on the supplementary cementitious materials market covers the following areas:
- Supplementary Cementitious Materials Market sizing
- Supplementary Cementitious Materials Market forecast
- Supplementary Cementitious Materials Market industry analysis
The robust vendor analysis is designed to help clients improve their market position, and in line with this, this report provides a detailed analysis of several leading supplementary cementitious materials market vendors that include ArcelorMittal SA, Ashtech India Pvt. Ltd., BASF SE, Boral Ltd., Carbon Enterprises Ltd., CEMEX SAB de CV, CR Minerals Co. LLC, CRH Plc, Diversified Minerals Inc., Elkem ASA, Ferroglobe Plc, Heidelberg Materials AG, Holcim Ltd., Kryton International Inc., Nippon Steel Corp., Shanghai Building Materials Group Co. Ltd., Sika AG, Summit Materials Inc., Tata Steel Ltd., and The Dow Chemical Co.. Also, the supplementary cementitious materials market analysis report includes information on upcoming trends and challenges that will influence market growth. This is to help companies strategize and leverage all forthcoming growth opportunities.
The study was conducted using an objective combination of primary and secondary information including inputs from key participants in the industry. The report contains a comprehensive market and vendor landscape in addition to an analysis of the key vendors.
The publisher presents a detailed picture of the market by the way of study, synthesis, and summation of data from multiple sources by an analysis of key parameters such as profit, pricing, competition, and promotions. It presents various market facets by identifying the key industry influencers. The data presented is comprehensive, reliable, and a result of extensive primary and secondary research. The market research reports provide a complete competitive landscape and an in-depth vendor selection methodology and analysis using qualitative and quantitative research to forecast accurate market growth.
Table of Contents
1 Executive Summary
- 1.1 Market overview
- Executive Summary - Chart on Market Overview
- Executive Summary - Data Table on Market Overview
- Executive Summary - Chart on Global Market Characteristics
- Executive Summary - Chart on Market By Geographical Landscape
- Executive Summary - Chart on Market Segmentation by Type
- Executive Summary - Chart on Market Segmentation by Application
- Executive Summary - Chart on Incremental Growth
- Executive Summary - Data Table on Incremental Growth
- Executive Summary - Chart on Company Market Positioning
2 Technavio Analysis
- 2.1 Analysis of price sensitivity, lifecycle, customer purchase basket, adoption rates, and purchase criteria
- Analysis of price sensitivity, lifecycle, customer purchase basket, adoption rates, and purchase criteria
- 2.2 Criticality of inputs and Factors of differentiation
- Overview on criticality of inputs and factors of differentiation
- 2.3 Factors of disruption
- Overview on factors of disruption
- 2.4 Impact of drivers and challenges
- Impact of drivers and challenges in 2024 and 2029
3 Market Landscape
- 3.1 Market ecosystem
- Parent Market
- Data Table on - Parent Market
- 3.2 Market characteristics
- Market characteristics analysis
- 3.3 Value chain analysis
- Value chain analysis
4 Market Sizing
- 4.1 Market definition
- Offerings of companies included in the market definition
- 4.2 Market segment analysis
- Market segments
- 4.3 Market size 2024
- 4.4 Market outlook: Forecast for 2024-2029
- Chart on Global - Market size and forecast 2024-2029 ($ million)
- Data Table on Global - Market size and forecast 2024-2029 ($ million)
- Chart on Global Market: Year-over-year growth 2024-2029 (%)
- Data Table on Global Market: Year-over-year growth 2024-2029 (%)
5 Historic Market Size
- 5.1 Global Supplementary Cementitious Materials Market 2019 - 2023
- Historic Market Size - Data Table on Global Supplementary Cementitious Materials Market 2019 - 2023 ($ million)
- 5.2 Type segment analysis 2019 - 2023
- Historic Market Size - Type Segment 2019 - 2023 ($ million)
- 5.3 Application segment analysis 2019 - 2023
- Historic Market Size - Application Segment 2019 - 2023 ($ million)
- 5.4 Geography segment analysis 2019 - 2023
- Historic Market Size - Geography Segment 2019 - 2023 ($ million)
- 5.5 Country segment analysis 2019 - 2023
- Historic Market Size - Country Segment 2019 - 2023 ($ million)
6 Qualitative Analysis
- 6.1 The AI impact on global supplementary cementitious materials market
7 Five Forces Analysis
- 7.1 Five forces summary
- Five forces analysis - Comparison between 2024 and 2029
- 7.2 Bargaining power of buyers
- Bargaining power of buyers - Impact of key factors 2024 and 2029
- 7.3 Bargaining power of suppliers
- Bargaining power of suppliers - Impact of key factors in 2024 and 2029
- 7.4 Threat of new entrants
- Threat of new entrants - Impact of key factors in 2024 and 2029
- 7.5 Threat of substitutes
- Threat of substitutes - Impact of key factors in 2024 and 2029
- 7.6 Threat of rivalry
- Threat of rivalry - Impact of key factors in 2024 and 2029
- 7.7 Market condition
- Chart on Market condition - Five forces 2024 and 2029
8 Market Segmentation by Type
- 8.1 Market segments
- Chart on Type - Market share 2024-2029 (%)
- Data Table on Type - Market share 2024-2029 (%)
- 8.2 Comparison by Type
- Chart on Comparison by Type
- Data Table on Comparison by Type
- 8.3 Fly ash - Market size and forecast 2024-2029
- Chart on Fly ash - Market size and forecast 2024-2029 ($ million)
- Data Table on Fly ash - Market size and forecast 2024-2029 ($ million)
- Chart on Fly ash - Year-over-year growth 2024-2029 (%)
- Data Table on Fly ash - Year-over-year growth 2024-2029 (%)
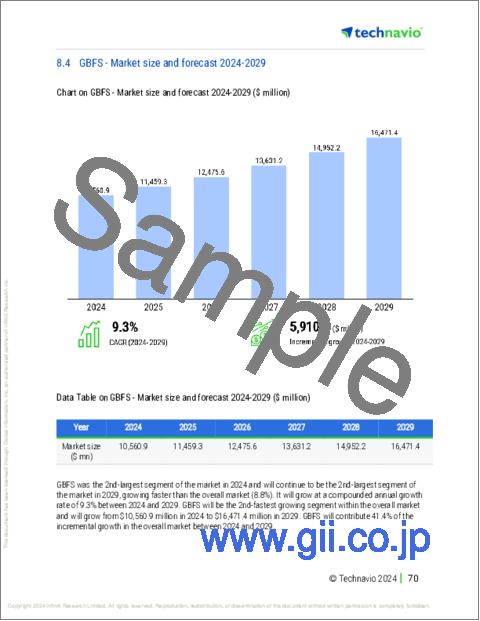
- 8.4 GBFS - Market size and forecast 2024-2029
- Chart on GBFS - Market size and forecast 2024-2029 ($ million)
- Data Table on GBFS - Market size and forecast 2024-2029 ($ million)
- Chart on GBFS - Year-over-year growth 2024-2029 (%)
- Data Table on GBFS - Year-over-year growth 2024-2029 (%)
- 8.5 Silica fume - Market size and forecast 2024-2029
- Chart on Silica fume - Market size and forecast 2024-2029 ($ million)
- Data Table on Silica fume - Market size and forecast 2024-2029 ($ million)
- Chart on Silica fume - Year-over-year growth 2024-2029 (%)
- Data Table on Silica fume - Year-over-year growth 2024-2029 (%)
- 8.6 Market opportunity by Type
- Market opportunity by Type ($ million)
- Data Table on Market opportunity by Type ($ million)
9 Market Segmentation by Application
- 9.1 Market segments
- Chart on Application - Market share 2024-2029 (%)
- Data Table on Application - Market share 2024-2029 (%)
- 9.2 Comparison by Application
- Chart on Comparison by Application
- Data Table on Comparison by Application
- 9.3 Residential - Market size and forecast 2024-2029
- Chart on Residential - Market size and forecast 2024-2029 ($ million)
- Data Table on Residential - Market size and forecast 2024-2029 ($ million)
- Chart on Residential - Year-over-year growth 2024-2029 (%)
- Data Table on Residential - Year-over-year growth 2024-2029 (%)
- 9.4 Commercial - Market size and forecast 2024-2029
- Chart on Commercial - Market size and forecast 2024-2029 ($ million)
- Data Table on Commercial - Market size and forecast 2024-2029 ($ million)
- Chart on Commercial - Year-over-year growth 2024-2029 (%)
- Data Table on Commercial - Year-over-year growth 2024-2029 (%)
- 9.5 Industrial - Market size and forecast 2024-2029
- Chart on Industrial - Market size and forecast 2024-2029 ($ million)
- Data Table on Industrial - Market size and forecast 2024-2029 ($ million)
- Chart on Industrial - Year-over-year growth 2024-2029 (%)
- Data Table on Industrial - Year-over-year growth 2024-2029 (%)
- 9.6 Market opportunity by Application
- Market opportunity by Application ($ million)
- Data Table on Market opportunity by Application ($ million)
10 Customer Landscape
- 10.1 Customer landscape overview
- Analysis of price sensitivity, lifecycle, customer purchase basket, adoption rates, and purchase criteria
11 Geographic Landscape
- 11.1 Geographic segmentation
- Chart on Market share By Geographical Landscape 2024-2029 (%)
- Data Table on Market share By Geographical Landscape 2024-2029 (%)
- 11.2 Geographic comparison
- Chart on Geographic comparison
- Data Table on Geographic comparison
- 11.3 APAC - Market size and forecast 2024-2029
- Chart on APAC - Market size and forecast 2024-2029 ($ million)
- Data Table on APAC - Market size and forecast 2024-2029 ($ million)
- Chart on APAC - Year-over-year growth 2024-2029 (%)
- Data Table on APAC - Year-over-year growth 2024-2029 (%)
- 11.4 North America - Market size and forecast 2024-2029
- Chart on North America - Market size and forecast 2024-2029 ($ million)
- Data Table on North America - Market size and forecast 2024-2029 ($ million)
- Chart on North America - Year-over-year growth 2024-2029 (%)
- Data Table on North America - Year-over-year growth 2024-2029 (%)
- 11.5 Europe - Market size and forecast 2024-2029
- Chart on Europe - Market size and forecast 2024-2029 ($ million)
- Data Table on Europe - Market size and forecast 2024-2029 ($ million)
- Chart on Europe - Year-over-year growth 2024-2029 (%)
- Data Table on Europe - Year-over-year growth 2024-2029 (%)
- 11.6 South America - Market size and forecast 2024-2029
- Chart on South America - Market size and forecast 2024-2029 ($ million)
- Data Table on South America - Market size and forecast 2024-2029 ($ million)
- Chart on South America - Year-over-year growth 2024-2029 (%)
- Data Table on South America - Year-over-year growth 2024-2029 (%)
- 11.7 Middle East and Africa - Market size and forecast 2024-2029
- Chart on Middle East and Africa - Market size and forecast 2024-2029 ($ million)
- Data Table on Middle East and Africa - Market size and forecast 2024-2029 ($ million)
- Chart on Middle East and Africa - Year-over-year growth 2024-2029 (%)
- Data Table on Middle East and Africa - Year-over-year growth 2024-2029 (%)
- 11.8 China - Market size and forecast 2024-2029
- Chart on China - Market size and forecast 2024-2029 ($ million)
- Data Table on China - Market size and forecast 2024-2029 ($ million)
- Chart on China - Year-over-year growth 2024-2029 (%)
- Data Table on China - Year-over-year growth 2024-2029 (%)
- 11.9 US - Market size and forecast 2024-2029
- Chart on US - Market size and forecast 2024-2029 ($ million)
- Data Table on US - Market size and forecast 2024-2029 ($ million)
- Chart on US - Year-over-year growth 2024-2029 (%)
- Data Table on US - Year-over-year growth 2024-2029 (%)
- 11.10 India - Market size and forecast 2024-2029
- Chart on India - Market size and forecast 2024-2029 ($ million)
- Data Table on India - Market size and forecast 2024-2029 ($ million)
- Chart on India - Year-over-year growth 2024-2029 (%)
- Data Table on India - Year-over-year growth 2024-2029 (%)
- 11.11 Brazil - Market size and forecast 2024-2029
- Chart on Brazil - Market size and forecast 2024-2029 ($ million)
- Data Table on Brazil - Market size and forecast 2024-2029 ($ million)
- Chart on Brazil - Year-over-year growth 2024-2029 (%)
- Data Table on Brazil - Year-over-year growth 2024-2029 (%)
- 11.12 Canada - Market size and forecast 2024-2029
- Chart on Canada - Market size and forecast 2024-2029 ($ million)
- Data Table on Canada - Market size and forecast 2024-2029 ($ million)
- Chart on Canada - Year-over-year growth 2024-2029 (%)
- Data Table on Canada - Year-over-year growth 2024-2029 (%)
- 11.13 UK - Market size and forecast 2024-2029
- Chart on UK - Market size and forecast 2024-2029 ($ million)
- Data Table on UK - Market size and forecast 2024-2029 ($ million)
- Chart on UK - Year-over-year growth 2024-2029 (%)
- Data Table on UK - Year-over-year growth 2024-2029 (%)
- 11.14 South Korea - Market size and forecast 2024-2029
- Chart on South Korea - Market size and forecast 2024-2029 ($ million)
- Data Table on South Korea - Market size and forecast 2024-2029 ($ million)
- Chart on South Korea - Year-over-year growth 2024-2029 (%)
- Data Table on South Korea - Year-over-year growth 2024-2029 (%)
- 11.15 Saudi Arabia - Market size and forecast 2024-2029
- Chart on Saudi Arabia - Market size and forecast 2024-2029 ($ million)
- Data Table on Saudi Arabia - Market size and forecast 2024-2029 ($ million)
- Chart on Saudi Arabia - Year-over-year growth 2024-2029 (%)
- Data Table on Saudi Arabia - Year-over-year growth 2024-2029 (%)
- 11.16 Germany - Market size and forecast 2024-2029
- Chart on Germany - Market size and forecast 2024-2029 ($ million)
- Data Table on Germany - Market size and forecast 2024-2029 ($ million)
- Chart on Germany - Year-over-year growth 2024-2029 (%)
- Data Table on Germany - Year-over-year growth 2024-2029 (%)
- 11.17 Japan - Market size and forecast 2024-2029
- Chart on Japan - Market size and forecast 2024-2029 ($ million)
- Data Table on Japan - Market size and forecast 2024-2029 ($ million)
- Chart on Japan - Year-over-year growth 2024-2029 (%)
- Data Table on Japan - Year-over-year growth 2024-2029 (%)
- 11.18 Market opportunity By Geographical Landscape
- Market opportunity By Geographical Landscape ($ million)
- Data Tables on Market opportunity By Geographical Landscape ($ million)
12 Drivers, Challenges, and Opportunity/Restraints
- 12.1 Market drivers
- 12.2 Market challenges
- 12.3 Impact of drivers and challenges
- Impact of drivers and challenges in 2024 and 2029
- 12.4 Market opportunities/restraints
13 Competitive Landscape
- 13.1 Overview
- 13.2 Competitive Landscape
- Overview on criticality of inputs and factors of differentiation
- 13.3 Landscape disruption
- Overview on factors of disruption
- 13.4 Industry risks
- Impact of key risks on business
14 Competitive Analysis
- 14.1 Companies profiled
- Companies covered
- 14.2 Company ranking index
- Company ranking index
- 14.3 Market positioning of companies
- Matrix on companies position and classification
- 14.4 ArcelorMittal SA
- ArcelorMittal SA - Overview
- ArcelorMittal SA - Business segments
- ArcelorMittal SA - Key news
- ArcelorMittal SA - Key offerings
- ArcelorMittal SA - Segment focus
- SWOT
- 14.5 Ashtech India Pvt. Ltd.
- Ashtech India Pvt. Ltd. - Overview
- Ashtech India Pvt. Ltd. - Product / Service
- Ashtech India Pvt. Ltd. - Key offerings
- SWOT
- 14.6 BASF SE
- BASF SE - Overview
- BASF SE - Business segments
- BASF SE - Key news
- BASF SE - Key offerings
- BASF SE - Segment focus
- SWOT
- 14.7 Boral Ltd.
- Boral Ltd. - Overview
- Boral Ltd. - Business segments
- Boral Ltd. - Key offerings
- Boral Ltd. - Segment focus
- SWOT
- 14.8 Carbon Enterprises Ltd.
- Carbon Enterprises Ltd. - Overview
- Carbon Enterprises Ltd. - Product / Service
- Carbon Enterprises Ltd. - Key offerings
- SWOT
- 14.9 CEMEX SAB de CV
- CEMEX SAB de CV - Overview
- CEMEX SAB de CV - Business segments
- CEMEX SAB de CV - Key news
- CEMEX SAB de CV - Key offerings
- CEMEX SAB de CV - Segment focus
- SWOT
- 14.10 CR Minerals Co. LLC
- CR Minerals Co. LLC - Overview
- CR Minerals Co. LLC - Product / Service
- CR Minerals Co. LLC - Key offerings
- SWOT
- 14.11 CRH Plc
- CRH Plc - Overview
- CRH Plc - Business segments
- CRH Plc - Key news
- CRH Plc - Key offerings
- CRH Plc - Segment focus
- SWOT
- 14.12 Diversified Minerals Inc.
- Diversified Minerals Inc. - Overview
- Diversified Minerals Inc. - Product / Service
- Diversified Minerals Inc. - Key offerings
- SWOT
- 14.13 Ferroglobe Plc
- Ferroglobe Plc - Overview
- Ferroglobe Plc - Business segments
- Ferroglobe Plc - Key news
- Ferroglobe Plc - Key offerings
- Ferroglobe Plc - Segment focus
- SWOT
- 14.14 Holcim Ltd.
- Holcim Ltd. - Overview
- Holcim Ltd. - Business segments
- Holcim Ltd. - Key news
- Holcim Ltd. - Key offerings
- Holcim Ltd. - Segment focus
- SWOT
- 14.15 Sika AG
- Sika AG - Overview
- Sika AG - Business segments
- Sika AG - Key news
- Sika AG - Key offerings
- Sika AG - Segment focus
- SWOT
- 14.16 Summit Materials Inc.
- Summit Materials Inc. - Overview
- Summit Materials Inc. - Business segments
- Summit Materials Inc. - Key news
- Summit Materials Inc. - Key offerings
- Summit Materials Inc. - Segment focus
- SWOT
- 14.17 Tata Steel Ltd.
- Tata Steel Ltd. - Overview
- Tata Steel Ltd. - Business segments
- Tata Steel Ltd. - Key news
- Tata Steel Ltd. - Key offerings
- Tata Steel Ltd. - Segment focus
- SWOT
- 14.18 The Dow Chemical Co.
- The Dow Chemical Co. - Overview
- The Dow Chemical Co. - Business segments
- The Dow Chemical Co. - Key news
- The Dow Chemical Co. - Key offerings
- The Dow Chemical Co. - Segment focus
- SWOT
15 Appendix
- 15.1 Scope of the report
- 15.2 Inclusions and exclusions checklist
- Inclusions checklist
- Exclusions checklist
- 15.3 Currency conversion rates for US$
- Currency conversion rates for US$
- 15.4 Research methodology
- Research methodology
- 15.5 Data procurement
- Information sources
- 15.6 Data validation
- Data validation
- 15.7 Validation techniques employed for market sizing
- Validation techniques employed for market sizing
- 15.8 Data synthesis
- Data synthesis
- 15.9 360 degree market analysis
- 360 degree market analysis
- 15.10 List of abbreviations
- List of abbreviations
