|
|
市場調査レポート
商品コード
1645393
害虫駆除サービスの世界市場 (2025~2029年)Global Pest Control Services Market 2025-2029 |
||||||

|
|||||||
カスタマイズ可能
|
|||||||

| 害虫駆除サービスの世界市場 (2025~2029年) |
|
出版日: 2025年01月09日
発行: TechNavio
ページ情報: 英文 196 Pages
納期: 即納可能
|

全表示
- 概要
- 図表
- 目次
害虫駆除サービス市場は2024年~2029年に118億5,750万米ドル、予測期間中のCAGRは7.6%で成長すると予測されます。
当レポートでは、害虫駆除サービス市場の全体的な分析、市場規模・予測、動向、成長促進要因、課題、約25のベンダーを網羅したベンダー分析などを掲載しています。
現在の市場シナリオ、最新動向と促進要因、市場環境全体に関する最新分析を提供しています。市場は、保険ベースの害虫駆除サービスに対する需要の増加、ホスピタリティ産業、製薬産業、食品加工産業の成長、害虫駆除手順の複雑化、害虫駆除に使用される化学物質の安全プロトコルなどが牽引しています。
| 市場範囲 | |
|---|---|
| 基準年 | 2025年 |
| 終了年 | 2029年 |
| 予測期間 | 2025~2029年 |
| 成長モメンタム | 加速 |
| 前年比2025年 | 6.6% |
| CAGR | 7.6% |
| 増分額 | 118億5,750万米ドル |
本調査では、今後数年間の害虫駆除サービス市場の成長を促進する主な理由の1つとして、デジタル害虫駆除サービスの導入増加を挙げています。また、新興国ではガーデニングの人気が高まっており、環境に優しいグリーン害虫駆除の導入に注目が集まっていることも、市場の大きな需要につながると思われます。
目次
第1章 エグゼクティブサマリー
- 市場概要
第2章 Technavioの分析
- 価格感度・ライフサイクル・顧客購入バスケット・採用率・購入基準の分析
- インプットの重要性と差別化の要因
- ディスラプションの要因
- 促進要因と課題の影響
第3章 市場情勢
- 市場エコシステム
- 市場の特徴
- バリューチェーン分析
第4章 市場規模
- 市場の定義
- 市場セグメント分析
- 市場規模 (2024年)
- 市場展望 (2024~2029年)
第5章 市場規模実績
- 害虫駆除サービスの世界市場 (2019~2023年)
- 用途別セグメント分析 (2019~2023年)
- エンドユーザー別セグメント分析 (2019~2023年)
- 地域別セグメント分析 (2019~2023年)
- 国別セグメント分析 (2019~2023年)
第6章 定性分析
- AIの影響:害虫駆除サービスの世界市場
第7章 ファイブフォース分析
- ファイブフォースの要約
- 買い手の交渉力
- 供給企業の交渉力
- 新規参入業者の脅威
- 代替品の脅威
- 競争の脅威
- 市況
第8章 市場セグメンテーション:用途別
- 市場セグメント
- 比較:用途別
- 一般害虫駆除:市場規模と予測 (2024~2029年)
- シロアリ駆除:市場規模と予測 (2024~2029年)
- 市場機会:用途別
第9章 市場セグメンテーション:エンドユーザー別
- 市場セグメント
- 比較:エンドユーザー別
- 住宅:市場規模と予測 (2024~2029年)
- 商業:市場規模と予測 (2024~2029年)
- 市場機会:エンドユーザー別
第10章 顧客情勢
- 顧客情勢の概要
第11章 地域別情勢
- 地域別セグメンテーション
- 地域別比較
- 北米:市場規模と予測 (2024~2029年)
- 欧州:市場規模と予測 (2024~2029年)
- アジア太平洋:市場規模と予測 (2024~2029年)
- 南米:市場規模と予測 (2024~2029年)
- 中東・アフリカ:市場規模と予測 (2024~2029年)
- 米国:市場規模と予測 (2024~2029年)
- 英国:市場規模と予測 (2024~2029年)
- カナダ:市場規模と予測 (2024~2029年)
- ドイツ:市場規模と予測 (2024~2029年)
- インド:市場規模と予測 (2024~2029年)
- 中国:市場規模と予測 (2024~2029年)
- フランス:市場規模と予測 (2024~2029年)
- 日本:市場規模と予測 (2024~2029年)
- ブラジル:市場規模と予測 (2024~2029年)
- アラブ首長国連邦:市場規模と予測 (2024~2029年)
- 市場機会:地域情勢別
第12章 促進要因・課題・機会・抑制要因
- 市場促進要因
- 市場の課題
- 促進要因と課題の影響
- 市場の機会・抑制要因
第13章 競合情勢
- 概要
- 競合情勢
- ディスラプションの状況
- 業界のリスク
第14章 競合分析
- 企業プロファイル
- 企業ランキング指数
- 企業の市場ポジショニング
- ABC Home and Commercial Services
- Anticimex International AB
- Arrow Exterminators Inc.
- Asante Co. Ltd.
- Cooks Pest Control Inc.
- Dodson Pest Control Inc.
- Ecolab Inc.
- Green Pest Solutions
- Massey Services Inc.
- Pelsis Ltd.
- Rentokil Initial Plc
- Rollins Inc.
- SANIX Inc.
- The ServiceMaster Co. LLC
- Truly Nolen of America Inc.
第15章 付録
Exhibits:
- Exhibits1: Executive Summary - Chart on Market Overview
- Exhibits2: Executive Summary - Data Table on Market Overview
- Exhibits3: Executive Summary - Chart on Global Market Characteristics
- Exhibits4: Executive Summary - Chart on Market By Geographical Landscape
- Exhibits5: Executive Summary - Chart on Market Segmentation by Application
- Exhibits6: Executive Summary - Chart on Market Segmentation by End-user
- Exhibits7: Executive Summary - Chart on Incremental Growth
- Exhibits8: Executive Summary - Data Table on Incremental Growth
- Exhibits9: Executive Summary - Chart on Company Market Positioning
- Exhibits10: Analysis of price sensitivity, lifecycle, customer purchase basket, adoption rates, and purchase criteria
- Exhibits11: Overview on criticality of inputs and factors of differentiation
- Exhibits12: Overview on factors of disruption
- Exhibits13: Impact of drivers and challenges in 2024 and 2029
- Exhibits14: Parent Market
- Exhibits15: Data Table on - Parent Market
- Exhibits16: Market characteristics analysis
- Exhibits17: Value chain analysis
- Exhibits18: Offerings of companies included in the market definition
- Exhibits19: Market segments
- Exhibits20: Chart on Global - Market size and forecast 2024-2029 ($ million)
- Exhibits21: Data Table on Global - Market size and forecast 2024-2029 ($ million)
- Exhibits22: Chart on Global Market: Year-over-year growth 2024-2029 (%)
- Exhibits23: Data Table on Global Market: Year-over-year growth 2024-2029 (%)
- Exhibits24: Historic Market Size - Data Table on Global Pest Control Services Market 2019 - 2023 ($ million)
- Exhibits25: Historic Market Size - Application Segment 2019 - 2023 ($ million)
- Exhibits26: Historic Market Size - End-user Segment 2019 - 2023 ($ million)
- Exhibits27: Historic Market Size - Geography Segment 2019 - 2023 ($ million)
- Exhibits28: Historic Market Size - Country Segment 2019 - 2023 ($ million)
- Exhibits29: Five forces analysis - Comparison between 2024 and 2029
- Exhibits30: Bargaining power of buyers - Impact of key factors 2024 and 2029
- Exhibits31: Bargaining power of suppliers - Impact of key factors in 2024 and 2029
- Exhibits32: Threat of new entrants - Impact of key factors in 2024 and 2029
- Exhibits33: Threat of substitutes - Impact of key factors in 2024 and 2029
- Exhibits34: Threat of rivalry - Impact of key factors in 2024 and 2029
- Exhibits35: Chart on Market condition - Five forces 2024 and 2029
- Exhibits36: Chart on Application - Market share 2024-2029 (%)
- Exhibits37: Data Table on Application - Market share 2024-2029 (%)
- Exhibits38: Chart on Comparison by Application
- Exhibits39: Data Table on Comparison by Application
- Exhibits40: Chart on General pest control - Market size and forecast 2024-2029 ($ million)
- Exhibits41: Data Table on General pest control - Market size and forecast 2024-2029 ($ million)
- Exhibits42: Chart on General pest control - Year-over-year growth 2024-2029 (%)
- Exhibits43: Data Table on General pest control - Year-over-year growth 2024-2029 (%)
- Exhibits44: Chart on Termite control - Market size and forecast 2024-2029 ($ million)
- Exhibits45: Data Table on Termite control - Market size and forecast 2024-2029 ($ million)
- Exhibits46: Chart on Termite control - Year-over-year growth 2024-2029 (%)
- Exhibits47: Data Table on Termite control - Year-over-year growth 2024-2029 (%)
- Exhibits48: Market opportunity by Application ($ million)
- Exhibits49: Data Table on Market opportunity by Application ($ million)
- Exhibits50: Chart on End-user - Market share 2024-2029 (%)
- Exhibits51: Data Table on End-user - Market share 2024-2029 (%)
- Exhibits52: Chart on Comparison by End-user
- Exhibits53: Data Table on Comparison by End-user
- Exhibits54: Chart on Residential - Market size and forecast 2024-2029 ($ million)
- Exhibits55: Data Table on Residential - Market size and forecast 2024-2029 ($ million)
- Exhibits56: Chart on Residential - Year-over-year growth 2024-2029 (%)
- Exhibits57: Data Table on Residential - Year-over-year growth 2024-2029 (%)
- Exhibits58: Chart on Commercial - Market size and forecast 2024-2029 ($ million)
- Exhibits59: Data Table on Commercial - Market size and forecast 2024-2029 ($ million)
- Exhibits60: Chart on Commercial - Year-over-year growth 2024-2029 (%)
- Exhibits61: Data Table on Commercial - Year-over-year growth 2024-2029 (%)
- Exhibits62: Market opportunity by End-user ($ million)
- Exhibits63: Data Table on Market opportunity by End-user ($ million)
- Exhibits64: Analysis of price sensitivity, lifecycle, customer purchase basket, adoption rates, and purchase criteria
- Exhibits65: Chart on Market share By Geographical Landscape 2024-2029 (%)
- Exhibits66: Data Table on Market share By Geographical Landscape 2024-2029 (%)
- Exhibits67: Chart on Geographic comparison
- Exhibits68: Data Table on Geographic comparison
- Exhibits69: Chart on North America - Market size and forecast 2024-2029 ($ million)
- Exhibits70: Data Table on North America - Market size and forecast 2024-2029 ($ million)
- Exhibits71: Chart on North America - Year-over-year growth 2024-2029 (%)
- Exhibits72: Data Table on North America - Year-over-year growth 2024-2029 (%)
- Exhibits73: Chart on Europe - Market size and forecast 2024-2029 ($ million)
- Exhibits74: Data Table on Europe - Market size and forecast 2024-2029 ($ million)
- Exhibits75: Chart on Europe - Year-over-year growth 2024-2029 (%)
- Exhibits76: Data Table on Europe - Year-over-year growth 2024-2029 (%)
- Exhibits77: Chart on APAC - Market size and forecast 2024-2029 ($ million)
- Exhibits78: Data Table on APAC - Market size and forecast 2024-2029 ($ million)
- Exhibits79: Chart on APAC - Year-over-year growth 2024-2029 (%)
- Exhibits80: Data Table on APAC - Year-over-year growth 2024-2029 (%)
- Exhibits81: Chart on South America - Market size and forecast 2024-2029 ($ million)
- Exhibits82: Data Table on South America - Market size and forecast 2024-2029 ($ million)
- Exhibits83: Chart on South America - Year-over-year growth 2024-2029 (%)
- Exhibits84: Data Table on South America - Year-over-year growth 2024-2029 (%)
- Exhibits85: Chart on Middle East and Africa - Market size and forecast 2024-2029 ($ million)
- Exhibits86: Data Table on Middle East and Africa - Market size and forecast 2024-2029 ($ million)
- Exhibits87: Chart on Middle East and Africa - Year-over-year growth 2024-2029 (%)
- Exhibits88: Data Table on Middle East and Africa - Year-over-year growth 2024-2029 (%)
- Exhibits89: Chart on US - Market size and forecast 2024-2029 ($ million)
- Exhibits90: Data Table on US - Market size and forecast 2024-2029 ($ million)
- Exhibits91: Chart on US - Year-over-year growth 2024-2029 (%)
- Exhibits92: Data Table on US - Year-over-year growth 2024-2029 (%)
- Exhibits93: Chart on UK - Market size and forecast 2024-2029 ($ million)
- Exhibits94: Data Table on UK - Market size and forecast 2024-2029 ($ million)
- Exhibits95: Chart on UK - Year-over-year growth 2024-2029 (%)
- Exhibits96: Data Table on UK - Year-over-year growth 2024-2029 (%)
- Exhibits97: Chart on Canada - Market size and forecast 2024-2029 ($ million)
- Exhibits98: Data Table on Canada - Market size and forecast 2024-2029 ($ million)
- Exhibits99: Chart on Canada - Year-over-year growth 2024-2029 (%)
- Exhibits100: Data Table on Canada - Year-over-year growth 2024-2029 (%)
- Exhibits101: Chart on Germany - Market size and forecast 2024-2029 ($ million)
- Exhibits102: Data Table on Germany - Market size and forecast 2024-2029 ($ million)
- Exhibits103: Chart on Germany - Year-over-year growth 2024-2029 (%)
- Exhibits104: Data Table on Germany - Year-over-year growth 2024-2029 (%)
- Exhibits105: Chart on India - Market size and forecast 2024-2029 ($ million)
- Exhibits106: Data Table on India - Market size and forecast 2024-2029 ($ million)
- Exhibits107: Chart on India - Year-over-year growth 2024-2029 (%)
- Exhibits108: Data Table on India - Year-over-year growth 2024-2029 (%)
- Exhibits109: Chart on China - Market size and forecast 2024-2029 ($ million)
- Exhibits110: Data Table on China - Market size and forecast 2024-2029 ($ million)
- Exhibits111: Chart on China - Year-over-year growth 2024-2029 (%)
- Exhibits112: Data Table on China - Year-over-year growth 2024-2029 (%)
- Exhibits113: Chart on France - Market size and forecast 2024-2029 ($ million)
- Exhibits114: Data Table on France - Market size and forecast 2024-2029 ($ million)
- Exhibits115: Chart on France - Year-over-year growth 2024-2029 (%)
- Exhibits116: Data Table on France - Year-over-year growth 2024-2029 (%)
- Exhibits117: Chart on Japan - Market size and forecast 2024-2029 ($ million)
- Exhibits118: Data Table on Japan - Market size and forecast 2024-2029 ($ million)
- Exhibits119: Chart on Japan - Year-over-year growth 2024-2029 (%)
- Exhibits120: Data Table on Japan - Year-over-year growth 2024-2029 (%)
- Exhibits121: Chart on Brazil - Market size and forecast 2024-2029 ($ million)
- Exhibits122: Data Table on Brazil - Market size and forecast 2024-2029 ($ million)
- Exhibits123: Chart on Brazil - Year-over-year growth 2024-2029 (%)
- Exhibits124: Data Table on Brazil - Year-over-year growth 2024-2029 (%)
- Exhibits125: Chart on UAE - Market size and forecast 2024-2029 ($ million)
- Exhibits126: Data Table on UAE - Market size and forecast 2024-2029 ($ million)
- Exhibits127: Chart on UAE - Year-over-year growth 2024-2029 (%)
- Exhibits128: Data Table on UAE - Year-over-year growth 2024-2029 (%)
- Exhibits129: Market opportunity By Geographical Landscape ($ million)
- Exhibits130: Data Tables on Market opportunity By Geographical Landscape ($ million)
- Exhibits131: Impact of drivers and challenges in 2024 and 2029
- Exhibits132: Overview on criticality of inputs and factors of differentiation
- Exhibits133: Overview on factors of disruption
- Exhibits134: Impact of key risks on business
- Exhibits135: Companies covered
- Exhibits136: Company ranking index
- Exhibits137: Matrix on companies position and classification
- Exhibits138: ABC Home and Commercial Services - Overview
- Exhibits139: ABC Home and Commercial Services - Product / Service
- Exhibits140: ABC Home and Commercial Services - Key offerings
- Exhibits141: SWOT
- Exhibits142: Anticimex International AB - Overview
- Exhibits143: Anticimex International AB - Business segments
- Exhibits144: Anticimex International AB - Key offerings
- Exhibits145: Anticimex International AB - Segment focus
- Exhibits146: SWOT
- Exhibits147: Arrow Exterminators Inc. - Overview
- Exhibits148: Arrow Exterminators Inc. - Product / Service
- Exhibits149: Arrow Exterminators Inc. - Key offerings
- Exhibits150: SWOT
- Exhibits151: Asante Co. Ltd. - Overview
- Exhibits152: Asante Co. Ltd. - Product / Service
- Exhibits153: Asante Co. Ltd. - Key offerings
- Exhibits154: SWOT
- Exhibits155: Cooks Pest Control Inc. - Overview
- Exhibits156: Cooks Pest Control Inc. - Product / Service
- Exhibits157: Cooks Pest Control Inc. - Key offerings
- Exhibits158: SWOT
- Exhibits159: Dodson Pest Control Inc. - Overview
- Exhibits160: Dodson Pest Control Inc. - Product / Service
- Exhibits161: Dodson Pest Control Inc. - Key offerings
- Exhibits162: SWOT
- Exhibits163: Ecolab Inc. - Overview
- Exhibits164: Ecolab Inc. - Business segments
- Exhibits165: Ecolab Inc. - Key news
- Exhibits166: Ecolab Inc. - Key offerings
- Exhibits167: Ecolab Inc. - Segment focus
- Exhibits168: SWOT
- Exhibits169: Green Pest Solutions - Overview
- Exhibits170: Green Pest Solutions - Product / Service
- Exhibits171: Green Pest Solutions - Key offerings
- Exhibits172: SWOT
- Exhibits173: Massey Services Inc. - Overview
- Exhibits174: Massey Services Inc. - Product / Service
- Exhibits175: Massey Services Inc. - Key offerings
- Exhibits176: SWOT
- Exhibits177: Pelsis Ltd. - Overview
- Exhibits178: Pelsis Ltd. - Product / Service
- Exhibits179: Pelsis Ltd. - Key offerings
- Exhibits180: SWOT
- Exhibits181: Rentokil Initial Plc - Overview
- Exhibits182: Rentokil Initial Plc - Business segments
- Exhibits183: Rentokil Initial Plc - Key offerings
- Exhibits184: Rentokil Initial Plc - Segment focus
- Exhibits185: SWOT
- Exhibits186: Rollins Inc. - Overview
- Exhibits187: Rollins Inc. - Product / Service
- Exhibits188: Rollins Inc. - Key offerings
- Exhibits189: SWOT
- Exhibits190: SANIX Inc. - Overview
- Exhibits191: SANIX Inc. - Business segments
- Exhibits192: SANIX Inc. - Key offerings
- Exhibits193: SANIX Inc. - Segment focus
- Exhibits194: SWOT
- Exhibits195: The ServiceMaster Co. LLC - Overview
- Exhibits196: The ServiceMaster Co. LLC - Product / Service
- Exhibits197: The ServiceMaster Co. LLC - Key offerings
- Exhibits198: SWOT
- Exhibits199: Truly Nolen of America Inc. - Overview
- Exhibits200: Truly Nolen of America Inc. - Product / Service
- Exhibits201: Truly Nolen of America Inc. - Key offerings
- Exhibits202: SWOT
- Exhibits203: Inclusions checklist
- Exhibits204: Exclusions checklist
- Exhibits205: Currency conversion rates for US$
- Exhibits206: Research methodology
- Exhibits207: Information sources
- Exhibits208: Data validation
- Exhibits209: Validation techniques employed for market sizing
- Exhibits210: Data synthesis
- Exhibits211: 360 degree market analysis
- Exhibits212: List of abbreviations
The pest control services market is forecasted to grow by USD 11857.5 mn during 2024-2029, accelerating at a CAGR of 7.6% during the forecast period. The report on the pest control services market provides a holistic analysis, market size and forecast, trends, growth drivers, and challenges, as well as vendor analysis covering around 25 vendors.
The report offers an up-to-date analysis regarding the current market scenario, the latest trends and drivers, and the overall market environment. The market is driven by increase in demand for insurance-based pest control services, growing hospitality, pharmaceutical, and food processing industries, and complexity of pest control procedures and safety protocols for chemicals used in pest control.
| Market Scope | |
|---|---|
| Base Year | 2025 |
| End Year | 2029 |
| Series Year | 2025-2029 |
| Growth Momentum | Accelerate |
| YOY 2025 | 6.6% |
| CAGR | 7.6% |
| Incremental Value | $11857.5 mn |
Technavio's pest control services market is segmented as below:
By Application
- General pest control
- Termite control
By End-user
- Residential
- Commercial
By Geographical Landscape
- North America
- Europe
- APAC
- South America
- Middle East and Africa
This study identifies the increase in deployment of digital pest control services as one of the prime reasons driving the pest control services market growth during the next few years. Also, growing popularity of gardening in developing nations and growing focus on adopting eco-friendly and green pest control will lead to sizable demand in the market.
The report on the pest control services market covers the following areas:
- Pest Control Services Market sizing
- Pest Control Services Market forecast
- Pest Control Services Market industry analysis
The robust vendor analysis is designed to help clients improve their market position, and in line with this, this report provides a detailed analysis of several leading pest control services market vendors that include ABC Home and Commercial Services, Anticimex International AB, Aptive Environmental LLC, Arrow Exterminators Inc., Asante Co. Ltd., Cooks Pest Control Inc., Dodson Pest Control Inc., Dynamic Sanito Inc., Ecolab Inc., Green Pest Solutions, Lloyd Pest Control, Massey Services Inc., Pelsis Ltd., Rentokil Initial Plc, Rollins Inc., SANIX Inc., Seva Pest Management Service Pvt. Ltd., Tech Hygiene Pest Control Pvt. Ltd., The ServiceMaster Co. LLC, and Truly Nolen of America Inc.. Also, the pest control services market analysis report includes information on upcoming trends and challenges that will influence market growth. This is to help companies strategize and leverage all forthcoming growth opportunities.
The study was conducted using an objective combination of primary and secondary information including inputs from key participants in the industry. The report contains a comprehensive market and vendor landscape in addition to an analysis of the key vendors.
The publisher presents a detailed picture of the market by the way of study, synthesis, and summation of data from multiple sources by an analysis of key parameters such as profit, pricing, competition, and promotions. It presents various market facets by identifying the key industry influencers. The data presented is comprehensive, reliable, and a result of extensive primary and secondary research. The market research reports provide a complete competitive landscape and an in-depth vendor selection methodology and analysis using qualitative and quantitative research to forecast accurate market growth.
Table of Contents
1 Executive Summary
- 1.1 Market overview
- Executive Summary - Chart on Market Overview
- Executive Summary - Data Table on Market Overview
- Executive Summary - Chart on Global Market Characteristics
- Executive Summary - Chart on Market By Geographical Landscape
- Executive Summary - Chart on Market Segmentation by Application
- Executive Summary - Chart on Market Segmentation by End-user
- Executive Summary - Chart on Incremental Growth
- Executive Summary - Data Table on Incremental Growth
- Executive Summary - Chart on Company Market Positioning
2 Technavio Analysis
- 2.1 Analysis of price sensitivity, lifecycle, customer purchase basket, adoption rates, and purchase criteria
- Analysis of price sensitivity, lifecycle, customer purchase basket, adoption rates, and purchase criteria
- 2.2 Criticality of inputs and Factors of differentiation
- Overview on criticality of inputs and factors of differentiation
- 2.3 Factors of disruption
- Overview on factors of disruption
- 2.4 Impact of drivers and challenges
- Impact of drivers and challenges in 2024 and 2029
3 Market Landscape
- 3.1 Market ecosystem
- Parent Market
- Data Table on - Parent Market
- 3.2 Market characteristics
- Market characteristics analysis
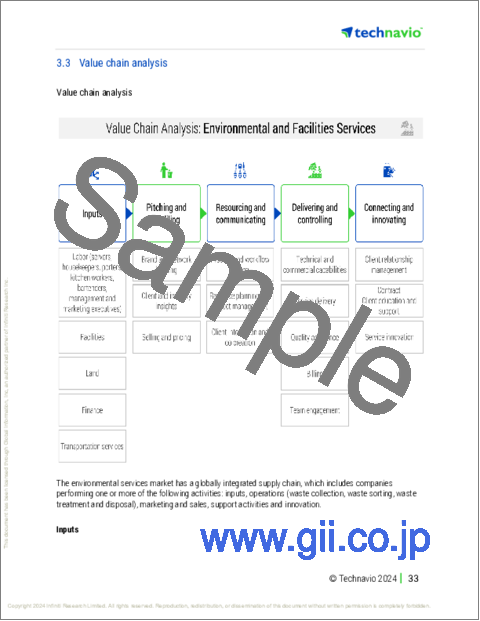
- 3.3 Value chain analysis
- Value chain analysis
4 Market Sizing
- 4.1 Market definition
- Offerings of companies included in the market definition
- 4.2 Market segment analysis
- Market segments
- 4.3 Market size 2024
- 4.4 Market outlook: Forecast for 2024-2029
- Chart on Global - Market size and forecast 2024-2029 ($ million)
- Data Table on Global - Market size and forecast 2024-2029 ($ million)
- Chart on Global Market: Year-over-year growth 2024-2029 (%)
- Data Table on Global Market: Year-over-year growth 2024-2029 (%)
5 Historic Market Size
- 5.1 Global Pest Control Services Market 2019 - 2023
- Historic Market Size - Data Table on Global Pest Control Services Market 2019 - 2023 ($ million)
- 5.2 Application segment analysis 2019 - 2023
- Historic Market Size - Application Segment 2019 - 2023 ($ million)
- 5.3 End-user segment analysis 2019 - 2023
- Historic Market Size - End-user Segment 2019 - 2023 ($ million)
- 5.4 Geography segment analysis 2019 - 2023
- Historic Market Size - Geography Segment 2019 - 2023 ($ million)
- 5.5 Country segment analysis 2019 - 2023
- Historic Market Size - Country Segment 2019 - 2023 ($ million)
6 Qualitative Analysis
- 6.1 The AI impact on Global Pest Control Services Market
7 Five Forces Analysis
- 7.1 Five forces summary
- Five forces analysis - Comparison between 2024 and 2029
- 7.2 Bargaining power of buyers
- Bargaining power of buyers - Impact of key factors 2024 and 2029
- 7.3 Bargaining power of suppliers
- Bargaining power of suppliers - Impact of key factors in 2024 and 2029
- 7.4 Threat of new entrants
- Threat of new entrants - Impact of key factors in 2024 and 2029
- 7.5 Threat of substitutes
- Threat of substitutes - Impact of key factors in 2024 and 2029
- 7.6 Threat of rivalry
- Threat of rivalry - Impact of key factors in 2024 and 2029
- 7.7 Market condition
- Chart on Market condition - Five forces 2024 and 2029
8 Market Segmentation by Application
- 8.1 Market segments
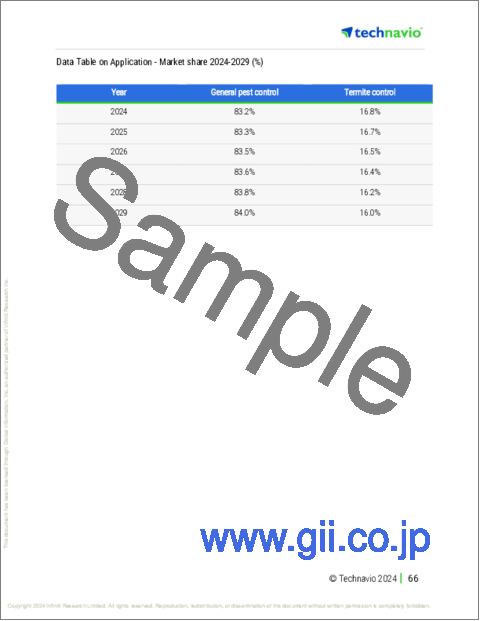
- Chart on Application - Market share 2024-2029 (%)
- Data Table on Application - Market share 2024-2029 (%)
- 8.2 Comparison by Application
- Chart on Comparison by Application
- Data Table on Comparison by Application
- 8.3 General pest control - Market size and forecast 2024-2029
- Chart on General pest control - Market size and forecast 2024-2029 ($ million)
- Data Table on General pest control - Market size and forecast 2024-2029 ($ million)
- Chart on General pest control - Year-over-year growth 2024-2029 (%)
- Data Table on General pest control - Year-over-year growth 2024-2029 (%)
- 8.4 Termite control - Market size and forecast 2024-2029
- Chart on Termite control - Market size and forecast 2024-2029 ($ million)
- Data Table on Termite control - Market size and forecast 2024-2029 ($ million)
- Chart on Termite control - Year-over-year growth 2024-2029 (%)
- Data Table on Termite control - Year-over-year growth 2024-2029 (%)
- 8.5 Market opportunity by Application
- Market opportunity by Application ($ million)
- Data Table on Market opportunity by Application ($ million)
9 Market Segmentation by End-user
- 9.1 Market segments
- Chart on End-user - Market share 2024-2029 (%)
- Data Table on End-user - Market share 2024-2029 (%)
- 9.2 Comparison by End-user
- Chart on Comparison by End-user
- Data Table on Comparison by End-user
- 9.3 Residential - Market size and forecast 2024-2029
- Chart on Residential - Market size and forecast 2024-2029 ($ million)
- Data Table on Residential - Market size and forecast 2024-2029 ($ million)
- Chart on Residential - Year-over-year growth 2024-2029 (%)
- Data Table on Residential - Year-over-year growth 2024-2029 (%)
- 9.4 Commercial - Market size and forecast 2024-2029
- Chart on Commercial - Market size and forecast 2024-2029 ($ million)
- Data Table on Commercial - Market size and forecast 2024-2029 ($ million)
- Chart on Commercial - Year-over-year growth 2024-2029 (%)
- Data Table on Commercial - Year-over-year growth 2024-2029 (%)
- 9.5 Market opportunity by End-user
- Market opportunity by End-user ($ million)
- Data Table on Market opportunity by End-user ($ million)
10 Customer Landscape
- 10.1 Customer landscape overview
- Analysis of price sensitivity, lifecycle, customer purchase basket, adoption rates, and purchase criteria
11 Geographic Landscape
- 11.1 Geographic segmentation
- Chart on Market share By Geographical Landscape 2024-2029 (%)
- Data Table on Market share By Geographical Landscape 2024-2029 (%)
- 11.2 Geographic comparison
- Chart on Geographic comparison
- Data Table on Geographic comparison
- 11.3 North America - Market size and forecast 2024-2029
- Chart on North America - Market size and forecast 2024-2029 ($ million)
- Data Table on North America - Market size and forecast 2024-2029 ($ million)
- Chart on North America - Year-over-year growth 2024-2029 (%)
- Data Table on North America - Year-over-year growth 2024-2029 (%)
- 11.4 Europe - Market size and forecast 2024-2029
- Chart on Europe - Market size and forecast 2024-2029 ($ million)
- Data Table on Europe - Market size and forecast 2024-2029 ($ million)
- Chart on Europe - Year-over-year growth 2024-2029 (%)
- Data Table on Europe - Year-over-year growth 2024-2029 (%)
- 11.5 APAC - Market size and forecast 2024-2029
- Chart on APAC - Market size and forecast 2024-2029 ($ million)
- Data Table on APAC - Market size and forecast 2024-2029 ($ million)
- Chart on APAC - Year-over-year growth 2024-2029 (%)
- Data Table on APAC - Year-over-year growth 2024-2029 (%)
- 11.6 South America - Market size and forecast 2024-2029
- Chart on South America - Market size and forecast 2024-2029 ($ million)
- Data Table on South America - Market size and forecast 2024-2029 ($ million)
- Chart on South America - Year-over-year growth 2024-2029 (%)
- Data Table on South America - Year-over-year growth 2024-2029 (%)
- 11.7 Middle East and Africa - Market size and forecast 2024-2029
- Chart on Middle East and Africa - Market size and forecast 2024-2029 ($ million)
- Data Table on Middle East and Africa - Market size and forecast 2024-2029 ($ million)
- Chart on Middle East and Africa - Year-over-year growth 2024-2029 (%)
- Data Table on Middle East and Africa - Year-over-year growth 2024-2029 (%)
- 11.8 US - Market size and forecast 2024-2029
- Chart on US - Market size and forecast 2024-2029 ($ million)
- Data Table on US - Market size and forecast 2024-2029 ($ million)
- Chart on US - Year-over-year growth 2024-2029 (%)
- Data Table on US - Year-over-year growth 2024-2029 (%)
- 11.9 UK - Market size and forecast 2024-2029
- Chart on UK - Market size and forecast 2024-2029 ($ million)
- Data Table on UK - Market size and forecast 2024-2029 ($ million)
- Chart on UK - Year-over-year growth 2024-2029 (%)
- Data Table on UK - Year-over-year growth 2024-2029 (%)
- 11.10 Canada - Market size and forecast 2024-2029
- Chart on Canada - Market size and forecast 2024-2029 ($ million)
- Data Table on Canada - Market size and forecast 2024-2029 ($ million)
- Chart on Canada - Year-over-year growth 2024-2029 (%)
- Data Table on Canada - Year-over-year growth 2024-2029 (%)
- 11.11 Germany - Market size and forecast 2024-2029
- Chart on Germany - Market size and forecast 2024-2029 ($ million)
- Data Table on Germany - Market size and forecast 2024-2029 ($ million)
- Chart on Germany - Year-over-year growth 2024-2029 (%)
- Data Table on Germany - Year-over-year growth 2024-2029 (%)
- 11.12 India - Market size and forecast 2024-2029
- Chart on India - Market size and forecast 2024-2029 ($ million)
- Data Table on India - Market size and forecast 2024-2029 ($ million)
- Chart on India - Year-over-year growth 2024-2029 (%)
- Data Table on India - Year-over-year growth 2024-2029 (%)
- 11.13 China - Market size and forecast 2024-2029
- Chart on China - Market size and forecast 2024-2029 ($ million)
- Data Table on China - Market size and forecast 2024-2029 ($ million)
- Chart on China - Year-over-year growth 2024-2029 (%)
- Data Table on China - Year-over-year growth 2024-2029 (%)
- 11.14 France - Market size and forecast 2024-2029
- Chart on France - Market size and forecast 2024-2029 ($ million)
- Data Table on France - Market size and forecast 2024-2029 ($ million)
- Chart on France - Year-over-year growth 2024-2029 (%)
- Data Table on France - Year-over-year growth 2024-2029 (%)
- 11.15 Japan - Market size and forecast 2024-2029
- Chart on Japan - Market size and forecast 2024-2029 ($ million)
- Data Table on Japan - Market size and forecast 2024-2029 ($ million)
- Chart on Japan - Year-over-year growth 2024-2029 (%)
- Data Table on Japan - Year-over-year growth 2024-2029 (%)
- 11.16 Brazil - Market size and forecast 2024-2029
- Chart on Brazil - Market size and forecast 2024-2029 ($ million)
- Data Table on Brazil - Market size and forecast 2024-2029 ($ million)
- Chart on Brazil - Year-over-year growth 2024-2029 (%)
- Data Table on Brazil - Year-over-year growth 2024-2029 (%)
- 11.17 UAE - Market size and forecast 2024-2029
- Chart on UAE - Market size and forecast 2024-2029 ($ million)
- Data Table on UAE - Market size and forecast 2024-2029 ($ million)
- Chart on UAE - Year-over-year growth 2024-2029 (%)
- Data Table on UAE - Year-over-year growth 2024-2029 (%)
- 11.18 Market opportunity By Geographical Landscape
- Market opportunity By Geographical Landscape ($ million)
- Data Tables on Market opportunity By Geographical Landscape ($ million)
12 Drivers, Challenges, and Opportunity/Restraints
- 12.1 Market drivers
- 12.2 Market challenges
- 12.3 Impact of drivers and challenges
- Impact of drivers and challenges in 2024 and 2029
- 12.4 Market opportunities/restraints
13 Competitive Landscape
- 13.1 Overview
- 13.2 Competitive Landscape
- Overview on criticality of inputs and factors of differentiation
- 13.3 Landscape disruption
- Overview on factors of disruption
- 13.4 Industry risks
- Impact of key risks on business
14 Competitive Analysis
- 14.1 Companies profiled
- Companies covered
- 14.2 Company ranking index
- Company ranking index
- 14.3 Market positioning of companies
- Matrix on companies position and classification
- 14.4 ABC Home and Commercial Services
- ABC Home and Commercial Services - Overview
- ABC Home and Commercial Services - Product / Service
- ABC Home and Commercial Services - Key offerings
- SWOT
- 14.5 Anticimex International AB
- Anticimex International AB - Overview
- Anticimex International AB - Business segments
- Anticimex International AB - Key offerings
- Anticimex International AB - Segment focus
- SWOT
- 14.6 Arrow Exterminators Inc.
- Arrow Exterminators Inc. - Overview
- Arrow Exterminators Inc. - Product / Service
- Arrow Exterminators Inc. - Key offerings
- SWOT
- 14.7 Asante Co. Ltd.
- Asante Co. Ltd. - Overview
- Asante Co. Ltd. - Product / Service
- Asante Co. Ltd. - Key offerings
- SWOT
- 14.8 Cooks Pest Control Inc.
- Cooks Pest Control Inc. - Overview
- Cooks Pest Control Inc. - Product / Service
- Cooks Pest Control Inc. - Key offerings
- SWOT
- 14.9 Dodson Pest Control Inc.
- Dodson Pest Control Inc. - Overview
- Dodson Pest Control Inc. - Product / Service
- Dodson Pest Control Inc. - Key offerings
- SWOT
- 14.10 Ecolab Inc.
- Ecolab Inc. - Overview
- Ecolab Inc. - Business segments
- Ecolab Inc. - Key news
- Ecolab Inc. - Key offerings
- Ecolab Inc. - Segment focus
- SWOT
- 14.11 Green Pest Solutions
- Green Pest Solutions - Overview
- Green Pest Solutions - Product / Service
- Green Pest Solutions - Key offerings
- SWOT
- 14.12 Massey Services Inc.
- Massey Services Inc. - Overview
- Massey Services Inc. - Product / Service
- Massey Services Inc. - Key offerings
- SWOT
- 14.13 Pelsis Ltd.
- Pelsis Ltd. - Overview
- Pelsis Ltd. - Product / Service
- Pelsis Ltd. - Key offerings
- SWOT
- 14.14 Rentokil Initial Plc
- Rentokil Initial Plc - Overview
- Rentokil Initial Plc - Business segments
- Rentokil Initial Plc - Key offerings
- Rentokil Initial Plc - Segment focus
- SWOT
- 14.15 Rollins Inc.
- Rollins Inc. - Overview
- Rollins Inc. - Product / Service
- Rollins Inc. - Key offerings
- SWOT
- 14.16 SANIX Inc.
- SANIX Inc. - Overview
- SANIX Inc. - Business segments
- SANIX Inc. - Key offerings
- SANIX Inc. - Segment focus
- SWOT
- 14.17 The ServiceMaster Co. LLC
- The ServiceMaster Co. LLC - Overview
- The ServiceMaster Co. LLC - Product / Service
- The ServiceMaster Co. LLC - Key offerings
- SWOT
- 14.18 Truly Nolen of America Inc.
- Truly Nolen of America Inc. - Overview
- Truly Nolen of America Inc. - Product / Service
- Truly Nolen of America Inc. - Key offerings
- SWOT
15 Appendix
- 15.1 Scope of the report
- 15.2 Inclusions and exclusions checklist
- Inclusions checklist
- Exclusions checklist
- 15.3 Currency conversion rates for US$
- Currency conversion rates for US$
- 15.4 Research methodology
- Research methodology
- 15.5 Data procurement
- Information sources
- 15.6 Data validation
- Data validation
- 15.7 Validation techniques employed for market sizing
- Validation techniques employed for market sizing
- 15.8 Data synthesis
- Data synthesis
- 15.9 360 degree market analysis
- 360 degree market analysis
- 15.10 List of abbreviations
- List of abbreviations

