|
|
市場調査レポート
商品コード
1634383
暗号通貨の世界市場(2025年~2029年)Global Cryptocurrency Market 2025-2029 |
||||||

|
|||||||
カスタマイズ可能
|
|||||||

| 暗号通貨の世界市場(2025年~2029年) |
|
出版日: 2025年01月07日
発行: TechNavio
ページ情報: 英文 198 Pages
納期: 即納可能
|

全表示
- 概要
- 図表
- 目次
暗号通貨市場(2025年~2029年)
暗号通貨市場は2024年~2029年に397億4,940万米ドル、予測期間中のCAGRは16.7%で成長すると予測されます。当レポートでは、暗号通貨市場の全体的な分析、市場規模・予測、動向、成長促進要因、課題、約25のベンダーを網羅したベンダー分析などを掲載しています。
現在の市場シナリオ、最新動向と促進要因、市場環境全体に関する最新分析を提供しています。市場は、デジタル資産への投資の増加、暗号ウォレットの利用可能性の増加、フィンテック支出の増加によって牽引されています。
| 市場範囲 | |
|---|---|
| 基準年 | 2025年 |
| 終了年 | 2029年 |
| 予測期間 | 2025年~2029年 |
| 成長モメンタム | 加速 |
| 前年比2025年 | 15.3% |
| CAGR | 16.7% |
| 増分額 | 397億4,940万米ドル |
本調査では、小売業者による暗号通貨の受け入れが、今後数年間の暗号通貨市場の成長を促進する主な理由の1つであると特定しています。また、デジタル通貨への傾斜の高まりとブロックチェーン技術の成長は、市場の大きな需要につながります。
目次
第1章 エグゼクティブサマリー
- 市場概要
第2章 Technavioによる分析
- 価格・ライフサイクル・顧客購入バスケット・採用率・購入基準の分析
- インプットの重要性と差別化の要因
- 混乱の要因
- 促進要因と課題の影響
第3章 市場情勢
- 市場エコシステム
- 市場の特徴
- バリューチェーン分析
第4章 市場規模
- 市場の定義
- 市場セグメント分析
- 市場規模(2024年)
- 市場の見通し(2024年~2029年)
第5章 市場規模実績
- 暗号通貨の世界市場(2019年~2023年)
- タイプセグメント分析(2019年~2023年)
- 部品セグメント分析(2019年~2023年)
- 地域別セグメント分析(2019年~2023年)
- 国別セグメント分析(2019年~2023年)
第6章 定性分析
- AIの影響:暗号通貨の世界市場
第7章 ファイブフォース分析
- ファイブフォースの要約
- 買い手の交渉力
- 供給企業の交渉力
- 新規参入業者の脅威
- 代替品の脅威
- 競争の脅威
- 市況
第8章 市場セグメンテーション:タイプ別
- 市場セグメント
- 比較:タイプ別
- ビットコイン:市場規模と予測(2024年~2029年)
- イーサリアム:市場規模と予測(2024年~2029年)
- その他:市場規模と予測(2024年~2029年)
- 市場機会:タイプ別
第9章 市場セグメンテーション:コンポーネント別
- 市場セグメント
- 比較:コンポーネント別
- ハードウェア:市場規模と予測(2024年~2029年)
- ソフトウェア:市場規模と予測(2024年~2029年)
- 市場機会:コンポーネント別
第10章 顧客情勢
- 顧客情勢の概要
第11章 地域別情勢
- 地域別セグメンテーション
- 地域別比較
- 北米:市場規模と予測(2024年~2029年)
- 欧州:市場規模と予測(2024年~2029年)
- アジア太平洋:市場規模と予測(2024年~2029年)
- 南米:市場規模と予測(2024年~2029年)
- 中東・アフリカ:市場規模と予測(2024年~2029年)
- 米国:市場規模と予測(2024年~2029年)
- 英国:市場規模と予測(2024年~2029年)
- ドイツ:市場規模と予測(2024年~2029年)
- 中国:市場規模と予測(2024年~2029年)
- スイス:市場規模と予測(2024年~2029年)
- ブラジル:市場規模と予測(2024年~2029年)
- カナダ:市場規模と予測(2024年~2029年)
- 日本:市場規模と予測(2024年~2029年)
- イタリア:市場規模と予測(2024年~2029年)
- オランダ:市場規模と予測(2024年~2029年)
- 市場機会:地域情勢別
第12章 促進要因・課題・機会・抑制要因
- 市場促進要因
- 市場の課題
- 促進要因と課題の影響
- 市場の機会・抑制要因
第13章 競合情勢
- 概要
- 競合情勢
- 混乱の状況
- 業界のリスク
第14章 競合分析
- 企業プロファイル
- 企業ランキング指数
- 企業の市場ポジショニング
- AlphaPoint Corp.
- Binance Holdings Ltd.
- Bit2Me
- Cardano
- CEX.IO Corp.
- Coinbase Global Inc.
- DOGECOIN
- KuCoin
- Ledger SAS
- Marathon Digital Holdings
- Riot Platforms Inc.
- Shiba Inu
- Valora Inc.
- WazirX
- Xapo Bank Ltd.
第15章 付録
Exhibits:
- Exhibits1: Executive Summary - Chart on Market Overview
- Exhibits2: Executive Summary - Data Table on Market Overview
- Exhibits3: Executive Summary - Chart on Global Market Characteristics
- Exhibits4: Executive Summary - Chart on Market By Geographical Landscape
- Exhibits5: Executive Summary - Chart on Market Segmentation by Type
- Exhibits6: Executive Summary - Chart on Market Segmentation by Component
- Exhibits7: Executive Summary - Chart on Incremental Growth
- Exhibits8: Executive Summary - Data Table on Incremental Growth
- Exhibits9: Executive Summary - Chart on Company Market Positioning
- Exhibits10: Analysis of price sensitivity, lifecycle, customer purchase basket, adoption rates, and purchase criteria
- Exhibits11: Overview on criticality of inputs and factors of differentiation
- Exhibits12: Overview on factors of disruption
- Exhibits13: Impact of drivers and challenges in 2024 and 2029
- Exhibits14: Parent Market
- Exhibits15: Data Table on - Parent Market
- Exhibits16: Market characteristics analysis
- Exhibits17: Value chain analysis
- Exhibits18: Offerings of companies included in the market definition
- Exhibits19: Market segments
- Exhibits20: Chart on Global - Market size and forecast 2024-2029 ($ million)
- Exhibits21: Data Table on Global - Market size and forecast 2024-2029 ($ million)
- Exhibits22: Chart on Global Market: Year-over-year growth 2024-2029 (%)
- Exhibits23: Data Table on Global Market: Year-over-year growth 2024-2029 (%)
- Exhibits24: Historic Market Size - Data Table on Global Cryptocurrency Market 2019 - 2023 ($ million)
- Exhibits25: Historic Market Size - Type Segment 2019 - 2023 ($ million)
- Exhibits26: Historic Market Size - Component Segment 2019 - 2023 ($ million)
- Exhibits27: Historic Market Size - Geography Segment 2019 - 2023 ($ million)
- Exhibits28: Historic Market Size - Country Segment 2019 - 2023 ($ million)
- Exhibits29: Five forces analysis - Comparison between 2024 and 2029
- Exhibits30: Bargaining power of buyers - Impact of key factors 2024 and 2029
- Exhibits31: Bargaining power of suppliers - Impact of key factors in 2024 and 2029
- Exhibits32: Threat of new entrants - Impact of key factors in 2024 and 2029
- Exhibits33: Threat of substitutes - Impact of key factors in 2024 and 2029
- Exhibits34: Threat of rivalry - Impact of key factors in 2024 and 2029
- Exhibits35: Chart on Market condition - Five forces 2024 and 2029
- Exhibits36: Chart on Type - Market share 2024-2029 (%)
- Exhibits37: Data Table on Type - Market share 2024-2029 (%)
- Exhibits38: Chart on Comparison by Type
- Exhibits39: Data Table on Comparison by Type
- Exhibits40: Chart on Bitcoin - Market size and forecast 2024-2029 ($ million)
- Exhibits41: Data Table on Bitcoin - Market size and forecast 2024-2029 ($ million)
- Exhibits42: Chart on Bitcoin - Year-over-year growth 2024-2029 (%)
- Exhibits43: Data Table on Bitcoin - Year-over-year growth 2024-2029 (%)
- Exhibits44: Chart on Ethereum - Market size and forecast 2024-2029 ($ million)
- Exhibits45: Data Table on Ethereum - Market size and forecast 2024-2029 ($ million)
- Exhibits46: Chart on Ethereum - Year-over-year growth 2024-2029 (%)
- Exhibits47: Data Table on Ethereum - Year-over-year growth 2024-2029 (%)
- Exhibits48: Chart on Others - Market size and forecast 2024-2029 ($ million)
- Exhibits49: Data Table on Others - Market size and forecast 2024-2029 ($ million)
- Exhibits50: Chart on Others - Year-over-year growth 2024-2029 (%)
- Exhibits51: Data Table on Others - Year-over-year growth 2024-2029 (%)
- Exhibits52: Market opportunity by Type ($ million)
- Exhibits53: Data Table on Market opportunity by Type ($ million)
- Exhibits54: Chart on Component - Market share 2024-2029 (%)
- Exhibits55: Data Table on Component - Market share 2024-2029 (%)
- Exhibits56: Chart on Comparison by Component
- Exhibits57: Data Table on Comparison by Component
- Exhibits58: Chart on Hardware - Market size and forecast 2024-2029 ($ million)
- Exhibits59: Data Table on Hardware - Market size and forecast 2024-2029 ($ million)
- Exhibits60: Chart on Hardware - Year-over-year growth 2024-2029 (%)
- Exhibits61: Data Table on Hardware - Year-over-year growth 2024-2029 (%)
- Exhibits62: Chart on Software - Market size and forecast 2024-2029 ($ million)
- Exhibits63: Data Table on Software - Market size and forecast 2024-2029 ($ million)
- Exhibits64: Chart on Software - Year-over-year growth 2024-2029 (%)
- Exhibits65: Data Table on Software - Year-over-year growth 2024-2029 (%)
- Exhibits66: Market opportunity by Component ($ million)
- Exhibits67: Data Table on Market opportunity by Component ($ million)
- Exhibits68: Analysis of price sensitivity, lifecycle, customer purchase basket, adoption rates, and purchase criteria
- Exhibits69: Chart on Market share By Geographical Landscape 2024-2029 (%)
- Exhibits70: Data Table on Market share By Geographical Landscape 2024-2029 (%)
- Exhibits71: Chart on Geographic comparison
- Exhibits72: Data Table on Geographic comparison
- Exhibits73: Chart on North America - Market size and forecast 2024-2029 ($ million)
- Exhibits74: Data Table on North America - Market size and forecast 2024-2029 ($ million)
- Exhibits75: Chart on North America - Year-over-year growth 2024-2029 (%)
- Exhibits76: Data Table on North America - Year-over-year growth 2024-2029 (%)
- Exhibits77: Chart on Europe - Market size and forecast 2024-2029 ($ million)
- Exhibits78: Data Table on Europe - Market size and forecast 2024-2029 ($ million)
- Exhibits79: Chart on Europe - Year-over-year growth 2024-2029 (%)
- Exhibits80: Data Table on Europe - Year-over-year growth 2024-2029 (%)
- Exhibits81: Chart on APAC - Market size and forecast 2024-2029 ($ million)
- Exhibits82: Data Table on APAC - Market size and forecast 2024-2029 ($ million)
- Exhibits83: Chart on APAC - Year-over-year growth 2024-2029 (%)
- Exhibits84: Data Table on APAC - Year-over-year growth 2024-2029 (%)
- Exhibits85: Chart on South America - Market size and forecast 2024-2029 ($ million)
- Exhibits86: Data Table on South America - Market size and forecast 2024-2029 ($ million)
- Exhibits87: Chart on South America - Year-over-year growth 2024-2029 (%)
- Exhibits88: Data Table on South America - Year-over-year growth 2024-2029 (%)
- Exhibits89: Chart on Middle East and Africa - Market size and forecast 2024-2029 ($ million)
- Exhibits90: Data Table on Middle East and Africa - Market size and forecast 2024-2029 ($ million)
- Exhibits91: Chart on Middle East and Africa - Year-over-year growth 2024-2029 (%)
- Exhibits92: Data Table on Middle East and Africa - Year-over-year growth 2024-2029 (%)
- Exhibits93: Chart on US - Market size and forecast 2024-2029 ($ million)
- Exhibits94: Data Table on US - Market size and forecast 2024-2029 ($ million)
- Exhibits95: Chart on US - Year-over-year growth 2024-2029 (%)
- Exhibits96: Data Table on US - Year-over-year growth 2024-2029 (%)
- Exhibits97: Chart on UK - Market size and forecast 2024-2029 ($ million)
- Exhibits98: Data Table on UK - Market size and forecast 2024-2029 ($ million)
- Exhibits99: Chart on UK - Year-over-year growth 2024-2029 (%)
- Exhibits100: Data Table on UK - Year-over-year growth 2024-2029 (%)
- Exhibits101: Chart on Germany - Market size and forecast 2024-2029 ($ million)
- Exhibits102: Data Table on Germany - Market size and forecast 2024-2029 ($ million)
- Exhibits103: Chart on Germany - Year-over-year growth 2024-2029 (%)
- Exhibits104: Data Table on Germany - Year-over-year growth 2024-2029 (%)
- Exhibits105: Chart on China - Market size and forecast 2024-2029 ($ million)
- Exhibits106: Data Table on China - Market size and forecast 2024-2029 ($ million)
- Exhibits107: Chart on China - Year-over-year growth 2024-2029 (%)
- Exhibits108: Data Table on China - Year-over-year growth 2024-2029 (%)
- Exhibits109: Chart on Switzerland - Market size and forecast 2024-2029 ($ million)
- Exhibits110: Data Table on Switzerland - Market size and forecast 2024-2029 ($ million)
- Exhibits111: Chart on Switzerland - Year-over-year growth 2024-2029 (%)
- Exhibits112: Data Table on Switzerland - Year-over-year growth 2024-2029 (%)
- Exhibits113: Chart on Brazil - Market size and forecast 2024-2029 ($ million)
- Exhibits114: Data Table on Brazil - Market size and forecast 2024-2029 ($ million)
- Exhibits115: Chart on Brazil - Year-over-year growth 2024-2029 (%)
- Exhibits116: Data Table on Brazil - Year-over-year growth 2024-2029 (%)
- Exhibits117: Chart on Canada - Market size and forecast 2024-2029 ($ million)
- Exhibits118: Data Table on Canada - Market size and forecast 2024-2029 ($ million)
- Exhibits119: Chart on Canada - Year-over-year growth 2024-2029 (%)
- Exhibits120: Data Table on Canada - Year-over-year growth 2024-2029 (%)
- Exhibits121: Chart on Japan - Market size and forecast 2024-2029 ($ million)
- Exhibits122: Data Table on Japan - Market size and forecast 2024-2029 ($ million)
- Exhibits123: Chart on Japan - Year-over-year growth 2024-2029 (%)
- Exhibits124: Data Table on Japan - Year-over-year growth 2024-2029 (%)
- Exhibits125: Chart on Italy - Market size and forecast 2024-2029 ($ million)
- Exhibits126: Data Table on Italy - Market size and forecast 2024-2029 ($ million)
- Exhibits127: Chart on Italy - Year-over-year growth 2024-2029 (%)
- Exhibits128: Data Table on Italy - Year-over-year growth 2024-2029 (%)
- Exhibits129: Chart on The Netherlands - Market size and forecast 2024-2029 ($ million)
- Exhibits130: Data Table on The Netherlands - Market size and forecast 2024-2029 ($ million)
- Exhibits131: Chart on The Netherlands - Year-over-year growth 2024-2029 (%)
- Exhibits132: Data Table on The Netherlands - Year-over-year growth 2024-2029 (%)
- Exhibits133: Market opportunity By Geographical Landscape ($ million)
- Exhibits134: Data Tables on Market opportunity By Geographical Landscape ($ million)
- Exhibits135: Impact of drivers and challenges in 2024 and 2029
- Exhibits136: Overview on criticality of inputs and factors of differentiation
- Exhibits137: Overview on factors of disruption
- Exhibits138: Impact of key risks on business
- Exhibits139: Companies covered
- Exhibits140: Company ranking index
- Exhibits141: Matrix on companies position and classification
- Exhibits142: AlphaPoint Corp. - Overview
- Exhibits143: AlphaPoint Corp. - Product / Service
- Exhibits144: AlphaPoint Corp. - Key offerings
- Exhibits145: SWOT
- Exhibits146: Binance Holdings Ltd. - Overview
- Exhibits147: Binance Holdings Ltd. - Product / Service
- Exhibits148: Binance Holdings Ltd. - Key offerings
- Exhibits149: SWOT
- Exhibits150: Bit2Me - Overview
- Exhibits151: Bit2Me - Product / Service
- Exhibits152: Bit2Me - Key offerings
- Exhibits153: SWOT
- Exhibits154: Cardano - Overview
- Exhibits155: Cardano - Product / Service
- Exhibits156: Cardano - Key offerings
- Exhibits157: SWOT
- Exhibits158: CEX.IO Corp. - Overview
- Exhibits159: CEX.IO Corp. - Product / Service
- Exhibits160: CEX.IO Corp. - Key offerings
- Exhibits161: SWOT
- Exhibits162: Coinbase Global Inc. - Overview
- Exhibits163: Coinbase Global Inc. - Product / Service
- Exhibits164: Coinbase Global Inc. - Key offerings
- Exhibits165: SWOT
- Exhibits166: DOGECOIN - Overview
- Exhibits167: DOGECOIN - Product / Service
- Exhibits168: DOGECOIN - Key offerings
- Exhibits169: SWOT
- Exhibits170: KuCoin - Overview
- Exhibits171: KuCoin - Product / Service
- Exhibits172: KuCoin - Key offerings
- Exhibits173: SWOT
- Exhibits174: Ledger SAS - Overview
- Exhibits175: Ledger SAS - Product / Service
- Exhibits176: Ledger SAS - Key offerings
- Exhibits177: SWOT
- Exhibits178: Marathon Digital Holdings - Overview
- Exhibits179: Marathon Digital Holdings - Product / Service
- Exhibits180: Marathon Digital Holdings - Key offerings
- Exhibits181: SWOT
- Exhibits182: Riot Platforms Inc. - Overview
- Exhibits183: Riot Platforms Inc. - Product / Service
- Exhibits184: Riot Platforms Inc. - Key offerings
- Exhibits185: SWOT
- Exhibits186: Shiba Inu - Overview
- Exhibits187: Shiba Inu - Product / Service
- Exhibits188: Shiba Inu - Key offerings
- Exhibits189: SWOT
- Exhibits190: Valora Inc. - Overview
- Exhibits191: Valora Inc. - Product / Service
- Exhibits192: Valora Inc. - Key offerings
- Exhibits193: SWOT
- Exhibits194: WazirX - Overview
- Exhibits195: WazirX - Product / Service
- Exhibits196: WazirX - Key offerings
- Exhibits197: SWOT
- Exhibits198: Xapo Bank Ltd. - Overview
- Exhibits199: Xapo Bank Ltd. - Product / Service
- Exhibits200: Xapo Bank Ltd. - Key offerings
- Exhibits201: SWOT
- Exhibits202: Inclusions checklist
- Exhibits203: Exclusions checklist
- Exhibits204: Currency conversion rates for US$
- Exhibits205: Research methodology
- Exhibits206: Information sources
- Exhibits207: Data validation
- Exhibits208: Validation techniques employed for market sizing
- Exhibits209: Data synthesis
- Exhibits210: 360 degree market analysis
- Exhibits211: List of abbreviations
Cryptocurrency Market 2025-2029
The cryptocurrency market is forecasted to grow by USD 39749.4 mn during 2024-2029, accelerating at a CAGR of 16.7% during the forecast period. The report on the cryptocurrency market provides a holistic analysis, market size and forecast, trends, growth drivers, and challenges, as well as vendor analysis covering around 25 vendors.
The report offers an up-to-date analysis regarding the current market scenario, the latest trends and drivers, and the overall market environment. The market is driven by rising investment in digital assets, increased availability of crypto wallets, and increase in fintech spending.
| Market Scope | |
|---|---|
| Base Year | 2025 |
| End Year | 2029 |
| Series Year | 2025-2029 |
| Growth Momentum | Accelerate |
| YOY 2025 | 15.3% |
| CAGR | 16.7% |
| Incremental Value | $39749.4 mn |
Technavio's cryptocurrency market is segmented as below:
By Type
- Bitcoin
- Ethereum
- Others
By Component
- Hardware
- Software
By Geographical Landscape
- North America
- Europe
- APAC
- South America
- Middle East and Africa
This study identifies the acceptance of cryptocurrency by retailers as one of the prime reasons driving the cryptocurrency market growth during the next few years. Also, rising inclination toward digital currency and growth of blockchain technology will lead to sizable demand in the market.
The report on the cryptocurrency market covers the following areas:
- Cryptocurrency Market sizing
- Cryptocurrency Market forecast
- Cryptocurrency Market industry analysis
The robust vendor analysis is designed to help clients improve their market position, and in line with this, this report provides a detailed analysis of several leading cryptocurrency market vendors that include AlphaPoint Corp., Binance Holdings Ltd., Bit2Me, Bitfury Group Ltd., Cardano, CEX.IO Corp., Coinbase Global Inc., DOGECOIN, FMR LLC, Gemini Trust Co. LLC, KuCoin, Ledger SAS, Marathon Digital Holdings, Pantera Capital, PT Pintu Kemana Saja, Riot Platforms Inc., Ripple Labs Inc., Shiba Inu, Valora Inc., WazirX, and Xapo Bank Ltd.. Also, the cryptocurrency market analysis report includes information on upcoming trends and challenges that will influence market growth. This is to help companies strategize and leverage all forthcoming growth opportunities.
The study was conducted using an objective combination of primary and secondary information including inputs from key participants in the industry. The report contains a comprehensive market and vendor landscape in addition to an analysis of the key vendors.
The publisher presents a detailed picture of the market by the way of study, synthesis, and summation of data from multiple sources by an analysis of key parameters such as profit, pricing, competition, and promotions. It presents various market facets by identifying the key industry influencers. The data presented is comprehensive, reliable, and a result of extensive primary and secondary research. The market research reports provide a complete competitive landscape and an in-depth vendor selection methodology and analysis using qualitative and quantitative research to forecast accurate market growth.
Table of Contents
1 Executive Summary
- 1.1 Market overview
- Executive Summary - Chart on Market Overview
- Executive Summary - Data Table on Market Overview
- Executive Summary - Chart on Global Market Characteristics
- Executive Summary - Chart on Market By Geographical Landscape
- Executive Summary - Chart on Market Segmentation by Type
- Executive Summary - Chart on Market Segmentation by Component
- Executive Summary - Chart on Incremental Growth
- Executive Summary - Data Table on Incremental Growth
- Executive Summary - Chart on Company Market Positioning
2 Technavio Analysis
- 2.1 Analysis of price sensitivity, lifecycle, customer purchase basket, adoption rates, and purchase criteria
- Analysis of price sensitivity, lifecycle, customer purchase basket, adoption rates, and purchase criteria
- 2.2 Criticality of inputs and Factors of differentiation
- Overview on criticality of inputs and factors of differentiation
- 2.3 Factors of disruption
- Overview on factors of disruption
- 2.4 Impact of drivers and challenges
- Impact of drivers and challenges in 2024 and 2029
3 Market Landscape
- 3.1 Market ecosystem
- Parent Market
- Data Table on - Parent Market
- 3.2 Market characteristics
- Market characteristics analysis
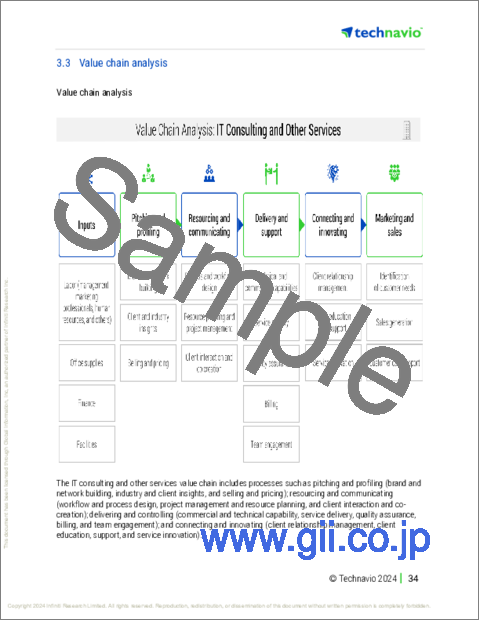
- 3.3 Value chain analysis
- Value chain analysis
4 Market Sizing
- 4.1 Market definition
- Offerings of companies included in the market definition
- 4.2 Market segment analysis
- Market segments
- 4.3 Market size 2024
- 4.4 Market outlook: Forecast for 2024-2029
- Chart on Global - Market size and forecast 2024-2029 ($ million)
- Data Table on Global - Market size and forecast 2024-2029 ($ million)
- Chart on Global Market: Year-over-year growth 2024-2029 (%)
- Data Table on Global Market: Year-over-year growth 2024-2029 (%)
5 Historic Market Size
- 5.1 Global Cryptocurrency Market 2019 - 2023
- Historic Market Size - Data Table on Global Cryptocurrency Market 2019 - 2023 ($ million)
- 5.2 Type segment analysis 2019 - 2023
- Historic Market Size - Type Segment 2019 - 2023 ($ million)
- 5.3 Component segment analysis 2019 - 2023
- Historic Market Size - Component Segment 2019 - 2023 ($ million)
- 5.4 Geography segment analysis 2019 - 2023
- Historic Market Size - Geography Segment 2019 - 2023 ($ million)
- 5.5 Country segment analysis 2019 - 2023
- Historic Market Size - Country Segment 2019 - 2023 ($ million)
6 Qualitative Analysis
- 6.1 Impact of AI on the Global Cryptocurrency Market
7 Five Forces Analysis
- 7.1 Five forces summary
- Five forces analysis - Comparison between 2024 and 2029
- 7.2 Bargaining power of buyers
- Bargaining power of buyers - Impact of key factors 2024 and 2029
- 7.3 Bargaining power of suppliers
- Bargaining power of suppliers - Impact of key factors in 2024 and 2029
- 7.4 Threat of new entrants
- Threat of new entrants - Impact of key factors in 2024 and 2029
- 7.5 Threat of substitutes
- Threat of substitutes - Impact of key factors in 2024 and 2029
- 7.6 Threat of rivalry
- Threat of rivalry - Impact of key factors in 2024 and 2029
- 7.7 Market condition
- Chart on Market condition - Five forces 2024 and 2029
8 Market Segmentation by Type
- 8.1 Market segments
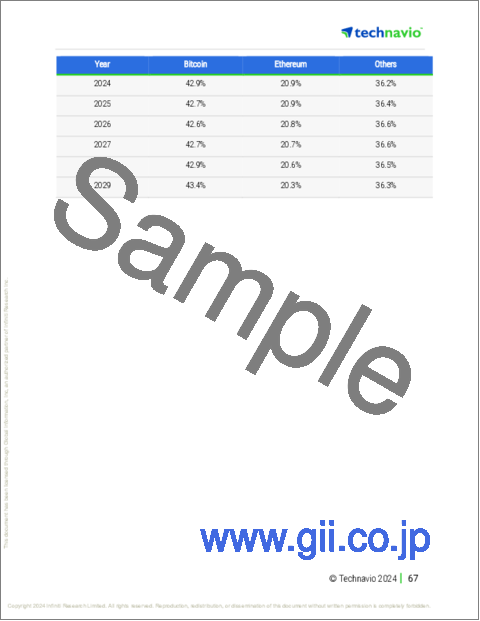
- Chart on Type - Market share 2024-2029 (%)
- Data Table on Type - Market share 2024-2029 (%)
- 8.2 Comparison by Type
- Chart on Comparison by Type
- Data Table on Comparison by Type
- 8.3 Bitcoin - Market size and forecast 2024-2029
- Chart on Bitcoin - Market size and forecast 2024-2029 ($ million)
- Data Table on Bitcoin - Market size and forecast 2024-2029 ($ million)
- Chart on Bitcoin - Year-over-year growth 2024-2029 (%)
- Data Table on Bitcoin - Year-over-year growth 2024-2029 (%)
- 8.4 Ethereum - Market size and forecast 2024-2029
- Chart on Ethereum - Market size and forecast 2024-2029 ($ million)
- Data Table on Ethereum - Market size and forecast 2024-2029 ($ million)
- Chart on Ethereum - Year-over-year growth 2024-2029 (%)
- Data Table on Ethereum - Year-over-year growth 2024-2029 (%)
- 8.5 Others - Market size and forecast 2024-2029
- Chart on Others - Market size and forecast 2024-2029 ($ million)
- Data Table on Others - Market size and forecast 2024-2029 ($ million)
- Chart on Others - Year-over-year growth 2024-2029 (%)
- Data Table on Others - Year-over-year growth 2024-2029 (%)
- 8.6 Market opportunity by Type
- Market opportunity by Type ($ million)
- Data Table on Market opportunity by Type ($ million)
9 Market Segmentation by Component
- 9.1 Market segments
- Chart on Component - Market share 2024-2029 (%)
- Data Table on Component - Market share 2024-2029 (%)
- 9.2 Comparison by Component
- Chart on Comparison by Component
- Data Table on Comparison by Component
- 9.3 Hardware - Market size and forecast 2024-2029
- Chart on Hardware - Market size and forecast 2024-2029 ($ million)
- Data Table on Hardware - Market size and forecast 2024-2029 ($ million)
- Chart on Hardware - Year-over-year growth 2024-2029 (%)
- Data Table on Hardware - Year-over-year growth 2024-2029 (%)
- 9.4 Software - Market size and forecast 2024-2029
- Chart on Software - Market size and forecast 2024-2029 ($ million)
- Data Table on Software - Market size and forecast 2024-2029 ($ million)
- Chart on Software - Year-over-year growth 2024-2029 (%)
- Data Table on Software - Year-over-year growth 2024-2029 (%)
- 9.5 Market opportunity by Component
- Market opportunity by Component ($ million)
- Data Table on Market opportunity by Component ($ million)
10 Customer Landscape
- 10.1 Customer landscape overview
- Analysis of price sensitivity, lifecycle, customer purchase basket, adoption rates, and purchase criteria
11 Geographic Landscape
- 11.1 Geographic segmentation
- Chart on Market share By Geographical Landscape 2024-2029 (%)
- Data Table on Market share By Geographical Landscape 2024-2029 (%)
- 11.2 Geographic comparison
- Chart on Geographic comparison
- Data Table on Geographic comparison
- 11.3 North America - Market size and forecast 2024-2029
- Chart on North America - Market size and forecast 2024-2029 ($ million)
- Data Table on North America - Market size and forecast 2024-2029 ($ million)
- Chart on North America - Year-over-year growth 2024-2029 (%)
- Data Table on North America - Year-over-year growth 2024-2029 (%)
- 11.4 Europe - Market size and forecast 2024-2029
- Chart on Europe - Market size and forecast 2024-2029 ($ million)
- Data Table on Europe - Market size and forecast 2024-2029 ($ million)
- Chart on Europe - Year-over-year growth 2024-2029 (%)
- Data Table on Europe - Year-over-year growth 2024-2029 (%)
- 11.5 APAC - Market size and forecast 2024-2029
- Chart on APAC - Market size and forecast 2024-2029 ($ million)
- Data Table on APAC - Market size and forecast 2024-2029 ($ million)
- Chart on APAC - Year-over-year growth 2024-2029 (%)
- Data Table on APAC - Year-over-year growth 2024-2029 (%)
- 11.6 South America - Market size and forecast 2024-2029
- Chart on South America - Market size and forecast 2024-2029 ($ million)
- Data Table on South America - Market size and forecast 2024-2029 ($ million)
- Chart on South America - Year-over-year growth 2024-2029 (%)
- Data Table on South America - Year-over-year growth 2024-2029 (%)
- 11.7 Middle East and Africa - Market size and forecast 2024-2029
- Chart on Middle East and Africa - Market size and forecast 2024-2029 ($ million)
- Data Table on Middle East and Africa - Market size and forecast 2024-2029 ($ million)
- Chart on Middle East and Africa - Year-over-year growth 2024-2029 (%)
- Data Table on Middle East and Africa - Year-over-year growth 2024-2029 (%)
- 11.8 US - Market size and forecast 2024-2029
- Chart on US - Market size and forecast 2024-2029 ($ million)
- Data Table on US - Market size and forecast 2024-2029 ($ million)
- Chart on US - Year-over-year growth 2024-2029 (%)
- Data Table on US - Year-over-year growth 2024-2029 (%)
- 11.9 UK - Market size and forecast 2024-2029
- Chart on UK - Market size and forecast 2024-2029 ($ million)
- Data Table on UK - Market size and forecast 2024-2029 ($ million)
- Chart on UK - Year-over-year growth 2024-2029 (%)
- Data Table on UK - Year-over-year growth 2024-2029 (%)
- 11.10 Germany - Market size and forecast 2024-2029
- Chart on Germany - Market size and forecast 2024-2029 ($ million)
- Data Table on Germany - Market size and forecast 2024-2029 ($ million)
- Chart on Germany - Year-over-year growth 2024-2029 (%)
- Data Table on Germany - Year-over-year growth 2024-2029 (%)
- 11.11 China - Market size and forecast 2024-2029
- Chart on China - Market size and forecast 2024-2029 ($ million)
- Data Table on China - Market size and forecast 2024-2029 ($ million)
- Chart on China - Year-over-year growth 2024-2029 (%)
- Data Table on China - Year-over-year growth 2024-2029 (%)
- 11.12 Switzerland - Market size and forecast 2024-2029
- Chart on Switzerland - Market size and forecast 2024-2029 ($ million)
- Data Table on Switzerland - Market size and forecast 2024-2029 ($ million)
- Chart on Switzerland - Year-over-year growth 2024-2029 (%)
- Data Table on Switzerland - Year-over-year growth 2024-2029 (%)
- 11.13 Brazil - Market size and forecast 2024-2029
- Chart on Brazil - Market size and forecast 2024-2029 ($ million)
- Data Table on Brazil - Market size and forecast 2024-2029 ($ million)
- Chart on Brazil - Year-over-year growth 2024-2029 (%)
- Data Table on Brazil - Year-over-year growth 2024-2029 (%)
- 11.14 Canada - Market size and forecast 2024-2029
- Chart on Canada - Market size and forecast 2024-2029 ($ million)
- Data Table on Canada - Market size and forecast 2024-2029 ($ million)
- Chart on Canada - Year-over-year growth 2024-2029 (%)
- Data Table on Canada - Year-over-year growth 2024-2029 (%)
- 11.15 Japan - Market size and forecast 2024-2029
- Chart on Japan - Market size and forecast 2024-2029 ($ million)
- Data Table on Japan - Market size and forecast 2024-2029 ($ million)
- Chart on Japan - Year-over-year growth 2024-2029 (%)
- Data Table on Japan - Year-over-year growth 2024-2029 (%)
- 11.16 Italy - Market size and forecast 2024-2029
- Chart on Italy - Market size and forecast 2024-2029 ($ million)
- Data Table on Italy - Market size and forecast 2024-2029 ($ million)
- Chart on Italy - Year-over-year growth 2024-2029 (%)
- Data Table on Italy - Year-over-year growth 2024-2029 (%)
- 11.17 The Netherlands - Market size and forecast 2024-2029
- Chart on The Netherlands - Market size and forecast 2024-2029 ($ million)
- Data Table on The Netherlands - Market size and forecast 2024-2029 ($ million)
- Chart on The Netherlands - Year-over-year growth 2024-2029 (%)
- Data Table on The Netherlands - Year-over-year growth 2024-2029 (%)
- 11.18 Market opportunity By Geographical Landscape
- Market opportunity By Geographical Landscape ($ million)
- Data Tables on Market opportunity By Geographical Landscape ($ million)
12 Drivers, Challenges, and Opportunity/Restraints
- 12.1 Market drivers
- 12.2 Market challenges
- 12.3 Impact of drivers and challenges
- Impact of drivers and challenges in 2024 and 2029
- 12.4 Market opportunities/restraints
13 Competitive Landscape
- 13.1 Overview
- 13.2 Competitive Landscape
- Overview on criticality of inputs and factors of differentiation
- 13.3 Landscape disruption
- Overview on factors of disruption
- 13.4 Industry risks
- Impact of key risks on business
14 Competitive Analysis
- 14.1 Companies profiled
- Companies covered
- 14.2 Company ranking index
- Company ranking index
- 14.3 Market positioning of companies
- Matrix on companies position and classification
- 14.4 AlphaPoint Corp.
- AlphaPoint Corp. - Overview
- AlphaPoint Corp. - Product / Service
- AlphaPoint Corp. - Key offerings
- SWOT
- 14.5 Binance Holdings Ltd.
- Binance Holdings Ltd. - Overview
- Binance Holdings Ltd. - Product / Service
- Binance Holdings Ltd. - Key offerings
- SWOT
- 14.6 Bit2Me
- Bit2Me - Overview
- Bit2Me - Product / Service
- Bit2Me - Key offerings
- SWOT
- 14.7 Cardano
- Cardano - Overview
- Cardano - Product / Service
- Cardano - Key offerings
- SWOT
- 14.8 CEX.IO Corp.
- CEX.IO Corp. - Overview
- CEX.IO Corp. - Product / Service
- CEX.IO Corp. - Key offerings
- SWOT
- 14.9 Coinbase Global Inc.
- Coinbase Global Inc. - Overview
- Coinbase Global Inc. - Product / Service
- Coinbase Global Inc. - Key offerings
- SWOT
- 14.10 DOGECOIN
- DOGECOIN - Overview
- DOGECOIN - Product / Service
- DOGECOIN - Key offerings
- SWOT
- 14.11 KuCoin
- KuCoin - Overview
- KuCoin - Product / Service
- KuCoin - Key offerings
- SWOT
- 14.12 Ledger SAS
- Ledger SAS - Overview
- Ledger SAS - Product / Service
- Ledger SAS - Key offerings
- SWOT
- 14.13 Marathon Digital Holdings
- Marathon Digital Holdings - Overview
- Marathon Digital Holdings - Product / Service
- Marathon Digital Holdings - Key offerings
- SWOT
- 14.14 Riot Platforms Inc.
- Riot Platforms Inc. - Overview
- Riot Platforms Inc. - Product / Service
- Riot Platforms Inc. - Key offerings
- SWOT
- 14.15 Shiba Inu
- Shiba Inu - Overview
- Shiba Inu - Product / Service
- Shiba Inu - Key offerings
- SWOT
- 14.16 Valora Inc.
- Valora Inc. - Overview
- Valora Inc. - Product / Service
- Valora Inc. - Key offerings
- SWOT
- 14.17 WazirX
- WazirX - Overview
- WazirX - Product / Service
- WazirX - Key offerings
- SWOT
- 14.18 Xapo Bank Ltd.
- Xapo Bank Ltd. - Overview
- Xapo Bank Ltd. - Product / Service
- Xapo Bank Ltd. - Key offerings
- SWOT
15 Appendix
- 15.1 Scope of the report
- 15.2 Inclusions and exclusions checklist
- Inclusions checklist
- Exclusions checklist
- 15.3 Currency conversion rates for US$
- Currency conversion rates for US$
- 15.4 Research methodology
- Research methodology
- 15.5 Data procurement
- Information sources
- 15.6 Data validation
- Data validation
- 15.7 Validation techniques employed for market sizing
- Validation techniques employed for market sizing
- 15.8 Data synthesis
- Data synthesis
- 15.9 360 degree market analysis
- 360 degree market analysis
- 15.10 List of abbreviations
- List of abbreviations

