|
|
市場調査レポート
商品コード
1634379
オリゴヌクレオチド合成の世界市場(2025年~2029年)Global Oligonucleotide Synthesis Market 2025-2029 |
||||||

|
|||||||
カスタマイズ可能
|
|||||||


| オリゴヌクレオチド合成の世界市場(2025年~2029年) |
|
出版日: 2025年01月04日
発行: TechNavio
ページ情報: 英文 220 Pages
納期: 即納可能
|

全表示
- 概要
- 図表
- 目次
オリゴヌクレオチド合成市場(2025年~2029年)
オリゴヌクレオチド合成市場は2024-2029年に47億4,630万米ドル、予測期間中のCAGRは17.4%で成長すると予測されます。この調査レポートは、オリゴヌクレオチド合成市場の全体分析、市場規模・予測、動向、成長促進要因、課題、約25のベンダーを網羅したベンダー分析などを掲載しています。
現在の市場シナリオ、最新動向と促進要因、市場環境全体に関する最新分析を提供しています。市場は、rnaベースの治療薬へのシフトの高まり、治療・診断ツールとしてのオリゴヌクレオチドの使用の増加、およびオリゴヌクレオチド合成における技術革新によって牽引されています。
| 市場範囲 | |
|---|---|
| 基準年 | 2025年 |
| 終了年 | 2029年 |
| 予測期間 | 2025年~2029年 |
| 成長モメンタム | 加速 |
| 前年比2025年 | 14.4% |
| CAGR | 17.4% |
| 増分額 | 47億4,630万米ドル |
本調査では、オリゴヌクレオチド合成におけるAIと自動化の統合が、今後数年間のオリゴヌクレオチド合成市場成長を促進する主要な理由の1つであると指摘しています。また、オリゴヌクレオチド合成の調査と資金調達の増加、低コストでハイスループットなオリゴヌクレオチド合成の需要増加が、市場の大きな需要につながります。
目次
第1章 エグゼクティブサマリー
- 市場概要
第2章 Technavioによる分析
- 価格・ライフサイクル・顧客購入バスケット・採用率・購入基準の分析
- インプットの重要性と差別化の要因
- 混乱の要因
- 促進要因と課題の影響
第3章 市場情勢
- 市場エコシステム
- 市場の特徴
- バリューチェーン分析
第4章 市場規模
- 市場の定義
- 市場セグメント分析
- 市場規模(2024年)
- 市場の見通し(2024年~2029年)
第5章 市場規模実績
- オリゴヌクレオチド合成の世界市場(2019年~2023年)
- 用途別セグメント分析(2019年~2023年)
- エンドユーザーセグメント分析(2019年~2023年)
- 地域別セグメント分析(2019年~2023年)
- 国別セグメント分析(2019年~2023年)
第6章 定性分析
- AIの影響:オリゴヌクレオチド合成の世界市場
第7章 ファイブフォース分析
- ファイブフォースの要約
- 買い手の交渉力
- 供給企業の交渉力
- 新規参入業者の脅威
- 代替品の脅威
- 競争の脅威
- 市況
第8章 市場セグメンテーション:用途別
- 市場セグメント
- 比較:用途別
- PCRプライマー:市場規模と予測(2024年~2029年)
- PCRアッセイとパネル:市場規模と予測(2024年~2029年)
- DNAマイクロアレイ:市場規模と予測(2024年~2029年)
- 蛍光in situハイブリダイゼーション:市場規模と予測(2024年~2029年)
- その他:市場規模と予測(2024年~2029年)
- 市場機会:用途別
第9章 市場セグメンテーション:エンドユーザー別
- 市場セグメント
- 比較:エンドユーザー別
- 製薬・バイオテクノロジー企業:市場規模と予測(2024年~2029年)
- 学術研究機関:市場規模と予測(2024年~2029年)
- 診断検査室:市場規模と予測(2024年~2029年)
- 病院:市場規模と予測(2024年~2029年)
- 市場機会:エンドユーザー別
第10章 顧客情勢
- 顧客情勢の概要
第11章 地域別情勢
- 地域別セグメンテーション
- 地域別比較
- 北米:市場規模と予測(2024年~2029年)
- 欧州:市場規模と予測(2024年~2029年)
- アジア:市場規模と予測(2024年~2029年)
- 世界のその他の地域:市場規模と予測(2024年~2029年)
- 米国:市場規模と予測(2024年~2029年)
- 中国:市場規模と予測(2024年~2029年)
- ドイツ:市場規模と予測(2024年~2029年)
- カナダ:市場規模と予測(2024年~2029年)
- 英国:市場規模と予測(2024年~2029年)
- 日本:市場規模と予測(2024年~2029年)
- フランス:市場規模と予測(2024年~2029年)
- イタリア:市場規模と予測(2024年~2029年)
- インド:市場規模と予測(2024年~2029年)
- 韓国:市場規模と予測(2024年~2029年)
- 市場機会:地域情勢別
第12章 促進要因・課題・機会・抑制要因
- 市場促進要因
- 市場の課題
- 促進要因と課題の影響
- 市場の機会・抑制要因
第13章 競合情勢
- 概要
- 競合情勢
- 混乱の状況
- 業界のリスク
第14章 競合分析
- 企業プロファイル
- 企業ランキング指数
- 企業の市場ポジショニング
- Agilent Technologies Inc.
- Ansa Biotechnologies
- Biogen Inc.
- Biotage AB
- Danaher Corp.
- General Electric Co.
- Kaneka Corp.
- LGC Science Group Holdings Ltd.
- Merck KGaA
- Mettler Toledo International Inc.
- QIAGEN N.V.
- Sarepta Therapeutics Inc.
- Synbio Technologies LLC
- Syngene International Ltd.
- Thermo Fisher Scientific Inc.
第15章 付録
Exhibits:
- Exhibits1: Executive Summary - Chart on Market Overview
- Exhibits2: Executive Summary - Data Table on Market Overview
- Exhibits3: Executive Summary - Chart on Global Market Characteristics
- Exhibits4: Executive Summary - Chart on Market By Geographical Landscape
- Exhibits5: Executive Summary - Chart on Market Segmentation by Application
- Exhibits6: Executive Summary - Chart on Market Segmentation by End-user
- Exhibits7: Executive Summary - Chart on Incremental Growth
- Exhibits8: Executive Summary - Data Table on Incremental Growth
- Exhibits9: Executive Summary - Chart on Company Market Positioning
- Exhibits10: Analysis of price sensitivity, lifecycle, customer purchase basket, adoption rates, and purchase criteria
- Exhibits11: Overview on criticality of inputs and factors of differentiation
- Exhibits12: Overview on factors of disruption
- Exhibits13: Impact of drivers and challenges in 2024 and 2029
- Exhibits14: Parent Market
- Exhibits15: Data Table on - Parent Market
- Exhibits16: Market characteristics analysis
- Exhibits17: Value chain analysis
- Exhibits18: Offerings of companies included in the market definition
- Exhibits19: Market segments
- Exhibits20: Chart on Global - Market size and forecast 2024-2029 ($ million)
- Exhibits21: Data Table on Global - Market size and forecast 2024-2029 ($ million)
- Exhibits22: Chart on Global Market: Year-over-year growth 2024-2029 (%)
- Exhibits23: Data Table on Global Market: Year-over-year growth 2024-2029 (%)
- Exhibits24: Historic Market Size - Data Table on Global Oligonucleotide Synthesis Market 2019 - 2023 ($ million)
- Exhibits25: Historic Market Size - Application Segment 2019 - 2023 ($ million)
- Exhibits26: Historic Market Size - End-user Segment 2019 - 2023 ($ million)
- Exhibits27: Historic Market Size - Geography Segment 2019 - 2023 ($ million)
- Exhibits28: Historic Market Size - Country Segment 2019 - 2023 ($ million)
- Exhibits29: Five forces analysis - Comparison between 2024 and 2029
- Exhibits30: Bargaining power of buyers - Impact of key factors 2024 and 2029
- Exhibits31: Bargaining power of suppliers - Impact of key factors in 2024 and 2029
- Exhibits32: Threat of new entrants - Impact of key factors in 2024 and 2029
- Exhibits33: Threat of substitutes - Impact of key factors in 2024 and 2029
- Exhibits34: Threat of rivalry - Impact of key factors in 2024 and 2029
- Exhibits35: Chart on Market condition - Five forces 2024 and 2029
- Exhibits36: Chart on Application - Market share 2024-2029 (%)
- Exhibits37: Data Table on Application - Market share 2024-2029 (%)
- Exhibits38: Chart on Comparison by Application
- Exhibits39: Data Table on Comparison by Application
- Exhibits40: Chart on PCR primers - Market size and forecast 2024-2029 ($ million)
- Exhibits41: Data Table on PCR primers - Market size and forecast 2024-2029 ($ million)
- Exhibits42: Chart on PCR primers - Year-over-year growth 2024-2029 (%)
- Exhibits43: Data Table on PCR primers - Year-over-year growth 2024-2029 (%)
- Exhibits44: Chart on PCR assays and panels - Market size and forecast 2024-2029 ($ million)
- Exhibits45: Data Table on PCR assays and panels - Market size and forecast 2024-2029 ($ million)
- Exhibits46: Chart on PCR assays and panels - Year-over-year growth 2024-2029 (%)
- Exhibits47: Data Table on PCR assays and panels - Year-over-year growth 2024-2029 (%)
- Exhibits48: Chart on DNA microarrays - Market size and forecast 2024-2029 ($ million)
- Exhibits49: Data Table on DNA microarrays - Market size and forecast 2024-2029 ($ million)
- Exhibits50: Chart on DNA microarrays - Year-over-year growth 2024-2029 (%)
- Exhibits51: Data Table on DNA microarrays - Year-over-year growth 2024-2029 (%)
- Exhibits52: Chart on Fluorescence in situ hybridization - Market size and forecast 2024-2029 ($ million)
- Exhibits53: Data Table on Fluorescence in situ hybridization - Market size and forecast 2024-2029 ($ million)
- Exhibits54: Chart on Fluorescence in situ hybridization - Year-over-year growth 2024-2029 (%)
- Exhibits55: Data Table on Fluorescence in situ hybridization - Year-over-year growth 2024-2029 (%)
- Exhibits56: Chart on Others - Market size and forecast 2024-2029 ($ million)
- Exhibits57: Data Table on Others - Market size and forecast 2024-2029 ($ million)
- Exhibits58: Chart on Others - Year-over-year growth 2024-2029 (%)
- Exhibits59: Data Table on Others - Year-over-year growth 2024-2029 (%)
- Exhibits60: Market opportunity by Application ($ million)
- Exhibits61: Data Table on Market opportunity by Application ($ million)
- Exhibits62: Chart on End-user - Market share 2024-2029 (%)
- Exhibits63: Data Table on End-user - Market share 2024-2029 (%)
- Exhibits64: Chart on Comparison by End-user
- Exhibits65: Data Table on Comparison by End-user
- Exhibits66: Chart on Pharmaceutical and biotechnology companies - Market size and forecast 2024-2029 ($ million)
- Exhibits67: Data Table on Pharmaceutical and biotechnology companies - Market size and forecast 2024-2029 ($ million)
- Exhibits68: Chart on Pharmaceutical and biotechnology companies - Year-over-year growth 2024-2029 (%)
- Exhibits69: Data Table on Pharmaceutical and biotechnology companies - Year-over-year growth 2024-2029 (%)
- Exhibits70: Chart on Research and academic institutes - Market size and forecast 2024-2029 ($ million)
- Exhibits71: Data Table on Research and academic institutes - Market size and forecast 2024-2029 ($ million)
- Exhibits72: Chart on Research and academic institutes - Year-over-year growth 2024-2029 (%)
- Exhibits73: Data Table on Research and academic institutes - Year-over-year growth 2024-2029 (%)
- Exhibits74: Chart on Diagnostic laboratories - Market size and forecast 2024-2029 ($ million)
- Exhibits75: Data Table on Diagnostic laboratories - Market size and forecast 2024-2029 ($ million)
- Exhibits76: Chart on Diagnostic laboratories - Year-over-year growth 2024-2029 (%)
- Exhibits77: Data Table on Diagnostic laboratories - Year-over-year growth 2024-2029 (%)
- Exhibits78: Chart on Hospitals - Market size and forecast 2024-2029 ($ million)
- Exhibits79: Data Table on Hospitals - Market size and forecast 2024-2029 ($ million)
- Exhibits80: Chart on Hospitals - Year-over-year growth 2024-2029 (%)
- Exhibits81: Data Table on Hospitals - Year-over-year growth 2024-2029 (%)
- Exhibits82: Market opportunity by End-user ($ million)
- Exhibits83: Data Table on Market opportunity by End-user ($ million)
- Exhibits84: Analysis of price sensitivity, lifecycle, customer purchase basket, adoption rates, and purchase criteria
- Exhibits85: Chart on Market share By Geographical Landscape 2024-2029 (%)
- Exhibits86: Data Table on Market share By Geographical Landscape 2024-2029 (%)
- Exhibits87: Chart on Geographic comparison
- Exhibits88: Data Table on Geographic comparison
- Exhibits89: Chart on North America - Market size and forecast 2024-2029 ($ million)
- Exhibits90: Data Table on North America - Market size and forecast 2024-2029 ($ million)
- Exhibits91: Chart on North America - Year-over-year growth 2024-2029 (%)
- Exhibits92: Data Table on North America - Year-over-year growth 2024-2029 (%)
- Exhibits93: Chart on Europe - Market size and forecast 2024-2029 ($ million)
- Exhibits94: Data Table on Europe - Market size and forecast 2024-2029 ($ million)
- Exhibits95: Chart on Europe - Year-over-year growth 2024-2029 (%)
- Exhibits96: Data Table on Europe - Year-over-year growth 2024-2029 (%)
- Exhibits97: Chart on Asia - Market size and forecast 2024-2029 ($ million)
- Exhibits98: Data Table on Asia - Market size and forecast 2024-2029 ($ million)
- Exhibits99: Chart on Asia - Year-over-year growth 2024-2029 (%)
- Exhibits100: Data Table on Asia - Year-over-year growth 2024-2029 (%)
- Exhibits101: Chart on Rest of World (ROW) - Market size and forecast 2024-2029 ($ million)
- Exhibits102: Data Table on Rest of World (ROW) - Market size and forecast 2024-2029 ($ million)
- Exhibits103: Chart on Rest of World (ROW) - Year-over-year growth 2024-2029 (%)
- Exhibits104: Data Table on Rest of World (ROW) - Year-over-year growth 2024-2029 (%)
- Exhibits105: Chart on US - Market size and forecast 2024-2029 ($ million)
- Exhibits106: Data Table on US - Market size and forecast 2024-2029 ($ million)
- Exhibits107: Chart on US - Year-over-year growth 2024-2029 (%)
- Exhibits108: Data Table on US - Year-over-year growth 2024-2029 (%)
- Exhibits109: Chart on China - Market size and forecast 2024-2029 ($ million)
- Exhibits110: Data Table on China - Market size and forecast 2024-2029 ($ million)
- Exhibits111: Chart on China - Year-over-year growth 2024-2029 (%)
- Exhibits112: Data Table on China - Year-over-year growth 2024-2029 (%)
- Exhibits113: Chart on Germany - Market size and forecast 2024-2029 ($ million)
- Exhibits114: Data Table on Germany - Market size and forecast 2024-2029 ($ million)
- Exhibits115: Chart on Germany - Year-over-year growth 2024-2029 (%)
- Exhibits116: Data Table on Germany - Year-over-year growth 2024-2029 (%)
- Exhibits117: Chart on Canada - Market size and forecast 2024-2029 ($ million)
- Exhibits118: Data Table on Canada - Market size and forecast 2024-2029 ($ million)
- Exhibits119: Chart on Canada - Year-over-year growth 2024-2029 (%)
- Exhibits120: Data Table on Canada - Year-over-year growth 2024-2029 (%)
- Exhibits121: Chart on UK - Market size and forecast 2024-2029 ($ million)
- Exhibits122: Data Table on UK - Market size and forecast 2024-2029 ($ million)
- Exhibits123: Chart on UK - Year-over-year growth 2024-2029 (%)
- Exhibits124: Data Table on UK - Year-over-year growth 2024-2029 (%)
- Exhibits125: Chart on Japan - Market size and forecast 2024-2029 ($ million)
- Exhibits126: Data Table on Japan - Market size and forecast 2024-2029 ($ million)
- Exhibits127: Chart on Japan - Year-over-year growth 2024-2029 (%)
- Exhibits128: Data Table on Japan - Year-over-year growth 2024-2029 (%)
- Exhibits129: Chart on France - Market size and forecast 2024-2029 ($ million)
- Exhibits130: Data Table on France - Market size and forecast 2024-2029 ($ million)
- Exhibits131: Chart on France - Year-over-year growth 2024-2029 (%)
- Exhibits132: Data Table on France - Year-over-year growth 2024-2029 (%)
- Exhibits133: Chart on Italy - Market size and forecast 2024-2029 ($ million)
- Exhibits134: Data Table on Italy - Market size and forecast 2024-2029 ($ million)
- Exhibits135: Chart on Italy - Year-over-year growth 2024-2029 (%)
- Exhibits136: Data Table on Italy - Year-over-year growth 2024-2029 (%)
- Exhibits137: Chart on India - Market size and forecast 2024-2029 ($ million)
- Exhibits138: Data Table on India - Market size and forecast 2024-2029 ($ million)
- Exhibits139: Chart on India - Year-over-year growth 2024-2029 (%)
- Exhibits140: Data Table on India - Year-over-year growth 2024-2029 (%)
- Exhibits141: Chart on South Korea - Market size and forecast 2024-2029 ($ million)
- Exhibits142: Data Table on South Korea - Market size and forecast 2024-2029 ($ million)
- Exhibits143: Chart on South Korea - Year-over-year growth 2024-2029 (%)
- Exhibits144: Data Table on South Korea - Year-over-year growth 2024-2029 (%)
- Exhibits145: Market opportunity By Geographical Landscape ($ million)
- Exhibits146: Data Tables on Market opportunity By Geographical Landscape ($ million)
- Exhibits147: Impact of drivers and challenges in 2024 and 2029
- Exhibits148: Overview on criticality of inputs and factors of differentiation
- Exhibits149: Overview on factors of disruption
- Exhibits150: Impact of key risks on business
- Exhibits151: Companies covered
- Exhibits152: Company ranking index
- Exhibits153: Matrix on companies position and classification
- Exhibits154: Agilent Technologies Inc. - Overview
- Exhibits155: Agilent Technologies Inc. - Business segments
- Exhibits156: Agilent Technologies Inc. - Key news
- Exhibits157: Agilent Technologies Inc. - Key offerings
- Exhibits158: Agilent Technologies Inc. - Segment focus
- Exhibits159: SWOT
- Exhibits160: Ansa Biotechnologies - Overview
- Exhibits161: Ansa Biotechnologies - Product / Service
- Exhibits162: Ansa Biotechnologies - Key offerings
- Exhibits163: SWOT
- Exhibits164: Biogen Inc. - Overview
- Exhibits165: Biogen Inc. - Product / Service
- Exhibits166: Biogen Inc. - Key news
- Exhibits167: Biogen Inc. - Key offerings
- Exhibits168: SWOT
- Exhibits169: Biotage AB - Overview
- Exhibits170: Biotage AB - Product / Service
- Exhibits171: Biotage AB - Key offerings
- Exhibits172: SWOT
- Exhibits173: Danaher Corp. - Overview
- Exhibits174: Danaher Corp. - Business segments
- Exhibits175: Danaher Corp. - Key news
- Exhibits176: Danaher Corp. - Key offerings
- Exhibits177: Danaher Corp. - Segment focus
- Exhibits178: SWOT
- Exhibits179: General Electric Co. - Overview
- Exhibits180: General Electric Co. - Business segments
- Exhibits181: General Electric Co. - Key news
- Exhibits182: General Electric Co. - Key offerings
- Exhibits183: General Electric Co. - Segment focus
- Exhibits184: SWOT
- Exhibits185: Kaneka Corp. - Overview
- Exhibits186: Kaneka Corp. - Business segments
- Exhibits187: Kaneka Corp. - Key news
- Exhibits188: Kaneka Corp. - Key offerings
- Exhibits189: Kaneka Corp. - Segment focus
- Exhibits190: SWOT
- Exhibits191: LGC Science Group Holdings Ltd. - Overview
- Exhibits192: LGC Science Group Holdings Ltd. - Product / Service
- Exhibits193: LGC Science Group Holdings Ltd. - Key offerings
- Exhibits194: SWOT
- Exhibits195: Merck KGaA - Overview
- Exhibits196: Merck KGaA - Business segments
- Exhibits197: Merck KGaA - Key news
- Exhibits198: Merck KGaA - Key offerings
- Exhibits199: Merck KGaA - Segment focus
- Exhibits200: SWOT
- Exhibits201: Mettler Toledo International Inc. - Overview
- Exhibits202: Mettler Toledo International Inc. - Business segments
- Exhibits203: Mettler Toledo International Inc. - Key news
- Exhibits204: Mettler Toledo International Inc. - Key offerings
- Exhibits205: Mettler Toledo International Inc. - Segment focus
- Exhibits206: SWOT
- Exhibits207: QIAGEN N.V. - Overview
- Exhibits208: QIAGEN N.V. - Product / Service
- Exhibits209: QIAGEN N.V. - Key news
- Exhibits210: QIAGEN N.V. - Key offerings
- Exhibits211: SWOT
- Exhibits212: Sarepta Therapeutics Inc. - Overview
- Exhibits213: Sarepta Therapeutics Inc. - Product / Service
- Exhibits214: Sarepta Therapeutics Inc. - Key offerings
- Exhibits215: SWOT
- Exhibits216: Synbio Technologies LLC - Overview
- Exhibits217: Synbio Technologies LLC - Product / Service
- Exhibits218: Synbio Technologies LLC - Key offerings
- Exhibits219: SWOT
- Exhibits220: Syngene International Ltd. - Overview
- Exhibits221: Syngene International Ltd. - Product / Service
- Exhibits222: Syngene International Ltd. - Key offerings
- Exhibits223: SWOT
- Exhibits224: Thermo Fisher Scientific Inc. - Overview
- Exhibits225: Thermo Fisher Scientific Inc. - Business segments
- Exhibits226: Thermo Fisher Scientific Inc. - Key news
- Exhibits227: Thermo Fisher Scientific Inc. - Key offerings
- Exhibits228: Thermo Fisher Scientific Inc. - Segment focus
- Exhibits229: SWOT
- Exhibits230: Inclusions checklist
- Exhibits231: Exclusions checklist
- Exhibits232: Currency conversion rates for US$
- Exhibits233: Research methodology
- Exhibits234: Information sources
Exhibit
Oligonucleotide Synthesis Market 2025-2029
The oligonucleotide synthesis market is forecasted to grow by USD 4746.3 mn during 2024-2029, accelerating at a CAGR of 17.4% during the forecast period. The report on the oligonucleotide synthesis market provides a holistic analysis, market size and forecast, trends, growth drivers, and challenges, as well as vendor analysis covering around 25 vendors.
The report offers an up-to-date analysis regarding the current market scenario, the latest trends and drivers, and the overall market environment. The market is driven by growing shift toward rna-based therapeutics, increasing use of oligonucleotides as therapeutic and diagnostic tools, and technological innovations in oligonucleotide synthesis.
| Market Scope | |
|---|---|
| Base Year | 2025 |
| End Year | 2029 |
| Series Year | 2025-2029 |
| Growth Momentum | Accelerate |
| YOY 2025 | 14.4% |
| CAGR | 17.4% |
| Incremental Value | $4746.3 mn |
Technavio's oligonucleotide synthesis market is segmented as below:
By Application
- PCR primers
- PCR assays and panels
- DNA microarrays
- Fluorescence in situ hybridization
- Others
By End-user
- Pharmaceutical and biotechnology companies
- Research and academic institutes
- Diagnostic laboratories
- Hospitals
By Geographical Landscape
- North America
- Europe
- Asia
- Rest of World (ROW)
This study identifies the integration of ai and automation in oligonucleotide synthesis as one of the prime reasons driving the oligonucleotide synthesis market growth during the next few years. Also, increasing research and funding for oligonucleotide synthesis and rise in demand for low-cost and high-throughput oligonucleotide synthesis will lead to sizable demand in the market.
The report on the oligonucleotide synthesis market covers the following areas:
- Oligonucleotide Synthesis Market sizing
- Oligonucleotide Synthesis Market forecast
- Oligonucleotide Synthesis Market industry analysis
The robust vendor analysis is designed to help clients improve their market position, and in line with this, this report provides a detailed analysis of several leading oligonucleotide synthesis market vendors that include Agilent Technologies Inc., Ajinomoto Bio Pharma Services, Alnylam Pharmaceuticals Inc., Amgen Inc., Ansa Biotechnologies, Bio Synthesis Inc, Biogen Inc., Biotage AB, Danaher Corp., Eurofins Scientific SE, General Electric Co., Ionis Pharmaceuticals Inc., Kaneka Corp., LGC Science Group Holdings Ltd., Merck KGaA, Mettler Toledo International Inc., QIAGEN N.V., Sarepta Therapeutics Inc., Synbio Technologies LLC, Syngene International Ltd., and Thermo Fisher Scientific Inc.. Also, the oligonucleotide synthesis market analysis report includes information on upcoming trends and challenges that will influence market growth. This is to help companies strategize and leverage all forthcoming growth opportunities.
The study was conducted using an objective combination of primary and secondary information including inputs from key participants in the industry. The report contains a comprehensive market and vendor landscape in addition to an analysis of the key vendors.
The publisher presents a detailed picture of the market by the way of study, synthesis, and summation of data from multiple sources by an analysis of key parameters such as profit, pricing, competition, and promotions. It presents various market facets by identifying the key industry influencers. The data presented is comprehensive, reliable, and a result of extensive primary and secondary research. The market research reports provide a complete competitive landscape and an in-depth vendor selection methodology and analysis using qualitative and quantitative research to forecast accurate market growth.
Table of Contents
1 Executive Summary
- 1.1 Market overview
- Executive Summary - Chart on Market Overview
- Executive Summary - Data Table on Market Overview
- Executive Summary - Chart on Global Market Characteristics
- Executive Summary - Chart on Market By Geographical Landscape
- Executive Summary - Chart on Market Segmentation by Application
- Executive Summary - Chart on Market Segmentation by End-user
- Executive Summary - Chart on Incremental Growth
- Executive Summary - Data Table on Incremental Growth
- Executive Summary - Chart on Company Market Positioning
2 Technavio Analysis
- 2.1 Analysis of price sensitivity, lifecycle, customer purchase basket, adoption rates, and purchase criteria
- Analysis of price sensitivity, lifecycle, customer purchase basket, adoption rates, and purchase criteria
- 2.2 Criticality of inputs and Factors of differentiation
- Overview on criticality of inputs and factors of differentiation
- 2.3 Factors of disruption
- Overview on factors of disruption
- 2.4 Impact of drivers and challenges
- Impact of drivers and challenges in 2024 and 2029
3 Market Landscape
- 3.1 Market ecosystem
- Parent Market
- Data Table on - Parent Market
- 3.2 Market characteristics
- Market characteristics analysis
- 3.3 Value chain analysis
- Value chain analysis
4 Market Sizing
- 4.1 Market definition
- Offerings of companies included in the market definition
- 4.2 Market segment analysis
- Market segments
- 4.3 Market size 2024
- 4.4 Market outlook: Forecast for 2024-2029
- Chart on Global - Market size and forecast 2024-2029 ($ million)
- Data Table on Global - Market size and forecast 2024-2029 ($ million)
- Chart on Global Market: Year-over-year growth 2024-2029 (%)
- Data Table on Global Market: Year-over-year growth 2024-2029 (%)
5 Historic Market Size
- 5.1 Global Oligonucleotide Synthesis Market 2019 - 2023
- Historic Market Size - Data Table on Global Oligonucleotide Synthesis Market 2019 - 2023 ($ million)
- 5.2 Application segment analysis 2019 - 2023
- Historic Market Size - Application Segment 2019 - 2023 ($ million)
- 5.3 End-user segment analysis 2019 - 2023
- Historic Market Size - End-user Segment 2019 - 2023 ($ million)
- 5.4 Geography segment analysis 2019 - 2023
- Historic Market Size - Geography Segment 2019 - 2023 ($ million)
- 5.5 Country segment analysis 2019 - 2023
- Historic Market Size - Country Segment 2019 - 2023 ($ million)
6 Qualitative Analysis
- 6.1 The AI impact on global oligonucleotide synthesis market
7 Five Forces Analysis
- 7.1 Five forces summary
- Five forces analysis - Comparison between 2024 and 2029
- 7.2 Bargaining power of buyers
- Bargaining power of buyers - Impact of key factors 2024 and 2029
- 7.3 Bargaining power of suppliers
- Bargaining power of suppliers - Impact of key factors in 2024 and 2029
- 7.4 Threat of new entrants
- Threat of new entrants - Impact of key factors in 2024 and 2029
- 7.5 Threat of substitutes
- Threat of substitutes - Impact of key factors in 2024 and 2029
- 7.6 Threat of rivalry
- Threat of rivalry - Impact of key factors in 2024 and 2029
- 7.7 Market condition
- Chart on Market condition - Five forces 2024 and 2029
8 Market Segmentation by Application
- 8.1 Market segments
- Chart on Application - Market share 2024-2029 (%)
- Data Table on Application - Market share 2024-2029 (%)
- 8.2 Comparison by Application
- Chart on Comparison by Application
- Data Table on Comparison by Application
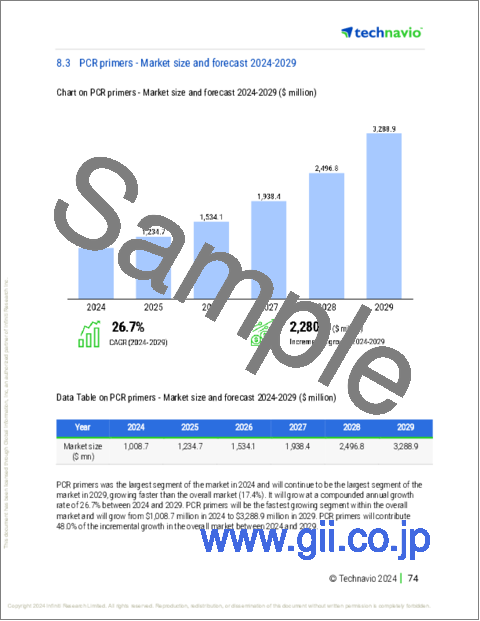
- 8.3 PCR primers - Market size and forecast 2024-2029
- Chart on PCR primers - Market size and forecast 2024-2029 ($ million)
- Data Table on PCR primers - Market size and forecast 2024-2029 ($ million)
- Chart on PCR primers - Year-over-year growth 2024-2029 (%)
- Data Table on PCR primers - Year-over-year growth 2024-2029 (%)
- 8.4 PCR assays and panels - Market size and forecast 2024-2029
- Chart on PCR assays and panels - Market size and forecast 2024-2029 ($ million)
- Data Table on PCR assays and panels - Market size and forecast 2024-2029 ($ million)
- Chart on PCR assays and panels - Year-over-year growth 2024-2029 (%)
- Data Table on PCR assays and panels - Year-over-year growth 2024-2029 (%)
- 8.5 DNA microarrays - Market size and forecast 2024-2029
- Chart on DNA microarrays - Market size and forecast 2024-2029 ($ million)
- Data Table on DNA microarrays - Market size and forecast 2024-2029 ($ million)
- Chart on DNA microarrays - Year-over-year growth 2024-2029 (%)
- Data Table on DNA microarrays - Year-over-year growth 2024-2029 (%)
- 8.6 Fluorescence in situ hybridization - Market size and forecast 2024-2029
- Chart on Fluorescence in situ hybridization - Market size and forecast 2024-2029 ($ million)
- Data Table on Fluorescence in situ hybridization - Market size and forecast 2024-2029 ($ million)
- Chart on Fluorescence in situ hybridization - Year-over-year growth 2024-2029 (%)
- Data Table on Fluorescence in situ hybridization - Year-over-year growth 2024-2029 (%)
- 8.7 Others - Market size and forecast 2024-2029
- Chart on Others - Market size and forecast 2024-2029 ($ million)
- Data Table on Others - Market size and forecast 2024-2029 ($ million)
- Chart on Others - Year-over-year growth 2024-2029 (%)
- Data Table on Others - Year-over-year growth 2024-2029 (%)
- 8.8 Market opportunity by Application
- Market opportunity by Application ($ million)
- Data Table on Market opportunity by Application ($ million)
9 Market Segmentation by End-user
- 9.1 Market segments
- Chart on End-user - Market share 2024-2029 (%)
- Data Table on End-user - Market share 2024-2029 (%)
- 9.2 Comparison by End-user
- Chart on Comparison by End-user
- Data Table on Comparison by End-user
- 9.3 Pharmaceutical and biotechnology companies - Market size and forecast 2024-2029
- Chart on Pharmaceutical and biotechnology companies - Market size and forecast 2024-2029 ($ million)
- Data Table on Pharmaceutical and biotechnology companies - Market size and forecast 2024-2029 ($ million)
- Chart on Pharmaceutical and biotechnology companies - Year-over-year growth 2024-2029 (%)
- Data Table on Pharmaceutical and biotechnology companies - Year-over-year growth 2024-2029 (%)
- 9.4 Research and academic institutes - Market size and forecast 2024-2029
- Chart on Research and academic institutes - Market size and forecast 2024-2029 ($ million)
- Data Table on Research and academic institutes - Market size and forecast 2024-2029 ($ million)
- Chart on Research and academic institutes - Year-over-year growth 2024-2029 (%)
- Data Table on Research and academic institutes - Year-over-year growth 2024-2029 (%)
- 9.5 Diagnostic laboratories - Market size and forecast 2024-2029
- Chart on Diagnostic laboratories - Market size and forecast 2024-2029 ($ million)
- Data Table on Diagnostic laboratories - Market size and forecast 2024-2029 ($ million)
- Chart on Diagnostic laboratories - Year-over-year growth 2024-2029 (%)
- Data Table on Diagnostic laboratories - Year-over-year growth 2024-2029 (%)
- 9.6 Hospitals - Market size and forecast 2024-2029
- Chart on Hospitals - Market size and forecast 2024-2029 ($ million)
- Data Table on Hospitals - Market size and forecast 2024-2029 ($ million)
- Chart on Hospitals - Year-over-year growth 2024-2029 (%)
- Data Table on Hospitals - Year-over-year growth 2024-2029 (%)
- 9.7 Market opportunity by End-user
- Market opportunity by End-user ($ million)
- Data Table on Market opportunity by End-user ($ million)
10 Customer Landscape
- 10.1 Customer landscape overview
- Analysis of price sensitivity, lifecycle, customer purchase basket, adoption rates, and purchase criteria
11 Geographic Landscape
- 11.1 Geographic segmentation
- Chart on Market share By Geographical Landscape 2024-2029 (%)
- Data Table on Market share By Geographical Landscape 2024-2029 (%)
- 11.2 Geographic comparison
- Chart on Geographic comparison
- Data Table on Geographic comparison
- 11.3 North America - Market size and forecast 2024-2029
- Chart on North America - Market size and forecast 2024-2029 ($ million)
- Data Table on North America - Market size and forecast 2024-2029 ($ million)
- Chart on North America - Year-over-year growth 2024-2029 (%)
- Data Table on North America - Year-over-year growth 2024-2029 (%)
- 11.4 Europe - Market size and forecast 2024-2029
- Chart on Europe - Market size and forecast 2024-2029 ($ million)
- Data Table on Europe - Market size and forecast 2024-2029 ($ million)
- Chart on Europe - Year-over-year growth 2024-2029 (%)
- Data Table on Europe - Year-over-year growth 2024-2029 (%)
- 11.5 Asia - Market size and forecast 2024-2029
- Chart on Asia - Market size and forecast 2024-2029 ($ million)
- Data Table on Asia - Market size and forecast 2024-2029 ($ million)
- Chart on Asia - Year-over-year growth 2024-2029 (%)
- Data Table on Asia - Year-over-year growth 2024-2029 (%)
- 11.6 Rest of World (ROW) - Market size and forecast 2024-2029
- Chart on Rest of World (ROW) - Market size and forecast 2024-2029 ($ million)
- Data Table on Rest of World (ROW) - Market size and forecast 2024-2029 ($ million)
- Chart on Rest of World (ROW) - Year-over-year growth 2024-2029 (%)
- Data Table on Rest of World (ROW) - Year-over-year growth 2024-2029 (%)
- 11.7 US - Market size and forecast 2024-2029
- Chart on US - Market size and forecast 2024-2029 ($ million)
- Data Table on US - Market size and forecast 2024-2029 ($ million)
- Chart on US - Year-over-year growth 2024-2029 (%)
- Data Table on US - Year-over-year growth 2024-2029 (%)
- 11.8 China - Market size and forecast 2024-2029
- Chart on China - Market size and forecast 2024-2029 ($ million)
- Data Table on China - Market size and forecast 2024-2029 ($ million)
- Chart on China - Year-over-year growth 2024-2029 (%)
- Data Table on China - Year-over-year growth 2024-2029 (%)
- 11.9 Germany - Market size and forecast 2024-2029
- Chart on Germany - Market size and forecast 2024-2029 ($ million)
- Data Table on Germany - Market size and forecast 2024-2029 ($ million)
- Chart on Germany - Year-over-year growth 2024-2029 (%)
- Data Table on Germany - Year-over-year growth 2024-2029 (%)
- 11.10 Canada - Market size and forecast 2024-2029
- Chart on Canada - Market size and forecast 2024-2029 ($ million)
- Data Table on Canada - Market size and forecast 2024-2029 ($ million)
- Chart on Canada - Year-over-year growth 2024-2029 (%)
- Data Table on Canada - Year-over-year growth 2024-2029 (%)
- 11.11 UK - Market size and forecast 2024-2029
- Chart on UK - Market size and forecast 2024-2029 ($ million)
- Data Table on UK - Market size and forecast 2024-2029 ($ million)
- Chart on UK - Year-over-year growth 2024-2029 (%)
- Data Table on UK - Year-over-year growth 2024-2029 (%)
- 11.12 Japan - Market size and forecast 2024-2029
- Chart on Japan - Market size and forecast 2024-2029 ($ million)
- Data Table on Japan - Market size and forecast 2024-2029 ($ million)
- Chart on Japan - Year-over-year growth 2024-2029 (%)
- Data Table on Japan - Year-over-year growth 2024-2029 (%)
- 11.13 France - Market size and forecast 2024-2029
- Chart on France - Market size and forecast 2024-2029 ($ million)
- Data Table on France - Market size and forecast 2024-2029 ($ million)
- Chart on France - Year-over-year growth 2024-2029 (%)
- Data Table on France - Year-over-year growth 2024-2029 (%)
- 11.14 Italy - Market size and forecast 2024-2029
- Chart on Italy - Market size and forecast 2024-2029 ($ million)
- Data Table on Italy - Market size and forecast 2024-2029 ($ million)
- Chart on Italy - Year-over-year growth 2024-2029 (%)
- Data Table on Italy - Year-over-year growth 2024-2029 (%)
- 11.15 India - Market size and forecast 2024-2029
- Chart on India - Market size and forecast 2024-2029 ($ million)
- Data Table on India - Market size and forecast 2024-2029 ($ million)
- Chart on India - Year-over-year growth 2024-2029 (%)
- Data Table on India - Year-over-year growth 2024-2029 (%)
- 11.16 South Korea - Market size and forecast 2024-2029
- Chart on South Korea - Market size and forecast 2024-2029 ($ million)
- Data Table on South Korea - Market size and forecast 2024-2029 ($ million)
- Chart on South Korea - Year-over-year growth 2024-2029 (%)
- Data Table on South Korea - Year-over-year growth 2024-2029 (%)
- 11.17 Market opportunity By Geographical Landscape
- Market opportunity By Geographical Landscape ($ million)
- Data Tables on Market opportunity By Geographical Landscape ($ million)
12 Drivers, Challenges, and Opportunity/Restraints
- 12.1 Market drivers
- 12.2 Market challenges
- 12.3 Impact of drivers and challenges
- Impact of drivers and challenges in 2024 and 2029
- 12.4 Market opportunities/restraints
13 Competitive Landscape
- 13.1 Overview
- 13.2 Competitive Landscape
- Overview on criticality of inputs and factors of differentiation
- 13.3 Landscape disruption
- Overview on factors of disruption
- 13.4 Industry risks
- Impact of key risks on business
14 Competitive Analysis
- 14.1 Companies profiled
- Companies covered
- 14.2 Company ranking index
- Company ranking index
- 14.3 Market positioning of companies
- Matrix on companies position and classification
- 14.4 Agilent Technologies Inc.
- Agilent Technologies Inc. - Overview
- Agilent Technologies Inc. - Business segments
- Agilent Technologies Inc. - Key news
- Agilent Technologies Inc. - Key offerings
- Agilent Technologies Inc. - Segment focus
- SWOT
- 14.5 Ansa Biotechnologies
- Ansa Biotechnologies - Overview
- Ansa Biotechnologies - Product / Service
- Ansa Biotechnologies - Key offerings
- SWOT
- 14.6 Biogen Inc.
- Biogen Inc. - Overview
- Biogen Inc. - Product / Service
- Biogen Inc. - Key news
- Biogen Inc. - Key offerings
- SWOT
- 14.7 Biotage AB
- Biotage AB - Overview
- Biotage AB - Product / Service
- Biotage AB - Key offerings
- SWOT
- 14.8 Danaher Corp.
- Danaher Corp. - Overview
- Danaher Corp. - Business segments
- Danaher Corp. - Key news
- Danaher Corp. - Key offerings
- Danaher Corp. - Segment focus
- SWOT
- 14.9 General Electric Co.
- General Electric Co. - Overview
- General Electric Co. - Business segments
- General Electric Co. - Key news
- General Electric Co. - Key offerings
- General Electric Co. - Segment focus
- SWOT
- 14.10 Kaneka Corp.
- Kaneka Corp. - Overview
- Kaneka Corp. - Business segments
- Kaneka Corp. - Key news
- Kaneka Corp. - Key offerings
- Kaneka Corp. - Segment focus
- SWOT
- 14.11 LGC Science Group Holdings Ltd.
- LGC Science Group Holdings Ltd. - Overview
- LGC Science Group Holdings Ltd. - Product / Service
- LGC Science Group Holdings Ltd. - Key offerings
- SWOT
- 14.12 Merck KGaA
- Merck KGaA - Overview
- Merck KGaA - Business segments
- Merck KGaA - Key news
- Merck KGaA - Key offerings
- Merck KGaA - Segment focus
- SWOT
- 14.13 Mettler Toledo International Inc.
- Mettler Toledo International Inc. - Overview
- Mettler Toledo International Inc. - Business segments
- Mettler Toledo International Inc. - Key news
- Mettler Toledo International Inc. - Key offerings
- Mettler Toledo International Inc. - Segment focus
- SWOT
- 14.14 QIAGEN N.V.
- QIAGEN N.V. - Overview
- QIAGEN N.V. - Product / Service
- QIAGEN N.V. - Key news
- QIAGEN N.V. - Key offerings
- SWOT
- 14.15 Sarepta Therapeutics Inc.
- Sarepta Therapeutics Inc. - Overview
- Sarepta Therapeutics Inc. - Product / Service
- Sarepta Therapeutics Inc. - Key offerings
- SWOT
- 14.16 Synbio Technologies LLC
- Synbio Technologies LLC - Overview
- Synbio Technologies LLC - Product / Service
- Synbio Technologies LLC - Key offerings
- SWOT
- 14.17 Syngene International Ltd.
- Syngene International Ltd. - Overview
- Syngene International Ltd. - Product / Service
- Syngene International Ltd. - Key offerings
- SWOT
- 14.18 Thermo Fisher Scientific Inc.
- Thermo Fisher Scientific Inc. - Overview
- Thermo Fisher Scientific Inc. - Business segments
- Thermo Fisher Scientific Inc. - Key news
- Thermo Fisher Scientific Inc. - Key offerings
- Thermo Fisher Scientific Inc. - Segment focus
- SWOT
15 Appendix
- 15.1 Scope of the report
- 15.2 Inclusions and exclusions checklist
- Inclusions checklist
- Exclusions checklist
- 15.3 Currency conversion rates for US$
- Currency conversion rates for US$
- 15.4 Research methodology
- Research methodology
- 15.5 Data procurement
- Information sources
- 15.6 Data validation
- Data validation
- 15.7 Validation techniques employed for market sizing
- Validation techniques employed for market sizing
- 15.8 Data synthesis
- Data synthesis
- 15.9 360 degree market analysis
- 360 degree market analysis
- 15.10 List of abbreviations
- List of abbreviations

