市場調査レポート
商品コード
1634302

パブリッククラウドサービスの世界市場(2025年~2029年)

Global Public Cloud Services Market 2025-2029


出版日
発行
TechNavio
ページ情報
英文 209 Pages
納期
即納可能 即納可能とは
カスタマイズ可能
価格
価格表記: USDを日本円(税抜)に換算
本日の銀行送金レート: 1USD=143.57円
パブリッククラウドサービスの世界市場(2025年~2029年)
出版日: 2025年01月07日
発行: TechNavio
ページ情報: 英文 209 Pages
納期: 即納可能 即納可能とは
GIIご利用のメリット
  • 全表示
  • 概要
  • 図表
  • 目次
概要

パブリッククラウドサービス市場(2025年~2029年)

世界のパブリッククラウドサービスの市場規模は、2024年~2029年に1兆7,077億米ドルに達し、予測期間中のCAGRは23.1%で成長すると予測されます。当レポートでは、パブリッククラウドサービス市場の全体的な分析、市場規模・予測、動向、成長促進要因、課題、約25のベンダーを網羅したベンダー分析などを掲載しています。

本レポートは、現在の市場シナリオ、最新動向と促進要因、市場環境全体に関する最新分析を提供しています。市場は、データセンターのハイパースケールプロバイダーやコロケーションプロバイダーの増加、ハードウェアへの資本支出削減へのシフト、IoT、ML、ビッグデータ技術の採用増加などが牽引しています。

市場範囲
基準年 2025年
終了年 2029年
予測期間 2025年~2029年
成長モメンタム 加速
前年比2025年 22.3%
CAGR 23.1%
増分額 1兆7,077億米ドル

本調査では、市場参入企業間の戦略的パートナーシップやコラボレーションが、今後数年間のパブリッククラウドサービス市場の成長を促進する主要因の1つであると分析しています。また、サーバー仮想化へのシフトやクラウドによるディザスタリカバリの簡素化も、市場の大きな需要につながると思われます。

目次

第1章 エグゼクティブサマリー

  • 市場概要

第2章 Technavioの分析

  • 価格感度・ライフサイクル・顧客購入バスケット・採用率・購入基準の分析
  • インプットの重要性と差別化の要因
  • ディスラプションの要因
  • 促進要因と課題の影響

第3章 市場情勢

  • 市場エコシステム
  • 市場の特徴
  • バリューチェーン分析

第4章 市場規模

  • 市場の定義
  • 市場セグメント分析
  • 市場規模(2024年)
  • 市場の見通し(2024年~2029年)

第5章 市場規模実績

  • パブリッククラウドサービスの世界市場(2019年~2023年)
  • サービスセグメント分析(2019年~2023年)
  • タイプセグメント分析(2019年~2023年)
  • 地域セグメント分析(2019年~2023年)
  • 国セグメント分析(2019年~2023年)

第6章 定性分析

  • AIの影響:パブリッククラウドサービスの世界市場

第7章 ファイブフォース分析

  • ファイブフォースの要約
  • 買い手の交渉力
  • 供給企業の交渉力
  • 新規参入業者の脅威
  • 代替品の脅威
  • 競争の脅威
  • 市況

第8章 市場セグメンテーション:サービス別

  • 市場セグメント
  • 比較:サービス別
  • SaaS:市場規模と予測(2024年~2029年)
  • IaaS:市場規模と予測(2024年~2029年)
  • PaaS:市場規模と予測(2024年~2029年)
  • 市場機会:サービス別

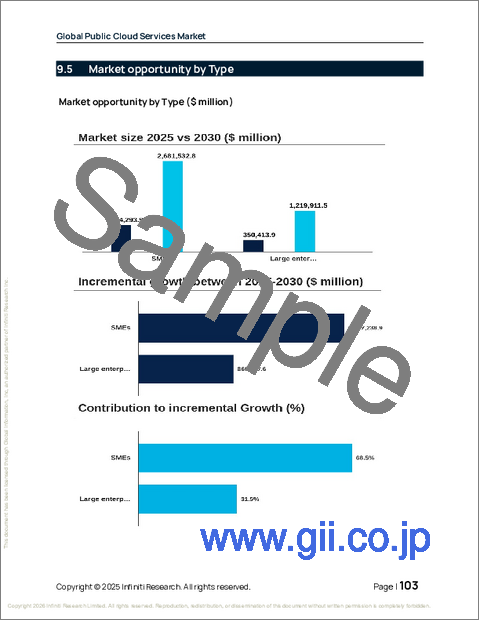
第9章 市場セグメンテーション:タイプ別

  • 市場セグメント
  • 比較:タイプ別
  • 中小企業:市場規模と予測(2024年~2029年)
  • 大企業:市場規模と予測(2024年~2029年)
  • 市場機会:タイプ別

第10章 顧客情勢

  • 顧客情勢の概要

第11章 地域別情勢

  • 地域別セグメンテーション
  • 地域別比較
  • 北米:市場規模と予測(2024年~2029年)
  • 欧州:市場規模と予測(2024年~2029年)
  • アジア太平洋:市場規模と予測(2024年~2029年)
  • 南米:市場規模と予測(2024年~2029年)
  • 中東・アフリカ:市場規模と予測(2024年~2029年)
  • 米国:市場規模と予測(2024年~2029年)
  • カナダ:市場規模と予測(2024年~2029年)
  • 中国:市場規模と予測(2024年~2029年)
  • ドイツ:市場規模と予測(2024年~2029年)
  • 英国:市場規模と予測(2024年~2029年)
  • インド:市場規模と予測(2024年~2029年)
  • フランス:市場規模と予測(2024年~2029年)
  • 日本:市場規模と予測(2024年~2029年)
  • イタリア:市場規模と予測(2024年~2029年)
  • ブラジル:市場規模と予測(2024年~2029年)
  • 市場機会:地域情勢別

第12章 促進要因・課題・機会・抑制要因

  • 市場促進要因
  • 市場の課題
  • 促進要因と課題の影響
  • 市場の機会・抑制要因

第13章 競合情勢

  • 概要
  • 競合情勢
  • ディスラプションの状況
  • 業界のリスク

第14章 競合分析

  • 企業プロファイル
  • 企業ランキング指数
  • 企業の市場ポジショニング
  • Adobe Inc.
  • Alibaba Group Holding Ltd.
  • Alphabet Inc.
  • Amazon.com Inc.
  • Cisco Systems Inc.
  • Dell Technologies Inc.
  • Hewlett Packard Enterprise Co.
  • International Business Machines Corp.
  • Microsoft Corp.
  • Oracle Corp.
  • Rackspace Technology Inc.
  • Salesforce Inc.
  • SAP SE
  • VMware Inc.
  • Workday Inc.

第15章 付録

図表

Exhibits:

  • Exhibits1: Executive Summary - Chart on Market Overview
  • Exhibits2: Executive Summary - Data Table on Market Overview
  • Exhibits3: Executive Summary - Chart on Global Market Characteristics
  • Exhibits4: Executive Summary - Chart on Market By Geographical Landscape
  • Exhibits5: Executive Summary - Chart on Market Segmentation by Service
  • Exhibits6: Executive Summary - Chart on Market Segmentation by Type
  • Exhibits7: Executive Summary - Chart on Incremental Growth
  • Exhibits8: Executive Summary - Data Table on Incremental Growth
  • Exhibits9: Executive Summary - Chart on Company Market Positioning
  • Exhibits10: Analysis of price sensitivity, lifecycle, customer purchase basket, adoption rates, and purchase criteria
  • Exhibits11: Overview on criticality of inputs and factors of differentiation
  • Exhibits12: Overview on factors of disruption
  • Exhibits13: Impact of drivers and challenges in 2024 and 2029
  • Exhibits14: Parent Market
  • Exhibits15: Data Table on - Parent Market
  • Exhibits16: Market characteristics analysis
  • Exhibits17: Value chain analysis
  • Exhibits18: Offerings of companies included in the market definition
  • Exhibits19: Market segments
  • Exhibits20: Chart on Global - Market size and forecast 2024-2029 ($ billion)
  • Exhibits21: Data Table on Global - Market size and forecast 2024-2029 ($ billion)
  • Exhibits22: Chart on Global Market: Year-over-year growth 2024-2029 (%)
  • Exhibits23: Data Table on Global Market: Year-over-year growth 2024-2029 (%)
  • Exhibits24: Historic Market Size - Data Table on Global Public Cloud Services Market 2019 - 2023 ($ billion)
  • Exhibits25: Historic Market Size - Service Segment 2019 - 2023 ($ billion)
  • Exhibits26: Historic Market Size - Type Segment 2019 - 2023 ($ billion)
  • Exhibits27: Historic Market Size - Geography Segment 2019 - 2023 ($ billion)
  • Exhibits28: Historic Market Size - Country Segment 2019 - 2023 ($ billion)
  • Exhibits29: Five forces analysis - Comparison between 2024 and 2029
  • Exhibits30: Bargaining power of buyers - Impact of key factors 2024 and 2029
  • Exhibits31: Bargaining power of suppliers - Impact of key factors in 2024 and 2029
  • Exhibits32: Threat of new entrants - Impact of key factors in 2024 and 2029
  • Exhibits33: Threat of substitutes - Impact of key factors in 2024 and 2029
  • Exhibits34: Threat of rivalry - Impact of key factors in 2024 and 2029
  • Exhibits35: Chart on Market condition - Five forces 2024 and 2029
  • Exhibits36: Chart on Service - Market share 2024-2029 (%)
  • Exhibits37: Data Table on Service - Market share 2024-2029 (%)
  • Exhibits38: Chart on Comparison by Service
  • Exhibits39: Data Table on Comparison by Service
  • Exhibits40: Chart on SaaS - Market size and forecast 2024-2029 ($ billion)
  • Exhibits41: Data Table on SaaS - Market size and forecast 2024-2029 ($ billion)
  • Exhibits42: Chart on SaaS - Year-over-year growth 2024-2029 (%)
  • Exhibits43: Data Table on SaaS - Year-over-year growth 2024-2029 (%)
  • Exhibits44: Chart on IaaS - Market size and forecast 2024-2029 ($ billion)
  • Exhibits45: Data Table on IaaS - Market size and forecast 2024-2029 ($ billion)
  • Exhibits46: Chart on IaaS - Year-over-year growth 2024-2029 (%)
  • Exhibits47: Data Table on IaaS - Year-over-year growth 2024-2029 (%)
  • Exhibits48: Chart on PaaS - Market size and forecast 2024-2029 ($ billion)
  • Exhibits49: Data Table on PaaS - Market size and forecast 2024-2029 ($ billion)
  • Exhibits50: Chart on PaaS - Year-over-year growth 2024-2029 (%)
  • Exhibits51: Data Table on PaaS - Year-over-year growth 2024-2029 (%)
  • Exhibits52: Market opportunity by Service ($ billion)
  • Exhibits53: Data Table on Market opportunity by Service ($ billion)
  • Exhibits54: Chart on Type - Market share 2024-2029 (%)
  • Exhibits55: Data Table on Type - Market share 2024-2029 (%)
  • Exhibits56: Chart on Comparison by Type
  • Exhibits57: Data Table on Comparison by Type
  • Exhibits58: Chart on SMEs - Market size and forecast 2024-2029 ($ billion)
  • Exhibits59: Data Table on SMEs - Market size and forecast 2024-2029 ($ billion)
  • Exhibits60: Chart on SMEs - Year-over-year growth 2024-2029 (%)
  • Exhibits61: Data Table on SMEs - Year-over-year growth 2024-2029 (%)
  • Exhibits62: Chart on Large enterprise - Market size and forecast 2024-2029 ($ billion)
  • Exhibits63: Data Table on Large enterprise - Market size and forecast 2024-2029 ($ billion)
  • Exhibits64: Chart on Large enterprise - Year-over-year growth 2024-2029 (%)
  • Exhibits65: Data Table on Large enterprise - Year-over-year growth 2024-2029 (%)
  • Exhibits66: Market opportunity by Type ($ billion)
  • Exhibits67: Data Table on Market opportunity by Type ($ billion)
  • Exhibits68: Analysis of price sensitivity, lifecycle, customer purchase basket, adoption rates, and purchase criteria
  • Exhibits69: Chart on Market share By Geographical Landscape 2024-2029 (%)
  • Exhibits70: Data Table on Market share By Geographical Landscape 2024-2029 (%)
  • Exhibits71: Chart on Geographic comparison
  • Exhibits72: Data Table on Geographic comparison
  • Exhibits73: Chart on North America - Market size and forecast 2024-2029 ($ billion)
  • Exhibits74: Data Table on North America - Market size and forecast 2024-2029 ($ billion)
  • Exhibits75: Chart on North America - Year-over-year growth 2024-2029 (%)
  • Exhibits76: Data Table on North America - Year-over-year growth 2024-2029 (%)
  • Exhibits77: Chart on Europe - Market size and forecast 2024-2029 ($ billion)
  • Exhibits78: Data Table on Europe - Market size and forecast 2024-2029 ($ billion)
  • Exhibits79: Chart on Europe - Year-over-year growth 2024-2029 (%)
  • Exhibits80: Data Table on Europe - Year-over-year growth 2024-2029 (%)
  • Exhibits81: Chart on APAC - Market size and forecast 2024-2029 ($ billion)
  • Exhibits82: Data Table on APAC - Market size and forecast 2024-2029 ($ billion)
  • Exhibits83: Chart on APAC - Year-over-year growth 2024-2029 (%)
  • Exhibits84: Data Table on APAC - Year-over-year growth 2024-2029 (%)
  • Exhibits85: Chart on South America - Market size and forecast 2024-2029 ($ billion)
  • Exhibits86: Data Table on South America - Market size and forecast 2024-2029 ($ billion)
  • Exhibits87: Chart on South America - Year-over-year growth 2024-2029 (%)
  • Exhibits88: Data Table on South America - Year-over-year growth 2024-2029 (%)
  • Exhibits89: Chart on Middle East and Africa - Market size and forecast 2024-2029 ($ billion)
  • Exhibits90: Data Table on Middle East and Africa - Market size and forecast 2024-2029 ($ billion)
  • Exhibits91: Chart on Middle East and Africa - Year-over-year growth 2024-2029 (%)
  • Exhibits92: Data Table on Middle East and Africa - Year-over-year growth 2024-2029 (%)
  • Exhibits93: Chart on US - Market size and forecast 2024-2029 ($ billion)
  • Exhibits94: Data Table on US - Market size and forecast 2024-2029 ($ billion)
  • Exhibits95: Chart on US - Year-over-year growth 2024-2029 (%)
  • Exhibits96: Data Table on US - Year-over-year growth 2024-2029 (%)
  • Exhibits97: Chart on Canada - Market size and forecast 2024-2029 ($ billion)
  • Exhibits98: Data Table on Canada - Market size and forecast 2024-2029 ($ billion)
  • Exhibits99: Chart on Canada - Year-over-year growth 2024-2029 (%)
  • Exhibits100: Data Table on Canada - Year-over-year growth 2024-2029 (%)
  • Exhibits101: Chart on China - Market size and forecast 2024-2029 ($ billion)
  • Exhibits102: Data Table on China - Market size and forecast 2024-2029 ($ billion)
  • Exhibits103: Chart on China - Year-over-year growth 2024-2029 (%)
  • Exhibits104: Data Table on China - Year-over-year growth 2024-2029 (%)
  • Exhibits105: Chart on Germany - Market size and forecast 2024-2029 ($ billion)
  • Exhibits106: Data Table on Germany - Market size and forecast 2024-2029 ($ billion)
  • Exhibits107: Chart on Germany - Year-over-year growth 2024-2029 (%)
  • Exhibits108: Data Table on Germany - Year-over-year growth 2024-2029 (%)
  • Exhibits109: Chart on UK - Market size and forecast 2024-2029 ($ billion)
  • Exhibits110: Data Table on UK - Market size and forecast 2024-2029 ($ billion)
  • Exhibits111: Chart on UK - Year-over-year growth 2024-2029 (%)
  • Exhibits112: Data Table on UK - Year-over-year growth 2024-2029 (%)
  • Exhibits113: Chart on India - Market size and forecast 2024-2029 ($ billion)
  • Exhibits114: Data Table on India - Market size and forecast 2024-2029 ($ billion)
  • Exhibits115: Chart on India - Year-over-year growth 2024-2029 (%)
  • Exhibits116: Data Table on India - Year-over-year growth 2024-2029 (%)
  • Exhibits117: Chart on France - Market size and forecast 2024-2029 ($ billion)
  • Exhibits118: Data Table on France - Market size and forecast 2024-2029 ($ billion)
  • Exhibits119: Chart on France - Year-over-year growth 2024-2029 (%)
  • Exhibits120: Data Table on France - Year-over-year growth 2024-2029 (%)
  • Exhibits121: Chart on Japan - Market size and forecast 2024-2029 ($ billion)
  • Exhibits122: Data Table on Japan - Market size and forecast 2024-2029 ($ billion)
  • Exhibits123: Chart on Japan - Year-over-year growth 2024-2029 (%)
  • Exhibits124: Data Table on Japan - Year-over-year growth 2024-2029 (%)
  • Exhibits125: Chart on Italy - Market size and forecast 2024-2029 ($ billion)
  • Exhibits126: Data Table on Italy - Market size and forecast 2024-2029 ($ billion)
  • Exhibits127: Chart on Italy - Year-over-year growth 2024-2029 (%)
  • Exhibits128: Data Table on Italy - Year-over-year growth 2024-2029 (%)
  • Exhibits129: Chart on Brazil - Market size and forecast 2024-2029 ($ billion)
  • Exhibits130: Data Table on Brazil - Market size and forecast 2024-2029 ($ billion)
  • Exhibits131: Chart on Brazil - Year-over-year growth 2024-2029 (%)
  • Exhibits132: Data Table on Brazil - Year-over-year growth 2024-2029 (%)
  • Exhibits133: Market opportunity By Geographical Landscape ($ billion)
  • Exhibits134: Data Tables on Market opportunity By Geographical Landscape ($ billion)
  • Exhibits135: Impact of drivers and challenges in 2024 and 2029
  • Exhibits136: Overview on criticality of inputs and factors of differentiation
  • Exhibits137: Overview on factors of disruption
  • Exhibits138: Impact of key risks on business
  • Exhibits139: Companies covered
  • Exhibits140: Company ranking index
  • Exhibits141: Matrix on companies position and classification
  • Exhibits142: Adobe Inc. - Overview
  • Exhibits143: Adobe Inc. - Business segments
  • Exhibits144: Adobe Inc. - Key news
  • Exhibits145: Adobe Inc. - Key offerings
  • Exhibits146: Adobe Inc. - Segment focus
  • Exhibits147: SWOT
  • Exhibits148: Alibaba Group Holding Ltd. - Overview
  • Exhibits149: Alibaba Group Holding Ltd. - Business segments
  • Exhibits150: Alibaba Group Holding Ltd. - Key news
  • Exhibits151: Alibaba Group Holding Ltd. - Key offerings
  • Exhibits152: Alibaba Group Holding Ltd. - Segment focus
  • Exhibits153: SWOT
  • Exhibits154: Alphabet Inc. - Overview
  • Exhibits155: Alphabet Inc. - Business segments
  • Exhibits156: Alphabet Inc. - Key offerings
  • Exhibits157: Alphabet Inc. - Segment focus
  • Exhibits158: SWOT
  • Exhibits159: Amazon.com Inc. - Overview
  • Exhibits160: Amazon.com Inc. - Business segments
  • Exhibits161: Amazon.com Inc. - Key news
  • Exhibits162: Amazon.com Inc. - Key offerings
  • Exhibits163: Amazon.com Inc. - Segment focus
  • Exhibits164: SWOT
  • Exhibits165: Cisco Systems Inc. - Overview
  • Exhibits166: Cisco Systems Inc. - Business segments
  • Exhibits167: Cisco Systems Inc. - Key news
  • Exhibits168: Cisco Systems Inc. - Key offerings
  • Exhibits169: Cisco Systems Inc. - Segment focus
  • Exhibits170: SWOT
  • Exhibits171: Dell Technologies Inc. - Overview
  • Exhibits172: Dell Technologies Inc. - Business segments
  • Exhibits173: Dell Technologies Inc. - Key news
  • Exhibits174: Dell Technologies Inc. - Key offerings
  • Exhibits175: Dell Technologies Inc. - Segment focus
  • Exhibits176: SWOT
  • Exhibits177: Hewlett Packard Enterprise Co. - Overview
  • Exhibits178: Hewlett Packard Enterprise Co. - Business segments
  • Exhibits179: Hewlett Packard Enterprise Co. - Key news
  • Exhibits180: Hewlett Packard Enterprise Co. - Key offerings
  • Exhibits181: Hewlett Packard Enterprise Co. - Segment focus
  • Exhibits182: SWOT
  • Exhibits183: International Business Machines Corp. - Overview
  • Exhibits184: International Business Machines Corp. - Business segments
  • Exhibits185: International Business Machines Corp. - Key news
  • Exhibits186: International Business Machines Corp. - Key offerings
  • Exhibits187: International Business Machines Corp. - Segment focus
  • Exhibits188: SWOT
  • Exhibits189: Microsoft Corp. - Overview
  • Exhibits190: Microsoft Corp. - Business segments
  • Exhibits191: Microsoft Corp. - Key news
  • Exhibits192: Microsoft Corp. - Key offerings
  • Exhibits193: Microsoft Corp. - Segment focus
  • Exhibits194: SWOT
  • Exhibits195: Oracle Corp. - Overview
  • Exhibits196: Oracle Corp. - Business segments
  • Exhibits197: Oracle Corp. - Key news
  • Exhibits198: Oracle Corp. - Key offerings
  • Exhibits199: Oracle Corp. - Segment focus
  • Exhibits200: SWOT
  • Exhibits201: Rackspace Technology Inc. - Overview
  • Exhibits202: Rackspace Technology Inc. - Business segments
  • Exhibits203: Rackspace Technology Inc. - Key news
  • Exhibits204: Rackspace Technology Inc. - Key offerings
  • Exhibits205: Rackspace Technology Inc. - Segment focus
  • Exhibits206: SWOT
  • Exhibits207: Salesforce Inc. - Overview
  • Exhibits208: Salesforce Inc. - Product / Service
  • Exhibits209: Salesforce Inc. - Key news
  • Exhibits210: Salesforce Inc. - Key offerings
  • Exhibits211: SWOT
  • Exhibits212: SAP SE - Overview
  • Exhibits213: SAP SE - Business segments
  • Exhibits214: SAP SE - Key news
  • Exhibits215: SAP SE - Key offerings
  • Exhibits216: SAP SE - Segment focus
  • Exhibits217: SWOT
  • Exhibits218: VMware Inc. - Overview
  • Exhibits219: VMware Inc. - Product / Service
  • Exhibits220: VMware Inc. - Key offerings
  • Exhibits221: SWOT
  • Exhibits222: Workday Inc. - Overview
  • Exhibits223: Workday Inc. - Product / Service
  • Exhibits224: Workday Inc. - Key news
  • Exhibits225: Workday Inc. - Key offerings
  • Exhibits226: SWOT
  • Exhibits227: Inclusions checklist
  • Exhibits228: Exclusions checklist
  • Exhibits229: Currency conversion rates for US$
  • Exhibits230: Research methodology
  • Exhibits231: Information sources
  • Exhibits232: Data validation
  • Exhibits233: Validation techniques employed for market sizing
  • Exhibits234: Data synthesis
  • Exhibits235: 360 degree market analysis
  • Exhibits236: List of abbreviations
目次
Product Code: IRTNTR43614

Public Cloud Services Market 2025-2029

The public cloud services market is forecasted to grow by USD 1707.7 bn during 2024-2029, accelerating at a CAGR of 23.1% during the forecast period. The report on the public cloud services market provides a holistic analysis, market size and forecast, trends, growth drivers, and challenges, as well as vendor analysis covering around 25 vendors.

The report offers an up-to-date analysis regarding the current market scenario, the latest trends and drivers, and the overall market environment. The market is driven by increasing number of data center hyperscale and colocation providers, shift toward reduced capital expenditures on it hardware, and increasing adoption of iot, ml, and big data technologies.

Market Scope
Base Year2025
End Year2029
Series Year2025-2029
Growth MomentumAccelerate
YOY 202522.3%
CAGR23.1%
Incremental Value$1707.7 bn

Technavio's public cloud services market is segmented as below:

By Service

    • SaaS
    • IaaS
    • PaaS

By Type

    • SMEs
    • Large enterprise

By Geographical Landscape

    • North America
    • Europe
    • APAC
    • South America
    • Middle East and Africa

This study identifies the strategic partnerships and collaborations among market participants as one of the prime reasons driving the public cloud services market growth during the next few years. Also, shift toward server virtualization and simplification of disaster recovery through cloud will lead to sizable demand in the market.

The report on the public cloud services market covers the following areas:

    • Public Cloud Services Market sizing
    • Public Cloud Services Market forecast
    • Public Cloud Services Market industry analysis

The robust vendor analysis is designed to help clients improve their market position, and in line with this, this report provides a detailed analysis of several leading public cloud services market vendors that include Adobe Inc., Alibaba Group Holding Ltd., Alphabet Inc., Amazon.com Inc., AT and T Inc., Cisco Systems Inc., Dell Technologies Inc., Fujitsu Ltd., Hewlett Packard Enterprise Co., International Business Machines Corp., Microsoft Corp., Oracle Corp., Rackspace Technology Inc., Salesforce Inc., SAP SE, ServiceNow Inc., Tencent Holdings Ltd., Verizon Communications Inc., VMware Inc., and Workday Inc.. Also, the public cloud services market analysis report includes information on upcoming trends and challenges that will influence market growth. This is to help companies strategize and leverage all forthcoming growth opportunities.

The study was conducted using an objective combination of primary and secondary information including inputs from key participants in the industry. The report contains a comprehensive market and vendor landscape in addition to an analysis of the key vendors.

The publisher presents a detailed picture of the market by the way of study, synthesis, and summation of data from multiple sources by an analysis of key parameters such as profit, pricing, competition, and promotions. It presents various market facets by identifying the key industry influencers. The data presented is comprehensive, reliable, and a result of extensive primary and secondary research. The market research reports provide a complete competitive landscape and an in-depth vendor selection methodology and analysis using qualitative and quantitative research to forecast accurate market growth.

Table of Contents

1 Executive Summary

  • 1.1 Market overview
    • Executive Summary - Chart on Market Overview
    • Executive Summary - Data Table on Market Overview
    • Executive Summary - Chart on Global Market Characteristics
    • Executive Summary - Chart on Market By Geographical Landscape
    • Executive Summary - Chart on Market Segmentation by Service
    • Executive Summary - Chart on Market Segmentation by Type
    • Executive Summary - Chart on Incremental Growth
    • Executive Summary - Data Table on Incremental Growth
    • Executive Summary - Chart on Company Market Positioning

2 Technavio Analysis

  • 2.1 Analysis of price sensitivity, lifecycle, customer purchase basket, adoption rates, and purchase criteria
    • Analysis of price sensitivity, lifecycle, customer purchase basket, adoption rates, and purchase criteria
  • 2.2 Criticality of inputs and Factors of differentiation
    • Overview on criticality of inputs and factors of differentiation
  • 2.3 Factors of disruption
    • Overview on factors of disruption
  • 2.4 Impact of drivers and challenges
    • Impact of drivers and challenges in 2024 and 2029

3 Market Landscape

  • 3.1 Market ecosystem
    • Parent Market
    • Data Table on - Parent Market
  • 3.2 Market characteristics
    • Market characteristics analysis
  • 3.3 Value chain analysis
    • Value chain analysis

4 Market Sizing

  • 4.1 Market definition
    • Offerings of companies included in the market definition
  • 4.2 Market segment analysis
    • Market segments
  • 4.3 Market size 2024
  • 4.4 Market outlook: Forecast for 2024-2029
    • Chart on Global - Market size and forecast 2024-2029 ($ billion)
    • Data Table on Global - Market size and forecast 2024-2029 ($ billion)
    • Chart on Global Market: Year-over-year growth 2024-2029 (%)
    • Data Table on Global Market: Year-over-year growth 2024-2029 (%)

5 Historic Market Size

  • 5.1 Global Public Cloud Services Market 2019 - 2023
    • Historic Market Size - Data Table on Global Public Cloud Services Market 2019 - 2023 ($ billion)
  • 5.2 Service segment analysis 2019 - 2023
    • Historic Market Size - Service Segment 2019 - 2023 ($ billion)
  • 5.3 Type segment analysis 2019 - 2023
    • Historic Market Size - Type Segment 2019 - 2023 ($ billion)
  • 5.4 Geography segment analysis 2019 - 2023
    • Historic Market Size - Geography Segment 2019 - 2023 ($ billion)
  • 5.5 Country segment analysis 2019 - 2023
    • Historic Market Size - Country Segment 2019 - 2023 ($ billion)

6 Qualitative Analysis

  • 6.1 Impact of AI On The Global Public Cloud Services Market

7 Five Forces Analysis

  • 7.1 Five forces summary
    • Five forces analysis - Comparison between 2024 and 2029
  • 7.2 Bargaining power of buyers
    • Bargaining power of buyers - Impact of key factors 2024 and 2029
  • 7.3 Bargaining power of suppliers
    • Bargaining power of suppliers - Impact of key factors in 2024 and 2029
  • 7.4 Threat of new entrants
    • Threat of new entrants - Impact of key factors in 2024 and 2029
  • 7.5 Threat of substitutes
    • Threat of substitutes - Impact of key factors in 2024 and 2029
  • 7.6 Threat of rivalry
    • Threat of rivalry - Impact of key factors in 2024 and 2029
  • 7.7 Market condition
    • Chart on Market condition - Five forces 2024 and 2029

8 Market Segmentation by Service

  • 8.1 Market segments
    • Chart on Service - Market share 2024-2029 (%)
    • Data Table on Service - Market share 2024-2029 (%)
  • 8.2 Comparison by Service
    • Chart on Comparison by Service
    • Data Table on Comparison by Service
  • 8.3 SaaS - Market size and forecast 2024-2029
    • Chart on SaaS - Market size and forecast 2024-2029 ($ billion)
    • Data Table on SaaS - Market size and forecast 2024-2029 ($ billion)
    • Chart on SaaS - Year-over-year growth 2024-2029 (%)
    • Data Table on SaaS - Year-over-year growth 2024-2029 (%)
  • 8.4 IaaS - Market size and forecast 2024-2029
    • Chart on IaaS - Market size and forecast 2024-2029 ($ billion)
    • Data Table on IaaS - Market size and forecast 2024-2029 ($ billion)
    • Chart on IaaS - Year-over-year growth 2024-2029 (%)
    • Data Table on IaaS - Year-over-year growth 2024-2029 (%)
  • 8.5 PaaS - Market size and forecast 2024-2029
    • Chart on PaaS - Market size and forecast 2024-2029 ($ billion)
    • Data Table on PaaS - Market size and forecast 2024-2029 ($ billion)
    • Chart on PaaS - Year-over-year growth 2024-2029 (%)
    • Data Table on PaaS - Year-over-year growth 2024-2029 (%)
  • 8.6 Market opportunity by Service
    • Market opportunity by Service ($ billion)
    • Data Table on Market opportunity by Service ($ billion)

9 Market Segmentation by Type

  • 9.1 Market segments
    • Chart on Type - Market share 2024-2029 (%)
    • Data Table on Type - Market share 2024-2029 (%)
  • 9.2 Comparison by Type
    • Chart on Comparison by Type
    • Data Table on Comparison by Type
  • 9.3 SMEs - Market size and forecast 2024-2029
    • Chart on SMEs - Market size and forecast 2024-2029 ($ billion)
    • Data Table on SMEs - Market size and forecast 2024-2029 ($ billion)
    • Chart on SMEs - Year-over-year growth 2024-2029 (%)
    • Data Table on SMEs - Year-over-year growth 2024-2029 (%)
  • 9.4 Large enterprise - Market size and forecast 2024-2029
    • Chart on Large enterprise - Market size and forecast 2024-2029 ($ billion)
    • Data Table on Large enterprise - Market size and forecast 2024-2029 ($ billion)
    • Chart on Large enterprise - Year-over-year growth 2024-2029 (%)
    • Data Table on Large enterprise - Year-over-year growth 2024-2029 (%)
  • 9.5 Market opportunity by Type
    • Market opportunity by Type ($ billion)
    • Data Table on Market opportunity by Type ($ billion)

10 Customer Landscape

  • 10.1 Customer landscape overview
    • Analysis of price sensitivity, lifecycle, customer purchase basket, adoption rates, and purchase criteria

11 Geographic Landscape

  • 11.1 Geographic segmentation
    • Chart on Market share By Geographical Landscape 2024-2029 (%)
    • Data Table on Market share By Geographical Landscape 2024-2029 (%)
  • 11.2 Geographic comparison
    • Chart on Geographic comparison
    • Data Table on Geographic comparison
  • 11.3 North America - Market size and forecast 2024-2029
    • Chart on North America - Market size and forecast 2024-2029 ($ billion)
    • Data Table on North America - Market size and forecast 2024-2029 ($ billion)
    • Chart on North America - Year-over-year growth 2024-2029 (%)
    • Data Table on North America - Year-over-year growth 2024-2029 (%)
  • 11.4 Europe - Market size and forecast 2024-2029
    • Chart on Europe - Market size and forecast 2024-2029 ($ billion)
    • Data Table on Europe - Market size and forecast 2024-2029 ($ billion)
    • Chart on Europe - Year-over-year growth 2024-2029 (%)
    • Data Table on Europe - Year-over-year growth 2024-2029 (%)
  • 11.5 APAC - Market size and forecast 2024-2029
    • Chart on APAC - Market size and forecast 2024-2029 ($ billion)
    • Data Table on APAC - Market size and forecast 2024-2029 ($ billion)
    • Chart on APAC - Year-over-year growth 2024-2029 (%)
    • Data Table on APAC - Year-over-year growth 2024-2029 (%)
  • 11.6 South America - Market size and forecast 2024-2029
    • Chart on South America - Market size and forecast 2024-2029 ($ billion)
    • Data Table on South America - Market size and forecast 2024-2029 ($ billion)
    • Chart on South America - Year-over-year growth 2024-2029 (%)
    • Data Table on South America - Year-over-year growth 2024-2029 (%)
  • 11.7 Middle East and Africa - Market size and forecast 2024-2029
    • Chart on Middle East and Africa - Market size and forecast 2024-2029 ($ billion)
    • Data Table on Middle East and Africa - Market size and forecast 2024-2029 ($ billion)
    • Chart on Middle East and Africa - Year-over-year growth 2024-2029 (%)
    • Data Table on Middle East and Africa - Year-over-year growth 2024-2029 (%)
  • 11.8 US - Market size and forecast 2024-2029
    • Chart on US - Market size and forecast 2024-2029 ($ billion)
    • Data Table on US - Market size and forecast 2024-2029 ($ billion)
    • Chart on US - Year-over-year growth 2024-2029 (%)
    • Data Table on US - Year-over-year growth 2024-2029 (%)
  • 11.9 Canada - Market size and forecast 2024-2029
    • Chart on Canada - Market size and forecast 2024-2029 ($ billion)
    • Data Table on Canada - Market size and forecast 2024-2029 ($ billion)
    • Chart on Canada - Year-over-year growth 2024-2029 (%)
    • Data Table on Canada - Year-over-year growth 2024-2029 (%)
  • 11.10 China - Market size and forecast 2024-2029
    • Chart on China - Market size and forecast 2024-2029 ($ billion)
    • Data Table on China - Market size and forecast 2024-2029 ($ billion)
    • Chart on China - Year-over-year growth 2024-2029 (%)
    • Data Table on China - Year-over-year growth 2024-2029 (%)
  • 11.11 Germany - Market size and forecast 2024-2029
    • Chart on Germany - Market size and forecast 2024-2029 ($ billion)
    • Data Table on Germany - Market size and forecast 2024-2029 ($ billion)
    • Chart on Germany - Year-over-year growth 2024-2029 (%)
    • Data Table on Germany - Year-over-year growth 2024-2029 (%)
  • 11.12 UK - Market size and forecast 2024-2029
    • Chart on UK - Market size and forecast 2024-2029 ($ billion)
    • Data Table on UK - Market size and forecast 2024-2029 ($ billion)
    • Chart on UK - Year-over-year growth 2024-2029 (%)
    • Data Table on UK - Year-over-year growth 2024-2029 (%)
  • 11.13 India - Market size and forecast 2024-2029
    • Chart on India - Market size and forecast 2024-2029 ($ billion)
    • Data Table on India - Market size and forecast 2024-2029 ($ billion)
    • Chart on India - Year-over-year growth 2024-2029 (%)
    • Data Table on India - Year-over-year growth 2024-2029 (%)
  • 11.14 France - Market size and forecast 2024-2029
    • Chart on France - Market size and forecast 2024-2029 ($ billion)
    • Data Table on France - Market size and forecast 2024-2029 ($ billion)
    • Chart on France - Year-over-year growth 2024-2029 (%)
    • Data Table on France - Year-over-year growth 2024-2029 (%)
  • 11.15 Japan - Market size and forecast 2024-2029
    • Chart on Japan - Market size and forecast 2024-2029 ($ billion)
    • Data Table on Japan - Market size and forecast 2024-2029 ($ billion)
    • Chart on Japan - Year-over-year growth 2024-2029 (%)
    • Data Table on Japan - Year-over-year growth 2024-2029 (%)
  • 11.16 Italy - Market size and forecast 2024-2029
    • Chart on Italy - Market size and forecast 2024-2029 ($ billion)
    • Data Table on Italy - Market size and forecast 2024-2029 ($ billion)
    • Chart on Italy - Year-over-year growth 2024-2029 (%)
    • Data Table on Italy - Year-over-year growth 2024-2029 (%)
  • 11.17 Brazil - Market size and forecast 2024-2029
    • Chart on Brazil - Market size and forecast 2024-2029 ($ billion)
    • Data Table on Brazil - Market size and forecast 2024-2029 ($ billion)
    • Chart on Brazil - Year-over-year growth 2024-2029 (%)
    • Data Table on Brazil - Year-over-year growth 2024-2029 (%)
  • 11.18 Market opportunity By Geographical Landscape
    • Market opportunity By Geographical Landscape ($ billion)
    • Data Tables on Market opportunity By Geographical Landscape ($ billion)

12 Drivers, Challenges, and Opportunity/Restraints

  • 12.1 Market drivers
  • 12.2 Market challenges
  • 12.3 Impact of drivers and challenges
    • Impact of drivers and challenges in 2024 and 2029
  • 12.4 Market opportunities/restraints

13 Competitive Landscape

  • 13.1 Overview
  • 13.2 Competitive Landscape
    • Overview on criticality of inputs and factors of differentiation
  • 13.3 Landscape disruption
    • Overview on factors of disruption
  • 13.4 Industry risks
    • Impact of key risks on business

14 Competitive Analysis

  • 14.1 Companies profiled
    • Companies covered
  • 14.2 Company ranking index
    • Company ranking index
  • 14.3 Market positioning of companies
    • Matrix on companies position and classification
  • 14.4 Adobe Inc.
    • Adobe Inc. - Overview
    • Adobe Inc. - Business segments
    • Adobe Inc. - Key news
    • Adobe Inc. - Key offerings
    • Adobe Inc. - Segment focus
    • SWOT
  • 14.5 Alibaba Group Holding Ltd.
    • Alibaba Group Holding Ltd. - Overview
    • Alibaba Group Holding Ltd. - Business segments
    • Alibaba Group Holding Ltd. - Key news
    • Alibaba Group Holding Ltd. - Key offerings
    • Alibaba Group Holding Ltd. - Segment focus
    • SWOT
  • 14.6 Alphabet Inc.
    • Alphabet Inc. - Overview
    • Alphabet Inc. - Business segments
    • Alphabet Inc. - Key offerings
    • Alphabet Inc. - Segment focus
    • SWOT
  • 14.7 Amazon.com Inc.
    • Amazon.com Inc. - Overview
    • Amazon.com Inc. - Business segments
    • Amazon.com Inc. - Key news
    • Amazon.com Inc. - Key offerings
    • Amazon.com Inc. - Segment focus
    • SWOT
  • 14.8 Cisco Systems Inc.
    • Cisco Systems Inc. - Overview
    • Cisco Systems Inc. - Business segments
    • Cisco Systems Inc. - Key news
    • Cisco Systems Inc. - Key offerings
    • Cisco Systems Inc. - Segment focus
    • SWOT
  • 14.9 Dell Technologies Inc.
    • Dell Technologies Inc. - Overview
    • Dell Technologies Inc. - Business segments
    • Dell Technologies Inc. - Key news
    • Dell Technologies Inc. - Key offerings
    • Dell Technologies Inc. - Segment focus
    • SWOT
  • 14.10 Hewlett Packard Enterprise Co.
    • Hewlett Packard Enterprise Co. - Overview
    • Hewlett Packard Enterprise Co. - Business segments
    • Hewlett Packard Enterprise Co. - Key news
    • Hewlett Packard Enterprise Co. - Key offerings
    • Hewlett Packard Enterprise Co. - Segment focus
    • SWOT
  • 14.11 International Business Machines Corp.
    • International Business Machines Corp. - Overview
    • International Business Machines Corp. - Business segments
    • International Business Machines Corp. - Key news
    • International Business Machines Corp. - Key offerings
    • International Business Machines Corp. - Segment focus
    • SWOT
  • 14.12 Microsoft Corp.
    • Microsoft Corp. - Overview
    • Microsoft Corp. - Business segments
    • Microsoft Corp. - Key news
    • Microsoft Corp. - Key offerings
    • Microsoft Corp. - Segment focus
    • SWOT
  • 14.13 Oracle Corp.
    • Oracle Corp. - Overview
    • Oracle Corp. - Business segments
    • Oracle Corp. - Key news
    • Oracle Corp. - Key offerings
    • Oracle Corp. - Segment focus
    • SWOT
  • 14.14 Rackspace Technology Inc.
    • Rackspace Technology Inc. - Overview
    • Rackspace Technology Inc. - Business segments
    • Rackspace Technology Inc. - Key news
    • Rackspace Technology Inc. - Key offerings
    • Rackspace Technology Inc. - Segment focus
    • SWOT
  • 14.15 Salesforce Inc.
    • Salesforce Inc. - Overview
    • Salesforce Inc. - Product / Service
    • Salesforce Inc. - Key news
    • Salesforce Inc. - Key offerings
    • SWOT
  • 14.16 SAP SE
    • SAP SE - Overview
    • SAP SE - Business segments
    • SAP SE - Key news
    • SAP SE - Key offerings
    • SAP SE - Segment focus
    • SWOT
  • 14.17 VMware Inc.
    • VMware Inc. - Overview
    • VMware Inc. - Product / Service
    • VMware Inc. - Key offerings
    • SWOT
  • 14.18 Workday Inc.
    • Workday Inc. - Overview
    • Workday Inc. - Product / Service
    • Workday Inc. - Key news
    • Workday Inc. - Key offerings
    • SWOT

15 Appendix

  • 15.1 Scope of the report
  • 15.2 Inclusions and exclusions checklist
    • Inclusions checklist
    • Exclusions checklist
  • 15.3 Currency conversion rates for US$
    • Currency conversion rates for US$
  • 15.4 Research methodology
    • Research methodology
  • 15.5 Data procurement
    • Information sources
  • 15.6 Data validation
    • Data validation
  • 15.7 Validation techniques employed for market sizing
    • Validation techniques employed for market sizing
  • 15.8 Data synthesis
    • Data synthesis
  • 15.9 360 degree market analysis
    • 360 degree market analysis
  • 15.10 List of abbreviations
    • List of abbreviations