|
|
市場調査レポート
商品コード
1937133
アイウェアの世界市場 2026年~2030年Global Eyewear Market 2026-2030 |
||||||
|
|||||||
カスタマイズ可能
|
|||||||

| アイウェアの世界市場 2026年~2030年 |
|
出版日: 2026年02月11日
発行: TechNavio
ページ情報: 英文 295 Pages
納期: 即納可能
|

概要
世界のアイウェア市場は、2025年から2030年の間に1,247億3,220万米ドルの成長が見込まれており、予測期間中のCAGRは9.7%と予測されています。
本報告書では、世界のアイウェア市場に関する包括的な分析、市場規模と予測、動向、成長要因、課題に加え、約25社のベンダー分析を提供しております。
本レポートは、現在の市場状況、最新の動向と促進要因、市場環境全般に関する最新の分析を提供します。市場は、眼科疾患やデジタル眼精疲労の増加、ファッションアクセサリーや高級品としての眼鏡の進化、スマートアイウェアやデジタル小売ソリューションの技術進歩によって牽引されています。
本調査は、業界の主要関係者からの情報をはじめとする一次情報と二次情報を客観的に組み合わせて実施されました。本レポートには、主要企業の分析に加え、包括的な市場規模データ、地域別分析を伴うセグメント、ベンダー情勢が含まれています。レポートには過去データと予測データが掲載されています。
| 市場範囲 | |
|---|---|
| 基準年 | 2026年 |
| 終了年 | 2030年 |
| 予測期間 | 2026-2030 |
| 成長モメンタム | 加速 |
| 前年比2026年 | 9.4% |
| CAGR | 9.7% |
| 増分額 | 1,247億3,220万米ドル |
本調査では、マルチモーダルAIと拡張現実ウェアラブルの統合が、今後数年間における世界のアイウェア市場成長を牽引する主要要因の一つであると特定しております。また、バイオ循環型素材やカーボンニュートラル製造へのパラダイムシフト、そしてハイパーパーソナライズされた消費者向け直接カスタマイズモデルの台頭が、市場において相当な需要を生み出すものと見込まれます。
目次
第1章 エグゼクティブサマリー
第2章 Technavio分析
- 価格・ライフサイクル・顧客購入バスケット・採用率・購入基準の分析
- インプットの重要性と差別化の要因
- 混乱の要因
- 促進要因と課題の影響
第3章 市場情勢
- 市場エコシステム
- 市場の特徴
- バリューチェーン分析
第4章 市場規模
- 市場の定義
- 市場セグメント分析
- 市場規模 2025
- 市場の見通し 2025-2030
第5章 市場規模実績
- アイウェアの世界市場 2020-2024
- 製品セグメント分析 2020-2024
- 流通チャネルセグメント分析 2020-2024
- エンドユーザーセグメント分析 2020-2024
- 地域別セグメント分析 2020-2024
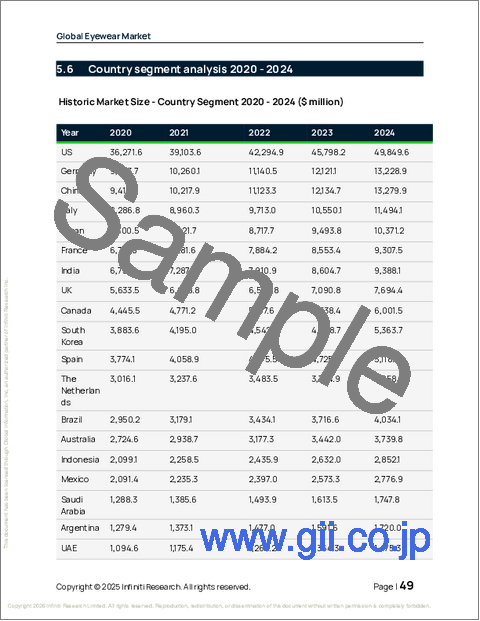
- 国別セグメント分析 2020-2024
第6章 定性分析
- AIの影響:アイウェアの世界市場
第7章 ファイブフォース分析
- ファイブフォースの要約
- 買い手の交渉力
- 供給企業の交渉力
- 新規参入業者の脅威
- 代替品の脅威
- 競争の脅威
- 市況
第8章 市場セグメンテーション:製品別
- 比較:製品別
- 眼鏡
- サングラス
- コンタクトレンズ
- 市場機会:製品別
第9章 市場セグメンテーション:流通チャネル別
- 比較:流通チャネル別
- オフライン
- オンライン
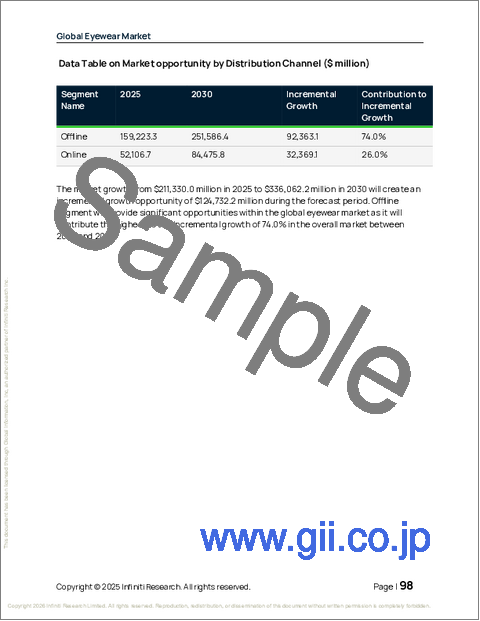
- 市場機会:流通チャネル別
第10章 市場セグメンテーション:エンドユーザー別
- 比較:エンドユーザー別
- ユニセックス
- 男性
- 女性
- 市場機会:エンドユーザー別
第11章 顧客情勢
第12章 地域別情勢
- 地域別セグメンテーション
- 地域別比較
- 欧州
- ドイツ
- イタリア
- フランス
- 英国
- スペイン
- オランダ
- 北米
- 米国
- カナダ
- メキシコ
- アジア太平洋
- 中国
- 日本
- インド
- 韓国
- オーストラリア
- インドネシア
- 南米
- ブラジル
- アルゼンチン
- チリ
- 中東・アフリカ
- サウジアラビア
- アラブ首長国連邦
- 南アフリカ
- トルコ
- エジプト
- 市場機会:地域別
第13章 促進要因・課題・機会
- 市場促進要因
- 市場の課題
- 促進要因と課題の影響
- 市場機会
第14章 競合情勢
- 概要
- 競合情勢
- 混乱の状況
- 業界のリスク
第15章 競合分析
- 企業プロファイル
- 企業ランキング指標
- 企業の市場ポジショニング
- Alcon Inc.
- Bausch Lomb Corp.
- Carl Zeiss AG
- Charmant Inc.
- De Rigo Vision SpA
- EssilorLuxottica
- Hoya Corp.
- JINS Holdings Inc.
- Johnson and Johnson Services
- Kering Eyewear
- Marchon Eyewear Inc.
- Marcolin SpA
- Safilo Group SpA
- The Cooper Companies Inc.
- Titan Co. Ltd.
