|
|
市場調査レポート
商品コード
1626937
構造的心疾患治療デバイスの世界市場、2024~2028年Global Structural Heart Disease Treatment Devices Market 2024-2028 |
||||||

|
|||||||
カスタマイズ可能
|
|||||||

| 構造的心疾患治療デバイスの世界市場、2024~2028年 |
|
出版日: 2024年10月24日
発行: TechNavio
ページ情報: 英文 145 Pages
納期: 即納可能
|

全表示
- 概要
- 図表
- 目次
構造的心疾患治療デバイス市場、2024~2028年
構造的心疾患治療デバイス市場は2023~2028年に75億7,070万米ドル、予測期間中のCAGRは10%で成長すると予測されます。当レポートでは、構造的心疾患治療デバイス市場の全体的な分析、市場規模・予測、動向、成長促進要因、課題、約25のベンダーを網羅したベンダー分析などを掲載しています。
現在の市場シナリオ、最新動向と促進要因、市場環境全体に関する最新分析を提供しています。市場は、構造的な心臓疾患の有病率の増加、新製品の上市数の増加、ベンダーによるM&Aの増加によって牽引されています。
| 市場範囲 | |
|---|---|
| 基準年 | 2024年 |
| 終了年 | 2028年 |
| 予測期間 | 2024~2028年 |
| 成長モメンタム | 加速 |
| 前年比[2024年] | 8.9% |
| CAGR | 10% |
| 増分額 | 75億7,070万米ドル |
本調査では、今後数年間の構造的心疾患治療デバイス市場成長を牽引する主要要因の1つとして、心臓弁装置の強力な臨床パイプラインを挙げています。また、高効率の構造的心臓疾患における技術的進歩や有利な医療償還施策の台頭は、市場の大きな需要につながります。
目次
第1章 エグゼクティブサマリー
- 市場概要
第2章 市場情勢
- 市場エコシステム
- 市場の特徴
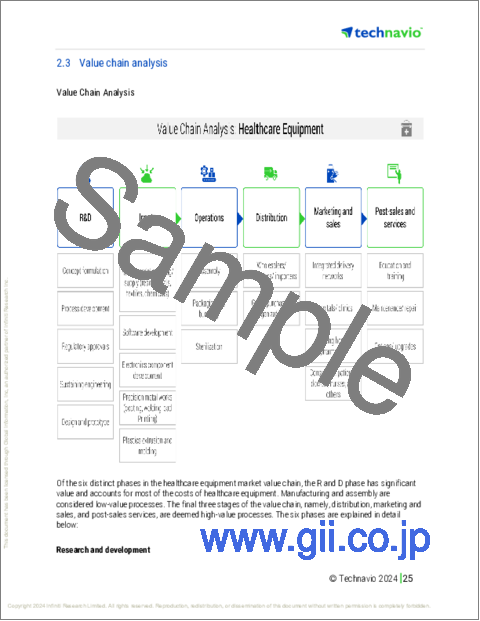
- バリューチェーン分析
第3章 市場規模
- 市場の定義
- 市場セグメント分析
- 市場規模 2023年
- 市場展望 2023~2028年
第4章 市場規模実績
- 構造的心疾患治療デバイスの世界市場 2018~2022年
- 方法別セグメント分析 2018~2022年
- 地域別セグメント分析 2018~2022年
- 国別セグメント分析 2018~2022年
第5章 ファイブフォース分析
- ファイブフォースの要約
- 買い手の交渉力
- 供給企業の交渉力
- 新規参入業者の脅威
- 代替品の脅威
- 競争の脅威
- 市況
第6章 市場セグメンテーション:方法別
- 市場セグメント
- 比較:方法別
- 交換手順:市場規模と予測 2023~2028年
- 修理手順:市場規模と予測 2023~2028年
- 市場機会:方法別
第7章 顧客情勢
- 顧客情勢概要
第8章 地域別情勢
- 地域別セグメンテーション
- 比較:地域別
- 北米:市場規模と予測 2023~2028年
- 欧州:市場規模と予測 2023~2028年
- アジア:市場規模と予測 2023~2028年
- その他:市場規模と予測 2023~2028年
- 米国:市場規模と予測 2023~2028年
- ドイツ:市場規模と予測 2023~2028年
- 英国:市場規模と予測 2023~2028年
- 中国:市場規模と予測 2023~2028年
- 日本:市場規模と予測 2023~2028年
- 地域情勢による市場機会
第9章 促進要因・課題・機会・抑制要因
- 市場促進要因
- 市場課題
- 促進要因と課題の影響
- 市場機会・抑制要因
第10章 競合情勢
- 概要
- 競合情勢
- 混乱の状況
- 産業のリスク
第11章 競合分析
- 企業プロファイル
- 企業の市場ポジショニング
- Abbott Laboratories
- Artivion Inc.
- Boston Scientific Corp.
- Braile Biomedica
- Edwards Lifesciences Corp.
- Lepu Medical Technology Beijing Co. Ltd.
- LivaNova PLC
- Medtronic Plc
- Micro Interventional Devices Inc.
- TTK Healthcare Ltd.
第12章 付録
Exhibits:
- Exhibits1: Executive Summary - Chart on Market Overview
- Exhibits2: Executive Summary - Data Table on Market Overview
- Exhibits3: Executive Summary - Chart on Global Market Characteristics
- Exhibits4: Executive Summary - Chart on Market By Geographical Landscape
- Exhibits5: Executive Summary - Chart on Market Segmentation by Method
- Exhibits6: Executive Summary - Chart on Incremental Growth
- Exhibits7: Executive Summary - Data Table on Incremental Growth
- Exhibits8: Executive Summary - Chart on Company Market Positioning
- Exhibits9: Parent Market
- Exhibits10: Data Table on - Parent Market
- Exhibits11: Market characteristics analysis
- Exhibits12: Value Chain Analysis
- Exhibits13: Offerings of companies included in the market definition
- Exhibits14: Market segments
- Exhibits15: Chart on Global - Market size and forecast 2023-2028 ($ million)
- Exhibits16: Data Table on Global - Market size and forecast 2023-2028 ($ million)
- Exhibits17: Chart on Global Market: Year-over-year growth 2023-2028 (%)
- Exhibits18: Data Table on Global Market: Year-over-year growth 2023-2028 (%)
- Exhibits19: Historic Market Size - Data Table on Global Structural Heart Disease Treatment Devices Market 2018 - 2022 ($ million)
- Exhibits20: Historic Market Size - Method Segment 2018 - 2022 ($ million)
- Exhibits21: Historic Market Size - Geography Segment 2018 - 2022 ($ million)
- Exhibits22: Historic Market Size - Country Segment 2018 - 2022 ($ million)
- Exhibits23: Five forces analysis - Comparison between 2023 and 2028
- Exhibits24: Bargaining power of buyers - Impact of key factors 2023 and 2028
- Exhibits25: Bargaining power of suppliers - Impact of key factors in 2023 and 2028
- Exhibits26: Threat of new entrants - Impact of key factors in 2023 and 2028
- Exhibits27: Threat of substitutes - Impact of key factors in 2023 and 2028
- Exhibits28: Threat of rivalry - Impact of key factors in 2023 and 2028
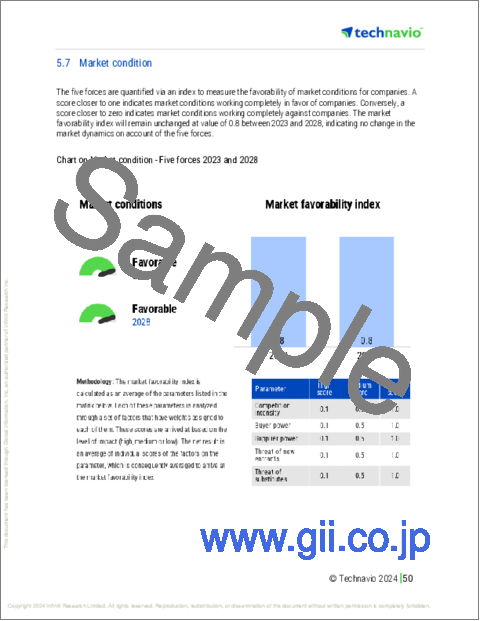
- Exhibits29: Chart on Market condition - Five forces 2023 and 2028
- Exhibits30: Chart on Method - Market share 2023-2028 (%)
- Exhibits31: Data Table on Method - Market share 2023-2028 (%)
- Exhibits32: Chart on Comparison by Method
- Exhibits33: Data Table on Comparison by Method
- Exhibits34: Chart on Replacement procedures - Market size and forecast 2023-2028 ($ million)
- Exhibits35: Data Table on Replacement procedures - Market size and forecast 2023-2028 ($ million)
- Exhibits36: Chart on Replacement procedures - Year-over-year growth 2023-2028 (%)
- Exhibits37: Data Table on Replacement procedures - Year-over-year growth 2023-2028 (%)
- Exhibits38: Chart on Repair procedures - Market size and forecast 2023-2028 ($ million)
- Exhibits39: Data Table on Repair procedures - Market size and forecast 2023-2028 ($ million)
- Exhibits40: Chart on Repair procedures - Year-over-year growth 2023-2028 (%)
- Exhibits41: Data Table on Repair procedures - Year-over-year growth 2023-2028 (%)
- Exhibits42: Market opportunity by Method ($ million)
- Exhibits43: Data Table on Market opportunity by Method ($ million)
- Exhibits44: Analysis of price sensitivity, lifecycle, customer purchase basket, adoption rates, and purchase criteria
- Exhibits45: Chart on Market share By Geographical Landscape 2023-2028 (%)
- Exhibits46: Data Table on Market share By Geographical Landscape 2023-2028 (%)
- Exhibits47: Chart on Geographic comparison
- Exhibits48: Data Table on Geographic comparison
- Exhibits49: Chart on North America - Market size and forecast 2023-2028 ($ million)
- Exhibits50: Data Table on North America - Market size and forecast 2023-2028 ($ million)
- Exhibits51: Chart on North America - Year-over-year growth 2023-2028 (%)
- Exhibits52: Data Table on North America - Year-over-year growth 2023-2028 (%)
- Exhibits53: Chart on Europe - Market size and forecast 2023-2028 ($ million)
- Exhibits54: Data Table on Europe - Market size and forecast 2023-2028 ($ million)
- Exhibits55: Chart on Europe - Year-over-year growth 2023-2028 (%)
- Exhibits56: Data Table on Europe - Year-over-year growth 2023-2028 (%)
- Exhibits57: Chart on Asia - Market size and forecast 2023-2028 ($ million)
- Exhibits58: Data Table on Asia - Market size and forecast 2023-2028 ($ million)
- Exhibits59: Chart on Asia - Year-over-year growth 2023-2028 (%)
- Exhibits60: Data Table on Asia - Year-over-year growth 2023-2028 (%)
- Exhibits61: Chart on Rest of World (ROW) - Market size and forecast 2023-2028 ($ million)
- Exhibits62: Data Table on Rest of World (ROW) - Market size and forecast 2023-2028 ($ million)
- Exhibits63: Chart on Rest of World (ROW) - Year-over-year growth 2023-2028 (%)
- Exhibits64: Data Table on Rest of World (ROW) - Year-over-year growth 2023-2028 (%)
- Exhibits65: Chart on US - Market size and forecast 2023-2028 ($ million)
- Exhibits66: Data Table on US - Market size and forecast 2023-2028 ($ million)
- Exhibits67: Chart on US - Year-over-year growth 2023-2028 (%)
- Exhibits68: Data Table on US - Year-over-year growth 2023-2028 (%)
- Exhibits69: Chart on Germany - Market size and forecast 2023-2028 ($ million)
- Exhibits70: Data Table on Germany - Market size and forecast 2023-2028 ($ million)
- Exhibits71: Chart on Germany - Year-over-year growth 2023-2028 (%)
- Exhibits72: Data Table on Germany - Year-over-year growth 2023-2028 (%)
- Exhibits73: Chart on UK - Market size and forecast 2023-2028 ($ million)
- Exhibits74: Data Table on UK - Market size and forecast 2023-2028 ($ million)
- Exhibits75: Chart on UK - Year-over-year growth 2023-2028 (%)
- Exhibits76: Data Table on UK - Year-over-year growth 2023-2028 (%)
- Exhibits77: Chart on China - Market size and forecast 2023-2028 ($ million)
- Exhibits78: Data Table on China - Market size and forecast 2023-2028 ($ million)
- Exhibits79: Chart on China - Year-over-year growth 2023-2028 (%)
- Exhibits80: Data Table on China - Year-over-year growth 2023-2028 (%)
- Exhibits81: Chart on Japan - Market size and forecast 2023-2028 ($ million)
- Exhibits82: Data Table on Japan - Market size and forecast 2023-2028 ($ million)
- Exhibits83: Chart on Japan - Year-over-year growth 2023-2028 (%)
- Exhibits84: Data Table on Japan - Year-over-year growth 2023-2028 (%)
- Exhibits85: Market opportunity By Geographical Landscape ($ million)
- Exhibits86: Data Tables on Market opportunity By Geographical Landscape ($ million)
- Exhibits87: Impact of drivers and challenges in 2023 and 2028
- Exhibits88: Overview on criticality of inputs and factors of differentiation
- Exhibits89: Overview on factors of disruption
- Exhibits90: Impact of key risks on business
- Exhibits91: Companies covered
- Exhibits92: Matrix on companies position and classification
- Exhibits93: Abbott Laboratories - Overview
- Exhibits94: Abbott Laboratories - Business segments
- Exhibits95: Abbott Laboratories - Key news
- Exhibits96: Abbott Laboratories - Key offerings
- Exhibits97: Abbott Laboratories - Segment focus
- Exhibits98: Artivion Inc. - Overview
- Exhibits99: Artivion Inc. - Business segments
- Exhibits100: Artivion Inc. - Key offerings
- Exhibits101: Artivion Inc. - Segment focus
- Exhibits102: Boston Scientific Corp. - Overview
- Exhibits103: Boston Scientific Corp. - Business segments
- Exhibits104: Boston Scientific Corp. - Key news
- Exhibits105: Boston Scientific Corp. - Key offerings
- Exhibits106: Boston Scientific Corp. - Segment focus
- Exhibits107: Braile Biomedica - Overview
- Exhibits108: Braile Biomedica - Product / Service
- Exhibits109: Braile Biomedica - Key offerings
- Exhibits110: Edwards Lifesciences Corp. - Overview
- Exhibits111: Edwards Lifesciences Corp. - Business segments
- Exhibits112: Edwards Lifesciences Corp. - Key news
- Exhibits113: Edwards Lifesciences Corp. - Key offerings
- Exhibits114: Edwards Lifesciences Corp. - Segment focus
- Exhibits115: Lepu Medical Technology Beijing Co. Ltd. - Overview
- Exhibits116: Lepu Medical Technology Beijing Co. Ltd. - Product / Service
- Exhibits117: Lepu Medical Technology Beijing Co. Ltd. - Key offerings
- Exhibits118: LivaNova PLC - Overview
- Exhibits119: LivaNova PLC - Business segments
- Exhibits120: LivaNova PLC - Key news
- Exhibits121: LivaNova PLC - Key offerings
- Exhibits122: LivaNova PLC - Segment focus
- Exhibits123: Medtronic Plc - Overview
- Exhibits124: Medtronic Plc - Business segments
- Exhibits125: Medtronic Plc - Key news
- Exhibits126: Medtronic Plc - Key offerings
- Exhibits127: Medtronic Plc - Segment focus
- Exhibits128: Micro Interventional Devices Inc. - Overview
- Exhibits129: Micro Interventional Devices Inc. - Product / Service
- Exhibits130: Micro Interventional Devices Inc. - Key offerings
- Exhibits131: TTK Healthcare Ltd. - Overview
- Exhibits132: TTK Healthcare Ltd. - Product / Service
- Exhibits133: TTK Healthcare Ltd. - Key offerings
- Exhibits134: Inclusions checklist
- Exhibits135: Exclusions checklist
- Exhibits136: Currency conversion rates for US$
- Exhibits137: Research methodology
- Exhibits138: Information sources
- Exhibits139: Data validation
- Exhibits140: Validation techniques employed for market sizing
- Exhibits141: Data synthesis
- Exhibits142: 360 degree market analysis
- Exhibits143: List of abbreviations
Structural Heart Disease Treatment Devices Market 2024-2028
The structural heart disease treatment devices market is forecasted to grow by USD 7570.7 mn during 2023-2028, accelerating at a CAGR of 10% during the forecast period. The report on the structural heart disease treatment devices market provides a holistic analysis, market size and forecast, trends, growth drivers, and challenges, as well as vendor analysis covering around 25 vendors.
The report offers an up-to-date analysis regarding the current market scenario, the latest trends and drivers, and the overall market environment. The market is driven by increasing prevalence of structural heart diseases, rising number of new product launches, and growing number of mergers and acquisitions by market vendors.
| Market Scope | |
|---|---|
| Base Year | 2024 |
| End Year | 2028 |
| Series Year | 2024-2028 |
| Growth Momentum | Accelerate |
| YOY 2024 | 8.9% |
| CAGR | 10% |
| Incremental Value | $7570.7 mn |
Technavio's structural heart disease treatment devices market is segmented as below:
By Method
- Replacement procedures
- Repair procedures
By Geographical Landscape
- North America
- Europe
- Asia
- Rest of World (ROW)
This study identifies the strong clinical pipeline for heart valve devices as one of the prime reasons driving the structural heart disease treatment devices market growth during the next few years. Also, technological advancements in high-efficiency structural heart diseases and rising favorable medical reimbursement policies will lead to sizable demand in the market.
The report on the structural heart disease treatment devices market covers the following areas:
- Structural Heart Disease Treatment Devices Market sizing
- Structural Heart Disease Treatment Devices Market forecast
- Structural Heart Disease Treatment Devices Market industry analysis
The robust vendor analysis is designed to help clients improve their market position, and in line with this, this report provides a detailed analysis of several leading structural heart disease treatment devices market vendors that include Abbott Laboratories, AFFLUENT MEDICAL SA, Artivion Inc., AtriCure Inc., Boston Scientific Corp., Braile Biomedica, Coroneo, Edwards Lifesciences Corp., Getinge AB, Jc Medical Inc., Johnson and Johnson Services Inc., Lepu Medical Technology Beijing Co. Ltd., Lifetech Scientific Corp, LivaNova PLC, Medtronic Plc, Micro Interventional Devices Inc., NuMED Inc., Terumo Corp., TTK Healthcare Ltd., and W. L. Gore and Associates Inc.. Also, the structural heart disease treatment devices market analysis report includes information on upcoming trends and challenges that will influence market growth. This is to help companies strategize and leverage all forthcoming growth opportunities.
The study was conducted using an objective combination of primary and secondary information including inputs from key participants in the industry. The report contains a comprehensive market and vendor landscape in addition to an analysis of the key vendors.
The publisher presents a detailed picture of the market by the way of study, synthesis, and summation of data from multiple sources by an analysis of key parameters such as profit, pricing, competition, and promotions. It presents various market facets by identifying the key industry influencers. The data presented is comprehensive, reliable, and a result of extensive primary and secondary research. The market research reports provide a complete competitive landscape and an in-depth vendor selection methodology and analysis using qualitative and quantitative research to forecast accurate market growth.
Table of Contents
1 Executive Summary
- 1.1 Market overview
- Executive Summary - Chart on Market Overview
- Executive Summary - Data Table on Market Overview
- Executive Summary - Chart on Global Market Characteristics
- Executive Summary - Chart on Market By Geographical Landscape
- Executive Summary - Chart on Market Segmentation by Method
- Executive Summary - Chart on Incremental Growth
- Executive Summary - Data Table on Incremental Growth
- Executive Summary - Chart on Company Market Positioning
2 Market Landscape
- 2.1 Market ecosystem
- Parent Market
- Data Table on - Parent Market
- 2.2 Market characteristics
- Market characteristics analysis
- 2.3 Value chain analysis
- Value Chain Analysis
3 Market Sizing
- 3.1 Market definition
- Offerings of companies included in the market definition
- 3.2 Market segment analysis
- Market segments
- 3.3 Market size 2023
- 3.4 Market outlook: Forecast for 2023-2028
- Chart on Global - Market size and forecast 2023-2028 ($ million)
- Data Table on Global - Market size and forecast 2023-2028 ($ million)
- Chart on Global Market: Year-over-year growth 2023-2028 (%)
- Data Table on Global Market: Year-over-year growth 2023-2028 (%)
4 Historic Market Size
- 4.1 Global Structural Heart Disease Treatment Devices Market 2018 - 2022
- Historic Market Size - Data Table on Global Structural Heart Disease Treatment Devices Market 2018 - 2022 ($ million)
- 4.2 Method segment analysis 2018 - 2022
- Historic Market Size - Method Segment 2018 - 2022 ($ million)
- 4.3 Geography segment analysis 2018 - 2022
- Historic Market Size - Geography Segment 2018 - 2022 ($ million)
- 4.4 Country segment analysis 2018 - 2022
- Historic Market Size - Country Segment 2018 - 2022 ($ million)
5 Five Forces Analysis
- 5.1 Five forces summary
- Five forces analysis - Comparison between 2023 and 2028
- 5.2 Bargaining power of buyers
- Bargaining power of buyers - Impact of key factors 2023 and 2028
- 5.3 Bargaining power of suppliers
- Bargaining power of suppliers - Impact of key factors in 2023 and 2028
- 5.4 Threat of new entrants
- Threat of new entrants - Impact of key factors in 2023 and 2028
- 5.5 Threat of substitutes
- Threat of substitutes - Impact of key factors in 2023 and 2028
- 5.6 Threat of rivalry
- Threat of rivalry - Impact of key factors in 2023 and 2028
- 5.7 Market condition
- Chart on Market condition - Five forces 2023 and 2028
6 Market Segmentation by Method
- 6.1 Market segments
- Chart on Method - Market share 2023-2028 (%)
- Data Table on Method - Market share 2023-2028 (%)
- 6.2 Comparison by Method
- Chart on Comparison by Method
- Data Table on Comparison by Method
- 6.3 Replacement procedures - Market size and forecast 2023-2028
- Chart on Replacement procedures - Market size and forecast 2023-2028 ($ million)
- Data Table on Replacement procedures - Market size and forecast 2023-2028 ($ million)
- Chart on Replacement procedures - Year-over-year growth 2023-2028 (%)
- Data Table on Replacement procedures - Year-over-year growth 2023-2028 (%)
- 6.4 Repair procedures - Market size and forecast 2023-2028
- Chart on Repair procedures - Market size and forecast 2023-2028 ($ million)
- Data Table on Repair procedures - Market size and forecast 2023-2028 ($ million)
- Chart on Repair procedures - Year-over-year growth 2023-2028 (%)
- Data Table on Repair procedures - Year-over-year growth 2023-2028 (%)
- 6.5 Market opportunity by Method
- Market opportunity by Method ($ million)
- Data Table on Market opportunity by Method ($ million)
7 Customer Landscape
- 7.1 Customer landscape overview
- Analysis of price sensitivity, lifecycle, customer purchase basket, adoption rates, and purchase criteria
8 Geographic Landscape
- 8.1 Geographic segmentation
- Chart on Market share By Geographical Landscape 2023-2028 (%)
- Data Table on Market share By Geographical Landscape 2023-2028 (%)
- 8.2 Geographic comparison
- Chart on Geographic comparison
- Data Table on Geographic comparison
- 8.3 North America - Market size and forecast 2023-2028
- Chart on North America - Market size and forecast 2023-2028 ($ million)
- Data Table on North America - Market size and forecast 2023-2028 ($ million)
- Chart on North America - Year-over-year growth 2023-2028 (%)
- Data Table on North America - Year-over-year growth 2023-2028 (%)
- 8.4 Europe - Market size and forecast 2023-2028
- Chart on Europe - Market size and forecast 2023-2028 ($ million)
- Data Table on Europe - Market size and forecast 2023-2028 ($ million)
- Chart on Europe - Year-over-year growth 2023-2028 (%)
- Data Table on Europe - Year-over-year growth 2023-2028 (%)
- 8.5 Asia - Market size and forecast 2023-2028
- Chart on Asia - Market size and forecast 2023-2028 ($ million)
- Data Table on Asia - Market size and forecast 2023-2028 ($ million)
- Chart on Asia - Year-over-year growth 2023-2028 (%)
- Data Table on Asia - Year-over-year growth 2023-2028 (%)
- 8.6 Rest of World (ROW) - Market size and forecast 2023-2028
- Chart on Rest of World (ROW) - Market size and forecast 2023-2028 ($ million)
- Data Table on Rest of World (ROW) - Market size and forecast 2023-2028 ($ million)
- Chart on Rest of World (ROW) - Year-over-year growth 2023-2028 (%)
- Data Table on Rest of World (ROW) - Year-over-year growth 2023-2028 (%)
- 8.7 US - Market size and forecast 2023-2028
- Chart on US - Market size and forecast 2023-2028 ($ million)
- Data Table on US - Market size and forecast 2023-2028 ($ million)
- Chart on US - Year-over-year growth 2023-2028 (%)
- Data Table on US - Year-over-year growth 2023-2028 (%)
- 8.8 Germany - Market size and forecast 2023-2028
- Chart on Germany - Market size and forecast 2023-2028 ($ million)
- Data Table on Germany - Market size and forecast 2023-2028 ($ million)
- Chart on Germany - Year-over-year growth 2023-2028 (%)
- Data Table on Germany - Year-over-year growth 2023-2028 (%)
- 8.9 UK - Market size and forecast 2023-2028
- Chart on UK - Market size and forecast 2023-2028 ($ million)
- Data Table on UK - Market size and forecast 2023-2028 ($ million)
- Chart on UK - Year-over-year growth 2023-2028 (%)
- Data Table on UK - Year-over-year growth 2023-2028 (%)
- 8.10 China - Market size and forecast 2023-2028
- Chart on China - Market size and forecast 2023-2028 ($ million)
- Data Table on China - Market size and forecast 2023-2028 ($ million)
- Chart on China - Year-over-year growth 2023-2028 (%)
- Data Table on China - Year-over-year growth 2023-2028 (%)
- 8.11 Japan - Market size and forecast 2023-2028
- Chart on Japan - Market size and forecast 2023-2028 ($ million)
- Data Table on Japan - Market size and forecast 2023-2028 ($ million)
- Chart on Japan - Year-over-year growth 2023-2028 (%)
- Data Table on Japan - Year-over-year growth 2023-2028 (%)
- 8.12 Market opportunity By Geographical Landscape
- Market opportunity By Geographical Landscape ($ million)
- Data Tables on Market opportunity By Geographical Landscape ($ million)
9 Drivers, Challenges, and Opportunity/Restraints
- 9.1 Market drivers
- 9.2 Market challenges
- 9.3 Impact of drivers and challenges
- Impact of drivers and challenges in 2023 and 2028
- 9.4 Market opportunities/restraints
10 Competitive Landscape
- 10.1 Overview
- 10.2 Competitive Landscape
- Overview on criticality of inputs and factors of differentiation
- 10.3 Landscape disruption
- Overview on factors of disruption
- 10.4 Industry risks
- Impact of key risks on business
11 Competitive Analysis
- 11.1 Companies profiled
- Companies covered
- 11.2 Market positioning of companies
- Matrix on companies position and classification
- 11.3 Abbott Laboratories
- Abbott Laboratories - Overview
- Abbott Laboratories - Business segments
- Abbott Laboratories - Key news
- Abbott Laboratories - Key offerings
- Abbott Laboratories - Segment focus
- 11.4 Artivion Inc.
- Artivion Inc. - Overview
- Artivion Inc. - Business segments
- Artivion Inc. - Key offerings
- Artivion Inc. - Segment focus
- 11.5 Boston Scientific Corp.
- Boston Scientific Corp. - Overview
- Boston Scientific Corp. - Business segments
- Boston Scientific Corp. - Key news
- Boston Scientific Corp. - Key offerings
- Boston Scientific Corp. - Segment focus
- 11.6 Braile Biomedica
- Braile Biomedica - Overview
- Braile Biomedica - Product / Service
- Braile Biomedica - Key offerings
- 11.7 Edwards Lifesciences Corp.
- Edwards Lifesciences Corp. - Overview
- Edwards Lifesciences Corp. - Business segments
- Edwards Lifesciences Corp. - Key news
- Edwards Lifesciences Corp. - Key offerings
- Edwards Lifesciences Corp. - Segment focus
- 11.8 Lepu Medical Technology Beijing Co. Ltd.
- Lepu Medical Technology Beijing Co. Ltd. - Overview
- Lepu Medical Technology Beijing Co. Ltd. - Product / Service
- Lepu Medical Technology Beijing Co. Ltd. - Key offerings
- 11.9 LivaNova PLC
- LivaNova PLC - Overview
- LivaNova PLC - Business segments
- LivaNova PLC - Key news
- LivaNova PLC - Key offerings
- LivaNova PLC - Segment focus
- 11.10 Medtronic Plc
- Medtronic Plc - Overview
- Medtronic Plc - Business segments
- Medtronic Plc - Key news
- Medtronic Plc - Key offerings
- Medtronic Plc - Segment focus
- 11.11 Micro Interventional Devices Inc.
- Micro Interventional Devices Inc. - Overview
- Micro Interventional Devices Inc. - Product / Service
- Micro Interventional Devices Inc. - Key offerings
- 11.12 TTK Healthcare Ltd.
- TTK Healthcare Ltd. - Overview
- TTK Healthcare Ltd. - Product / Service
- TTK Healthcare Ltd. - Key offerings
12 Appendix
- 12.1 Scope of the report
- 12.2 Inclusions and exclusions checklist
- Inclusions checklist
- Exclusions checklist
- 12.3 Currency conversion rates for US$
- Currency conversion rates for US$
- 12.4 Research methodology
- Research methodology
- 12.5 Data procurement
- Information sources
- 12.6 Data validation
- Data validation
- 12.7 Validation techniques employed for market sizing
- Validation techniques employed for market sizing
- 12.8 Data synthesis
- Data synthesis
- 12.9 360 degree market analysis
- 360 degree market analysis
- 12.10 List of abbreviations
- List of abbreviations
