|
|
市場調査レポート
商品コード
1626352
鉄鋼業向け耐火物の世界市場、2024~2028年Global Refractory Materials Market for Steel Industry 2024-2028 |
||||||

|
|||||||
カスタマイズ可能
|
|||||||

| 鉄鋼業向け耐火物の世界市場、2024~2028年 |
|
出版日: 2024年10月11日
発行: TechNavio
ページ情報: 英文 166 Pages
納期: 即納可能
|

全表示
- 概要
- 図表
- 目次
鉄鋼業向け耐火物 2024~2028年
鉄鋼業向け耐火物は2023~2028年に23億6,940万米ドル、予測期間中のCAGRは4.5%で成長すると予測されています。当レポートでは、鉄鋼業向け耐火物の全体的な分析、市場規模と予測、動向、成長促進要因、約25のベンダーを網羅したベンダー分析などを掲載しています。
現在の市場シナリオ、最新動向と促進要因、市場環境全体に関する最新分析を提供しています。市場は、建設、インフラ、自動車、その他のセグメントからの鉄鋼需要の増加、ベンダーによる研究開発活動の増加、鉄鋼産業における能力開発の増加によって牽引されています。
| 市場範囲 | |
|---|---|
| 基準年 | 2024年 |
| 終了年 | 2028年 |
| 予測期間 | 2024~2028年 |
| 成長モメンタム | 加速 |
| 前年比[2024年] | 4.2% |
| CAGR | 4.5% |
| 増分額 | 23億6,940万米ドル |
本調査では、成形耐火物よりも不定形耐火物の人気が高まっていることを、今後数年間の鉄鋼業向け耐火物の成長を促進する主要理由の1つとして挙げています。また、新製品や環境に優しい耐火物の発売、産業用途における鉄鋼の使用増加が市場の大きな需要につながります。
目次
第1章 エグゼクティブサマリー
- 市場概要
第2章 市場情勢
- 市場エコシステム
- 市場の特徴
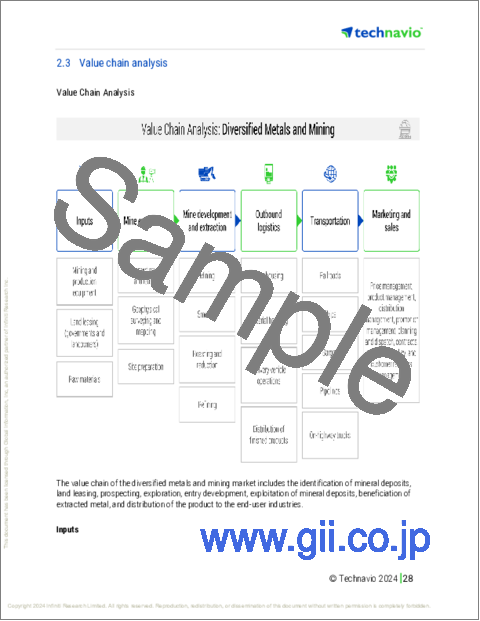
- バリューチェーン分析
第3章 市場規模
- 市場の定義
- 市場セグメント分析
- 市場規模 2023年
- 市場展望 2023~2028年
第4章 市場規模実績
- 鉄鋼業向け耐火物の世界市場 2018~2022年
- 製品別セグメント分析 2018~2022年
- タイプ別セグメント分析 2018~2022年
- 地域別セグメント分析 2018~2022年
- 国別セグメント分析 2018~2022年
第5章 ファイブフォース分析
- ファイブフォースの要約
- 買い手の交渉力
- 供給企業の交渉力
- 新規参入業者の脅威
- 代替品の脅威
- 競争の脅威
- 市況
第6章 市場セグメンテーション:製品別
- 市場セグメント
- 比較:製品別
- レンガ:市場規模と予測 2023~2028年
- モノリシック:市場規模と予測 2023~2028年
- 市場機会:製品別
第7章 市場セグメンテーション:タイプ別
- 市場セグメント
- 比較:タイプ別
- 酸性と中性:市場規模と予測 2023~2028年
- 基本:市場規模と予測 2023~2028年
- 市場機会:タイプ別
第8章 顧客情勢
- 顧客情勢概要
第9章 地域別情勢
- 地域別セグメンテーション
- 比較:地域別
- アジア太平洋:市場規模と予測 2023~2028年
- 欧州:市場規模と予測 2023~2028年
- 北米:市場規模と予測 2023~2028年
- 南米:市場規模と予測 2023~2028年
- 中東・アフリカ:市場規模と予測 2023~2028年
- インド:市場規模と予測 2023~2028年
- 中国:市場規模と予測 2023~2028年
- 日本:市場規模と予測 2023~2028年
- ロシア:市場規模と予測 2023~2028年
- 米国:市場規模と予測 2023~2028年
- 地域情勢による市場機会
第10章 促進要因・課題・機会・抑制要因
- 市場促進要因
- 市場課題
- 促進要因と課題の影響
- 市場機会・抑制要因
第11章 競合情勢
- 概要
- 競合情勢
- 混乱の状況
- 産業のリスク
第12章 競合分析
- 企業プロファイル
- 企業の市場ポジショニング
- Allied Mineral Products LLC
- Compagnie de Saint-Gobain S.A.
- HarbisonWalker International Inc.
- Imerys S.A.
- Krosaki Harima Corp.
- Magnezit Group
- Minerals Technologies Inc.
- Morgan Advanced Materials Plc
- Refractarios Alfran S.A
- Refractory Minerals Co. Inc.
- Refratechnik Holding GmbH
- RHI Magnesita GmbH
- Shinagawa Refractories Co. Ltd.
- Unifrax I LLC
- Vesuvius Plc
第13章 付録
Exhibits:
- Exhibits1: Executive Summary - Chart on Market Overview
- Exhibits2: Executive Summary - Data Table on Market Overview
- Exhibits3: Executive Summary - Chart on Global Market Characteristics
- Exhibits4: Executive Summary - Chart on Market By Geographical Landscape
- Exhibits5: Executive Summary - Chart on Market Segmentation by Product
- Exhibits6: Executive Summary - Chart on Market Segmentation by Type
- Exhibits7: Executive Summary - Chart on Incremental Growth
- Exhibits8: Executive Summary - Data Table on Incremental Growth
- Exhibits9: Executive Summary - Chart on Company Market Positioning
- Exhibits10: Parent Market
- Exhibits11: Data Table on - Parent Market
- Exhibits12: Market characteristics analysis
- Exhibits13: Value Chain Analysis
- Exhibits14: Offerings of companies included in the market definition
- Exhibits15: Market segments
- Exhibits16: Chart on Global - Market size and forecast 2023-2028 ($ million)
- Exhibits17: Data Table on Global - Market size and forecast 2023-2028 ($ million)
- Exhibits18: Chart on Global Market: Year-over-year growth 2023-2028 (%)
- Exhibits19: Data Table on Global Market: Year-over-year growth 2023-2028 (%)
- Exhibits20: Historic Market Size - Data Table on Global Refractory Materials Market For Steel Industry 2018 - 2022 ($ million)
- Exhibits21: Historic Market Size - Product Segment 2018 - 2022 ($ million)
- Exhibits22: Historic Market Size - Type Segment 2018 - 2022 ($ million)
- Exhibits23: Historic Market Size - Geography Segment 2018 - 2022 ($ million)
- Exhibits24: Historic Market Size - Country Segment 2018 - 2022 ($ million)
- Exhibits25: Five forces analysis - Comparison between 2023 and 2028
- Exhibits26: Bargaining power of buyers - Impact of key factors 2023 and 2028
- Exhibits27: Bargaining power of suppliers - Impact of key factors in 2023 and 2028
- Exhibits28: Threat of new entrants - Impact of key factors in 2023 and 2028
- Exhibits29: Threat of substitutes - Impact of key factors in 2023 and 2028
- Exhibits30: Threat of rivalry - Impact of key factors in 2023 and 2028
- Exhibits31: Chart on Market condition - Five forces 2023 and 2028
- Exhibits32: Chart on Product - Market share 2023-2028 (%)
- Exhibits33: Data Table on Product - Market share 2023-2028 (%)
- Exhibits34: Chart on Comparison by Product
- Exhibits35: Data Table on Comparison by Product
- Exhibits36: Chart on Brick - Market size and forecast 2023-2028 ($ million)
- Exhibits37: Data Table on Brick - Market size and forecast 2023-2028 ($ million)
- Exhibits38: Chart on Brick - Year-over-year growth 2023-2028 (%)
- Exhibits39: Data Table on Brick - Year-over-year growth 2023-2028 (%)
- Exhibits40: Chart on Monolithic - Market size and forecast 2023-2028 ($ million)
- Exhibits41: Data Table on Monolithic - Market size and forecast 2023-2028 ($ million)
- Exhibits42: Chart on Monolithic - Year-over-year growth 2023-2028 (%)
- Exhibits43: Data Table on Monolithic - Year-over-year growth 2023-2028 (%)
- Exhibits44: Market opportunity by Product ($ million)
- Exhibits45: Data Table on Market opportunity by Product ($ million)
- Exhibits46: Chart on Type - Market share 2023-2028 (%)
- Exhibits47: Data Table on Type - Market share 2023-2028 (%)
- Exhibits48: Chart on Comparison by Type
- Exhibits49: Data Table on Comparison by Type
- Exhibits50: Chart on Acidic and neutral - Market size and forecast 2023-2028 ($ million)
- Exhibits51: Data Table on Acidic and neutral - Market size and forecast 2023-2028 ($ million)
- Exhibits52: Chart on Acidic and neutral - Year-over-year growth 2023-2028 (%)
- Exhibits53: Data Table on Acidic and neutral - Year-over-year growth 2023-2028 (%)
- Exhibits54: Chart on Basic - Market size and forecast 2023-2028 ($ million)
- Exhibits55: Data Table on Basic - Market size and forecast 2023-2028 ($ million)
- Exhibits56: Chart on Basic - Year-over-year growth 2023-2028 (%)
- Exhibits57: Data Table on Basic - Year-over-year growth 2023-2028 (%)
- Exhibits58: Market opportunity by Type ($ million)
- Exhibits59: Data Table on Market opportunity by Type ($ million)
- Exhibits60: Analysis of price sensitivity, lifecycle, customer purchase basket, adoption rates, and purchase criteria
- Exhibits61: Chart on Market share By Geographical Landscape 2023-2028 (%)
- Exhibits62: Data Table on Market share By Geographical Landscape 2023-2028 (%)
- Exhibits63: Chart on Geographic comparison
- Exhibits64: Data Table on Geographic comparison
- Exhibits65: Chart on APAC - Market size and forecast 2023-2028 ($ million)
- Exhibits66: Data Table on APAC - Market size and forecast 2023-2028 ($ million)
- Exhibits67: Chart on APAC - Year-over-year growth 2023-2028 (%)
- Exhibits68: Data Table on APAC - Year-over-year growth 2023-2028 (%)
- Exhibits69: Chart on Europe - Market size and forecast 2023-2028 ($ million)
- Exhibits70: Data Table on Europe - Market size and forecast 2023-2028 ($ million)
- Exhibits71: Chart on Europe - Year-over-year growth 2023-2028 (%)
- Exhibits72: Data Table on Europe - Year-over-year growth 2023-2028 (%)
- Exhibits73: Chart on North America - Market size and forecast 2023-2028 ($ million)
- Exhibits74: Data Table on North America - Market size and forecast 2023-2028 ($ million)
- Exhibits75: Chart on North America - Year-over-year growth 2023-2028 (%)
- Exhibits76: Data Table on North America - Year-over-year growth 2023-2028 (%)
- Exhibits77: Chart on South America - Market size and forecast 2023-2028 ($ million)
- Exhibits78: Data Table on South America - Market size and forecast 2023-2028 ($ million)
- Exhibits79: Chart on South America - Year-over-year growth 2023-2028 (%)
- Exhibits80: Data Table on South America - Year-over-year growth 2023-2028 (%)
- Exhibits81: Chart on Middle East and Africa - Market size and forecast 2023-2028 ($ million)
- Exhibits82: Data Table on Middle East and Africa - Market size and forecast 2023-2028 ($ million)
- Exhibits83: Chart on Middle East and Africa - Year-over-year growth 2023-2028 (%)
- Exhibits84: Data Table on Middle East and Africa - Year-over-year growth 2023-2028 (%)
- Exhibits85: Chart on India - Market size and forecast 2023-2028 ($ million)
- Exhibits86: Data Table on India - Market size and forecast 2023-2028 ($ million)
- Exhibits87: Chart on India - Year-over-year growth 2023-2028 (%)
- Exhibits88: Data Table on India - Year-over-year growth 2023-2028 (%)
- Exhibits89: Chart on China - Market size and forecast 2023-2028 ($ million)
- Exhibits90: Data Table on China - Market size and forecast 2023-2028 ($ million)
- Exhibits91: Chart on China - Year-over-year growth 2023-2028 (%)
- Exhibits92: Data Table on China - Year-over-year growth 2023-2028 (%)
- Exhibits93: Chart on Japan - Market size and forecast 2023-2028 ($ million)
- Exhibits94: Data Table on Japan - Market size and forecast 2023-2028 ($ million)
- Exhibits95: Chart on Japan - Year-over-year growth 2023-2028 (%)
- Exhibits96: Data Table on Japan - Year-over-year growth 2023-2028 (%)
- Exhibits97: Chart on Russia - Market size and forecast 2023-2028 ($ million)
- Exhibits98: Data Table on Russia - Market size and forecast 2023-2028 ($ million)
- Exhibits99: Chart on Russia - Year-over-year growth 2023-2028 (%)
- Exhibits100: Data Table on Russia - Year-over-year growth 2023-2028 (%)
- Exhibits101: Chart on US - Market size and forecast 2023-2028 ($ million)
- Exhibits102: Data Table on US - Market size and forecast 2023-2028 ($ million)
- Exhibits103: Chart on US - Year-over-year growth 2023-2028 (%)
- Exhibits104: Data Table on US - Year-over-year growth 2023-2028 (%)
- Exhibits105: Market opportunity By Geographical Landscape ($ million)
- Exhibits106: Data Tables on Market opportunity By Geographical Landscape ($ million)
- Exhibits107: Impact of drivers and challenges in 2023 and 2028
- Exhibits108: Overview on criticality of inputs and factors of differentiation
- Exhibits109: Overview on factors of disruption
- Exhibits110: Impact of key risks on business
- Exhibits111: Companies covered
- Exhibits112: Matrix on companies position and classification
- Exhibits113: Allied Mineral Products LLC - Overview
- Exhibits114: Allied Mineral Products LLC - Product / Service
- Exhibits115: Allied Mineral Products LLC - Key offerings
- Exhibits116: Compagnie de Saint-Gobain S.A. - Overview
- Exhibits117: Compagnie de Saint-Gobain S.A. - Business segments
- Exhibits118: Compagnie de Saint-Gobain S.A. - Key news
- Exhibits119: Compagnie de Saint-Gobain S.A. - Key offerings
- Exhibits120: Compagnie de Saint-Gobain S.A. - Segment focus
- Exhibits121: HarbisonWalker International Inc. - Overview
- Exhibits122: HarbisonWalker International Inc. - Product / Service
- Exhibits123: HarbisonWalker International Inc. - Key offerings
- Exhibits124: Imerys S.A. - Overview
- Exhibits125: Imerys S.A. - Business segments
- Exhibits126: Imerys S.A. - Key offerings
- Exhibits127: Imerys S.A. - Segment focus
- Exhibits128: Krosaki Harima Corp. - Overview
- Exhibits129: Krosaki Harima Corp. - Business segments
- Exhibits130: Krosaki Harima Corp. - Key offerings
- Exhibits131: Krosaki Harima Corp. - Segment focus
- Exhibits132: Magnezit Group - Overview
- Exhibits133: Magnezit Group - Product / Service
- Exhibits134: Magnezit Group - Key offerings
- Exhibits135: Minerals Technologies Inc. - Overview
- Exhibits136: Minerals Technologies Inc. - Business segments
- Exhibits137: Minerals Technologies Inc. - Key news
- Exhibits138: Minerals Technologies Inc. - Key offerings
- Exhibits139: Minerals Technologies Inc. - Segment focus
- Exhibits140: Morgan Advanced Materials Plc - Overview
- Exhibits141: Morgan Advanced Materials Plc - Business segments
- Exhibits142: Morgan Advanced Materials Plc - Key news
- Exhibits143: Morgan Advanced Materials Plc - Key offerings
- Exhibits144: Morgan Advanced Materials Plc - Segment focus
- Exhibits145: Refractarios Alfran S.A - Overview
- Exhibits146: Refractarios Alfran S.A - Product / Service
- Exhibits147: Refractarios Alfran S.A - Key offerings
- Exhibits148: Refractory Minerals Co. Inc. - Overview
- Exhibits149: Refractory Minerals Co. Inc. - Product / Service
- Exhibits150: Refractory Minerals Co. Inc. - Key offerings
- Exhibits151: Refratechnik Holding GmbH - Overview
- Exhibits152: Refratechnik Holding GmbH - Product / Service
- Exhibits153: Refratechnik Holding GmbH - Key offerings
- Exhibits154: RHI Magnesita GmbH - Overview
- Exhibits155: RHI Magnesita GmbH - Business segments
- Exhibits156: RHI Magnesita GmbH - Key news
- Exhibits157: RHI Magnesita GmbH - Key offerings
- Exhibits158: RHI Magnesita GmbH - Segment focus
- Exhibits159: Shinagawa Refractories Co. Ltd. - Overview
- Exhibits160: Shinagawa Refractories Co. Ltd. - Product / Service
- Exhibits161: Shinagawa Refractories Co. Ltd. - Key offerings
- Exhibits162: Unifrax I LLC - Overview
- Exhibits163: Unifrax I LLC - Product / Service
- Exhibits164: Unifrax I LLC - Key offerings
- Exhibits165: Vesuvius Plc - Overview
- Exhibits166: Vesuvius Plc - Business segments
- Exhibits167: Vesuvius Plc - Key offerings
- Exhibits168: Vesuvius Plc - Segment focus
- Exhibits169: Inclusions checklist
- Exhibits170: Exclusions checklist
- Exhibits171: Currency conversion rates for US$
- Exhibits172: Research methodology
- Exhibits173: Information sources
- Exhibits174: Data validation
- Exhibits175: Validation techniques employed for market sizing
- Exhibits176: Data synthesis
- Exhibits177: 360 degree market analysis
- Exhibits178: List of abbreviations
Refractory Materials Market For Steel Industry 2024-2028
The refractory materials market for steel industry is forecasted to grow by USD 2369.4 mn during 2023-2028, accelerating at a CAGR of 4.5% during the forecast period. The report on the refractory materials market for steel industry provides a holistic analysis, market size and forecast, trends, growth drivers, and challenges, as well as vendor analysis covering around 25 vendors.
The report offers an up-to-date analysis regarding the current market scenario, the latest trends and drivers, and the overall market environment. The market is driven by increasing demand for steel from construction, infrastructure, automotive, and other sectors, increasing research and development activities by vendors, and increasing capacity developments in steel industry.
| Market Scope | |
|---|---|
| Base Year | 2024 |
| End Year | 2028 |
| Series Year | 2024-2028 |
| Growth Momentum | Accelerate |
| YOY 2024 | 4.2% |
| CAGR | 4.5% |
| Incremental Value | $2369.4 mn |
Technavio's refractory materials market for steel industry is segmented as below:
By Product
- Brick
- Monolithic
By Type
- Acidic and neutral
- Basic
By Geographical Landscape
- APAC
- Europe
- North America
- South America
- Middle East and Africa
This study identifies the rising popularity of monolithic refractories over shaped refractories as one of the prime reasons driving the refractory materials market for steel industry growth during the next few years. Also, launch of novel products and environment-friendly refractories and increased use of steel in industrial applications will lead to sizable demand in the market.
The report on the refractory materials market for steel industry covers the following areas:
- Refractory Materials Market For Steel Industry sizing
- Refractory Materials Market For Steel Industry forecast
- Refractory Materials Market For Steel Industry industry analysis
The robust vendor analysis is designed to help clients improve their market position, and in line with this, this report provides a detailed analysis of several leading refractory materials market for steel industry vendors that include Allied Mineral Products LLC, Chosun Refractories ENG Co. Ltd., Compagnie de Saint-Gobain S.A., HarbisonWalker International Inc., Imerys S.A., Krosaki Harima Corp., Magnezit Group, Minerals Technologies Inc., Morgan Advanced Materials Plc, Puyang Refractories Group Co. Ltd., Refractarios Alfran S.A, Refractory Minerals Co. Inc., Refratechnik Holding GmbH, RHI Magnesita GmbH, Saudi Refractory Industries, Shinagawa Refractories Co. Ltd., Unifrax I LLC, and Vesuvius Plc. Also, the refractory materials market for steel industry analysis report includes information on upcoming trends and challenges that will influence market growth. This is to help companies strategize and leverage all forthcoming growth opportunities.
The study was conducted using an objective combination of primary and secondary information including inputs from key participants in the industry. The report contains a comprehensive market and vendor landscape in addition to an analysis of the key vendors.
The publisher presents a detailed picture of the market by the way of study, synthesis, and summation of data from multiple sources by an analysis of key parameters such as profit, pricing, competition, and promotions. It presents various market facets by identifying the key industry influencers. The data presented is comprehensive, reliable, and a result of extensive primary and secondary research. The market research reports provide a complete competitive landscape and an in-depth vendor selection methodology and analysis using qualitative and quantitative research to forecast accurate market growth.
Table of Contents
1 Executive Summary
- 1.1 Market overview
- Executive Summary - Chart on Market Overview
- Executive Summary - Data Table on Market Overview
- Executive Summary - Chart on Global Market Characteristics
- Executive Summary - Chart on Market By Geographical Landscape
- Executive Summary - Chart on Market Segmentation by Product
- Executive Summary - Chart on Market Segmentation by Type
- Executive Summary - Chart on Incremental Growth
- Executive Summary - Data Table on Incremental Growth
- Executive Summary - Chart on Company Market Positioning
2 Market Landscape
- 2.1 Market ecosystem
- Parent Market
- Data Table on - Parent Market
- 2.2 Market characteristics
- Market characteristics analysis
- 2.3 Value chain analysis
- Value Chain Analysis
3 Market Sizing
- 3.1 Market definition
- Offerings of companies included in the market definition
- 3.2 Market segment analysis
- Market segments
- 3.3 Market size 2023
- 3.4 Market outlook: Forecast for 2023-2028
- Chart on Global - Market size and forecast 2023-2028 ($ million)
- Data Table on Global - Market size and forecast 2023-2028 ($ million)
- Chart on Global Market: Year-over-year growth 2023-2028 (%)
- Data Table on Global Market: Year-over-year growth 2023-2028 (%)
4 Historic Market Size
- 4.1 Global Refractory Materials Market For Steel Industry 2018 - 2022
- Historic Market Size - Data Table on Global Refractory Materials Market For Steel Industry 2018 - 2022 ($ million)
- 4.2 Product segment analysis 2018 - 2022
- Historic Market Size - Product Segment 2018 - 2022 ($ million)
- 4.3 Type segment analysis 2018 - 2022
- Historic Market Size - Type Segment 2018 - 2022 ($ million)
- 4.4 Geography segment analysis 2018 - 2022
- Historic Market Size - Geography Segment 2018 - 2022 ($ million)
- 4.5 Country segment analysis 2018 - 2022
- Historic Market Size - Country Segment 2018 - 2022 ($ million)
5 Five Forces Analysis
- 5.1 Five forces summary
- Five forces analysis - Comparison between 2023 and 2028
- 5.2 Bargaining power of buyers
- Bargaining power of buyers - Impact of key factors 2023 and 2028
- 5.3 Bargaining power of suppliers
- Bargaining power of suppliers - Impact of key factors in 2023 and 2028
- 5.4 Threat of new entrants
- Threat of new entrants - Impact of key factors in 2023 and 2028
- 5.5 Threat of substitutes
- Threat of substitutes - Impact of key factors in 2023 and 2028
- 5.6 Threat of rivalry
- Threat of rivalry - Impact of key factors in 2023 and 2028
- 5.7 Market condition
- Chart on Market condition - Five forces 2023 and 2028
6 Market Segmentation by Product
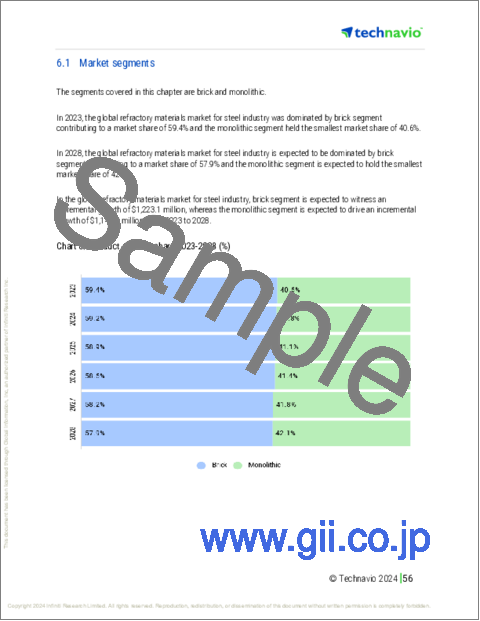
- 6.1 Market segments
- Chart on Product - Market share 2023-2028 (%)
- Data Table on Product - Market share 2023-2028 (%)
- 6.2 Comparison by Product
- Chart on Comparison by Product
- Data Table on Comparison by Product
- 6.3 Brick - Market size and forecast 2023-2028
- Chart on Brick - Market size and forecast 2023-2028 ($ million)
- Data Table on Brick - Market size and forecast 2023-2028 ($ million)
- Chart on Brick - Year-over-year growth 2023-2028 (%)
- Data Table on Brick - Year-over-year growth 2023-2028 (%)
- 6.4 Monolithic - Market size and forecast 2023-2028
- Chart on Monolithic - Market size and forecast 2023-2028 ($ million)
- Data Table on Monolithic - Market size and forecast 2023-2028 ($ million)
- Chart on Monolithic - Year-over-year growth 2023-2028 (%)
- Data Table on Monolithic - Year-over-year growth 2023-2028 (%)
- 6.5 Market opportunity by Product
- Market opportunity by Product ($ million)
- Data Table on Market opportunity by Product ($ million)
7 Market Segmentation by Type
- 7.1 Market segments
- Chart on Type - Market share 2023-2028 (%)
- Data Table on Type - Market share 2023-2028 (%)
- 7.2 Comparison by Type
- Chart on Comparison by Type
- Data Table on Comparison by Type
- 7.3 Acidic and neutral - Market size and forecast 2023-2028
- Chart on Acidic and neutral - Market size and forecast 2023-2028 ($ million)
- Data Table on Acidic and neutral - Market size and forecast 2023-2028 ($ million)
- Chart on Acidic and neutral - Year-over-year growth 2023-2028 (%)
- Data Table on Acidic and neutral - Year-over-year growth 2023-2028 (%)
- 7.4 Basic - Market size and forecast 2023-2028
- Chart on Basic - Market size and forecast 2023-2028 ($ million)
- Data Table on Basic - Market size and forecast 2023-2028 ($ million)
- Chart on Basic - Year-over-year growth 2023-2028 (%)
- Data Table on Basic - Year-over-year growth 2023-2028 (%)
- 7.5 Market opportunity by Type
- Market opportunity by Type ($ million)
- Data Table on Market opportunity by Type ($ million)
8 Customer Landscape
- 8.1 Customer landscape overview
- Analysis of price sensitivity, lifecycle, customer purchase basket, adoption rates, and purchase criteria
9 Geographic Landscape
- 9.1 Geographic segmentation
- Chart on Market share By Geographical Landscape 2023-2028 (%)
- Data Table on Market share By Geographical Landscape 2023-2028 (%)
- 9.2 Geographic comparison
- Chart on Geographic comparison
- Data Table on Geographic comparison
- 9.3 APAC - Market size and forecast 2023-2028
- Chart on APAC - Market size and forecast 2023-2028 ($ million)
- Data Table on APAC - Market size and forecast 2023-2028 ($ million)
- Chart on APAC - Year-over-year growth 2023-2028 (%)
- Data Table on APAC - Year-over-year growth 2023-2028 (%)
- 9.4 Europe - Market size and forecast 2023-2028
- Chart on Europe - Market size and forecast 2023-2028 ($ million)
- Data Table on Europe - Market size and forecast 2023-2028 ($ million)
- Chart on Europe - Year-over-year growth 2023-2028 (%)
- Data Table on Europe - Year-over-year growth 2023-2028 (%)
- 9.5 North America - Market size and forecast 2023-2028
- Chart on North America - Market size and forecast 2023-2028 ($ million)
- Data Table on North America - Market size and forecast 2023-2028 ($ million)
- Chart on North America - Year-over-year growth 2023-2028 (%)
- Data Table on North America - Year-over-year growth 2023-2028 (%)
- 9.6 South America - Market size and forecast 2023-2028
- Chart on South America - Market size and forecast 2023-2028 ($ million)
- Data Table on South America - Market size and forecast 2023-2028 ($ million)
- Chart on South America - Year-over-year growth 2023-2028 (%)
- Data Table on South America - Year-over-year growth 2023-2028 (%)
- 9.7 Middle East and Africa - Market size and forecast 2023-2028
- Chart on Middle East and Africa - Market size and forecast 2023-2028 ($ million)
- Data Table on Middle East and Africa - Market size and forecast 2023-2028 ($ million)
- Chart on Middle East and Africa - Year-over-year growth 2023-2028 (%)
- Data Table on Middle East and Africa - Year-over-year growth 2023-2028 (%)
- 9.8 India - Market size and forecast 2023-2028
- Chart on India - Market size and forecast 2023-2028 ($ million)
- Data Table on India - Market size and forecast 2023-2028 ($ million)
- Chart on India - Year-over-year growth 2023-2028 (%)
- Data Table on India - Year-over-year growth 2023-2028 (%)
- 9.9 China - Market size and forecast 2023-2028
- Chart on China - Market size and forecast 2023-2028 ($ million)
- Data Table on China - Market size and forecast 2023-2028 ($ million)
- Chart on China - Year-over-year growth 2023-2028 (%)
- Data Table on China - Year-over-year growth 2023-2028 (%)
- 9.10 Japan - Market size and forecast 2023-2028
- Chart on Japan - Market size and forecast 2023-2028 ($ million)
- Data Table on Japan - Market size and forecast 2023-2028 ($ million)
- Chart on Japan - Year-over-year growth 2023-2028 (%)
- Data Table on Japan - Year-over-year growth 2023-2028 (%)
- 9.11 Russia - Market size and forecast 2023-2028
- Chart on Russia - Market size and forecast 2023-2028 ($ million)
- Data Table on Russia - Market size and forecast 2023-2028 ($ million)
- Chart on Russia - Year-over-year growth 2023-2028 (%)
- Data Table on Russia - Year-over-year growth 2023-2028 (%)
- 9.12 US - Market size and forecast 2023-2028
- Chart on US - Market size and forecast 2023-2028 ($ million)
- Data Table on US - Market size and forecast 2023-2028 ($ million)
- Chart on US - Year-over-year growth 2023-2028 (%)
- Data Table on US - Year-over-year growth 2023-2028 (%)
- 9.13 Market opportunity By Geographical Landscape
- Market opportunity By Geographical Landscape ($ million)
- Data Tables on Market opportunity By Geographical Landscape ($ million)
10 Drivers, Challenges, and Opportunity/Restraints
- 10.1 Market drivers
- 10.2 Market challenges
- 10.3 Impact of drivers and challenges
- Impact of drivers and challenges in 2023 and 2028
- 10.4 Market opportunities/restraints
11 Competitive Landscape
- 11.1 Overview
- 11.2 Competitive Landscape
- Overview on criticality of inputs and factors of differentiation
- 11.3 Landscape disruption
- Overview on factors of disruption
- 11.4 Industry risks
- Impact of key risks on business
12 Competitive Analysis
- 12.1 Companies profiled
- Companies covered
- 12.2 Market positioning of companies
- Matrix on companies position and classification
- 12.3 Allied Mineral Products LLC
- Allied Mineral Products LLC - Overview
- Allied Mineral Products LLC - Product / Service
- Allied Mineral Products LLC - Key offerings
- 12.4 Compagnie de Saint-Gobain S.A.
- Compagnie de Saint-Gobain S.A. - Overview
- Compagnie de Saint-Gobain S.A. - Business segments
- Compagnie de Saint-Gobain S.A. - Key news
- Compagnie de Saint-Gobain S.A. - Key offerings
- Compagnie de Saint-Gobain S.A. - Segment focus
- 12.5 HarbisonWalker International Inc.
- HarbisonWalker International Inc. - Overview
- HarbisonWalker International Inc. - Product / Service
- HarbisonWalker International Inc. - Key offerings
- 12.6 Imerys S.A.
- Imerys S.A. - Overview
- Imerys S.A. - Business segments
- Imerys S.A. - Key offerings
- Imerys S.A. - Segment focus
- 12.7 Krosaki Harima Corp.
- Krosaki Harima Corp. - Overview
- Krosaki Harima Corp. - Business segments
- Krosaki Harima Corp. - Key offerings
- Krosaki Harima Corp. - Segment focus
- 12.8 Magnezit Group
- Magnezit Group - Overview
- Magnezit Group - Product / Service
- Magnezit Group - Key offerings
- 12.9 Minerals Technologies Inc.
- Minerals Technologies Inc. - Overview
- Minerals Technologies Inc. - Business segments
- Minerals Technologies Inc. - Key news
- Minerals Technologies Inc. - Key offerings
- Minerals Technologies Inc. - Segment focus
- 12.10 Morgan Advanced Materials Plc
- Morgan Advanced Materials Plc - Overview
- Morgan Advanced Materials Plc - Business segments
- Morgan Advanced Materials Plc - Key news
- Morgan Advanced Materials Plc - Key offerings
- Morgan Advanced Materials Plc - Segment focus
- 12.11 Refractarios Alfran S.A
- Refractarios Alfran S.A - Overview
- Refractarios Alfran S.A - Product / Service
- Refractarios Alfran S.A - Key offerings
- 12.12 Refractory Minerals Co. Inc.
- Refractory Minerals Co. Inc. - Overview
- Refractory Minerals Co. Inc. - Product / Service
- Refractory Minerals Co. Inc. - Key offerings
- 12.13 Refratechnik Holding GmbH
- Refratechnik Holding GmbH - Overview
- Refratechnik Holding GmbH - Product / Service
- Refratechnik Holding GmbH - Key offerings
- 12.14 RHI Magnesita GmbH
- RHI Magnesita GmbH - Overview
- RHI Magnesita GmbH - Business segments
- RHI Magnesita GmbH - Key news
- RHI Magnesita GmbH - Key offerings
- RHI Magnesita GmbH - Segment focus
- 12.15 Shinagawa Refractories Co. Ltd.
- Shinagawa Refractories Co. Ltd. - Overview
- Shinagawa Refractories Co. Ltd. - Product / Service
- Shinagawa Refractories Co. Ltd. - Key offerings
- 12.16 Unifrax I LLC
- Unifrax I LLC - Overview
- Unifrax I LLC - Product / Service
- Unifrax I LLC - Key offerings
- 12.17 Vesuvius Plc
- Vesuvius Plc - Overview
- Vesuvius Plc - Business segments
- Vesuvius Plc - Key offerings
- Vesuvius Plc - Segment focus
13 Appendix
- 13.1 Scope of the report
- 13.2 Inclusions and exclusions checklist
- Inclusions checklist
- Exclusions checklist
- 13.3 Currency conversion rates for US$
- Currency conversion rates for US$
- 13.4 Research methodology
- Research methodology
- 13.5 Data procurement
- Information sources
- 13.6 Data validation
- Data validation
- 13.7 Validation techniques employed for market sizing
- Validation techniques employed for market sizing
- 13.8 Data synthesis
- Data synthesis
- 13.9 360 degree market analysis
- 360 degree market analysis
- 13.10 List of abbreviations
- List of abbreviations

