|
|
市場調査レポート
商品コード
1626212
室内用植物の世界市場、2025~2029年Global Indoor Plants Market 2025-2029 |
||||||

|
|||||||
カスタマイズ可能
|
|||||||


| 室内用植物の世界市場、2025~2029年 |
|
出版日: 2024年12月17日
発行: TechNavio
ページ情報: 英文 202 Pages
納期: 即納可能
|

全表示
- 概要
- 図表
- 目次
室内用植物市場、2025~2029年
室内用植物市場は2024~2029年に64億970万米ドル、予測期間中のCAGRは5.1%で成長すると予測されます。当レポートでは、室内用植物市場の全体的な分析、市場規模・予測、動向、成長促進要因、課題、約25のベンダーを網羅したベンダー分析などを掲載しています。
現在の市場シナリオ、最新動向と促進要因、市場環境全体に関する最新分析を提供しています。屋内ガーデニングへの関心の高まり、都市化と屋外スペースの制限、屋内空気汚染への関心の高まりなどが市場を牽引しています。
| 市場範囲 | |
|---|---|
| 基準年 | 2025年 |
| 終了年 | 2029年 |
| 予測期間 | 2025~2029年 |
| 成長モメンタム | 加速 |
| 前年比[2025年 | 3.8% |
| CAGR | 5.1% |
| 増分額 | 64億970万米ドル |
本調査では、今後数年間の室内用植物市場の成長を牽引する主要要因の1つとして、スマートセンサーの統合を挙げています。また、eコマースの成長とテラリウムの復活が市場の大きな需要につながります。
目次
第1章 エグゼクティブサマリー
- 市場概要
第2章 Technavio分析
- 価格・ライフサイクル・顧客購入バスケット・採用率・購入基準の分析
- インプットの重要性と差別化の要因
- 混乱の要因
- 促進要因と課題の影響
第3章 市場情勢
- 市場エコシステム
- 市場の特徴
- バリューチェーン分析
第4章 市場規模
- 市場の定義
- 市場セグメント分析
- 市場規模 2024
- 市場の展望 2024~2029年
第5章 市場規模実績
- 室内用植物の世界市場 2019~2023年
- タイプ別セグメント分析 2019~2023年
- エンドユーザー別セグメント分析 2019~2023年
- 地域別セグメント分析 2019~2023年
- 国別セグメント分析 2019~2023年
第6章 定性分析
- AIがもたらす影響室内用植物の世界市場
第7章 ファイブフォース分析
- ファイブフォースの要約
- 買い手の交渉力
- 供給企業の交渉力
- 新規参入業者の脅威
- 代替品の脅威
- 競争の脅威
- 市況
第8章 市場セグメンテーション:タイプ別
- 市場セグメント
- 比較:タイプ別
- 観葉植物:市場規模と予測 2024~2029年
- 開花植物:市場規模と予測 2024~2029年
- 多肉植物:市場規模と予測 2024~2029年
- その他:市場規模と予測 2024~2029年
- 市場機会:タイプ別
第9章 市場セグメンテーション:エンドユーザー別
- 市場セグメント
- 比較:エンドユーザー別
- 住宅用:市場規模と予測 2024~2029年
- 商業用:市場規模と予測 2024~2029年
- 市場機会:エンドユーザー別
第10章 顧客情勢
- 顧客情勢概要
第11章 地域別情勢
- 地域別セグメンテーション
- 比較:地域別
- 北米:市場規模と予測 2024~2029年
- 欧州:市場規模と予測 2024~2029年
- アジア太平洋:市場規模と予測 2024~2029年
- 南米:市場規模と予測 2024~2029年
- 中東・アフリカ:市場規模と予測 2024~2029年
- 米国:市場規模と予測 2024~2029年
- 中国:市場規模と予測 2024~2029年
- ドイツ:市場規模と予測 2024~2029年
- 日本:市場規模と予測 2024~2029年
- 英国:市場規模と予測 2024~2029年
- インド:市場規模と予測 2024~2029年
- オーストラリア:市場規模と予測 2024~2029年
- フランス:市場規模と予測 2024~2029年
- ブラジル:市場規模と予測 2024~2029年
- カナダ:市場規模と予測 2024~2029年
- 地域情勢による市場機会
第12章 促進要因・課題・機会・抑制要因
- 市場促進要因
- 市場課題
- 促進要因と課題の影響
- 市場機会・抑制要因
第13章 競合情勢
- 概要
- 競合情勢
- 混乱の状況
- 産業のリスク
第14章 競合分析
- 企業プロファイル
- 企業ランキング指数
- 企業の市場ポジショニング
- Beekenkamp Verpakkingen B.V
- Costa Farms LLC
- Double H Nurseries Ltd.
- Dummen Orange
- Dutch Flower Group
- Home Depot Inc.
- Lowes Co. Inc.
- Marginpar BV
- Rentokil Initial Plc
- Rolling Nature
- Rootly Plant Decor Pvt. Ltd.
- Santhi Online Plants
- Selecta Klemm GmbH and Co. KG
- The Sill Inc
- Walter Blom Plants BV
第15章 付録
Exhibits:
- Exhibits1: Executive Summary - Chart on Market Overview
- Exhibits2: Executive Summary - Data Table on Market Overview
- Exhibits3: Executive Summary - Chart on Global Market Characteristics
- Exhibits4: Executive Summary - Chart on Market By Geographical Landscape
- Exhibits5: Executive Summary - Chart on Market Segmentation by Type
- Exhibits6: Executive Summary - Chart on Market Segmentation by End-user
- Exhibits7: Executive Summary - Chart on Incremental Growth
- Exhibits8: Executive Summary - Data Table on Incremental Growth
- Exhibits9: Executive Summary - Chart on Company Market Positioning
- Exhibits10: Analysis of price sensitivity, lifecycle, customer purchase basket, adoption rates, and purchase criteria
- Exhibits11: Overview on criticality of inputs and factors of differentiation
- Exhibits12: Overview on factors of disruption
- Exhibits13: Impact of drivers and challenges in 2024 and 2029
- Exhibits14: Parent Market
- Exhibits15: Data Table on - Parent Market
- Exhibits16: Market characteristics analysis
- Exhibits17: Value chain analysis
- Exhibits18: Offerings of companies included in the market definition
- Exhibits19: Market segments
- Exhibits20: Chart on Global - Market size and forecast 2024-2029 ($ million)
- Exhibits21: Data Table on Global - Market size and forecast 2024-2029 ($ million)
- Exhibits22: Chart on Global Market: Year-over-year growth 2024-2029 (%)
- Exhibits23: Data Table on Global Market: Year-over-year growth 2024-2029 (%)
- Exhibits24: Historic Market Size - Data Table on Global Indoor Plants Market 2019 - 2023 ($ million)
- Exhibits25: Historic Market Size - Type Segment 2019 - 2023 ($ million)
- Exhibits26: Historic Market Size - End-user Segment 2019 - 2023 ($ million)
- Exhibits27: Historic Market Size - Geography Segment 2019 - 2023 ($ million)
- Exhibits28: Historic Market Size - Country Segment 2019 - 2023 ($ million)
- Exhibits29: Five forces analysis - Comparison between 2024 and 2029
- Exhibits30: Bargaining power of buyers - Impact of key factors 2024 and 2029
- Exhibits31: Bargaining power of suppliers - Impact of key factors in 2024 and 2029
- Exhibits32: Threat of new entrants - Impact of key factors in 2024 and 2029
- Exhibits33: Threat of substitutes - Impact of key factors in 2024 and 2029
- Exhibits34: Threat of rivalry - Impact of key factors in 2024 and 2029
- Exhibits35: Chart on Market condition - Five forces 2024 and 2029
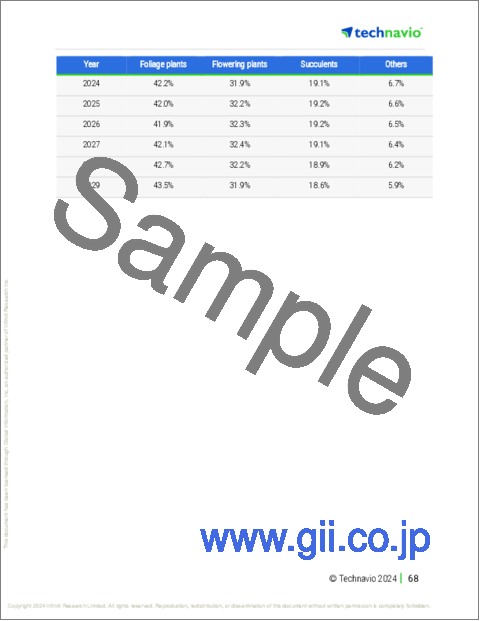
- Exhibits36: Chart on Type - Market share 2024-2029 (%)
- Exhibits37: Data Table on Type - Market share 2024-2029 (%)
- Exhibits38: Chart on Comparison by Type
- Exhibits39: Data Table on Comparison by Type
- Exhibits40: Chart on Foliage plants - Market size and forecast 2024-2029 ($ million)
- Exhibits41: Data Table on Foliage plants - Market size and forecast 2024-2029 ($ million)
- Exhibits42: Chart on Foliage plants - Year-over-year growth 2024-2029 (%)
- Exhibits43: Data Table on Foliage plants - Year-over-year growth 2024-2029 (%)
- Exhibits44: Chart on Flowering plants - Market size and forecast 2024-2029 ($ million)
- Exhibits45: Data Table on Flowering plants - Market size and forecast 2024-2029 ($ million)
- Exhibits46: Chart on Flowering plants - Year-over-year growth 2024-2029 (%)
- Exhibits47: Data Table on Flowering plants - Year-over-year growth 2024-2029 (%)
- Exhibits48: Chart on Succulents - Market size and forecast 2024-2029 ($ million)
- Exhibits49: Data Table on Succulents - Market size and forecast 2024-2029 ($ million)
- Exhibits50: Chart on Succulents - Year-over-year growth 2024-2029 (%)
- Exhibits51: Data Table on Succulents - Year-over-year growth 2024-2029 (%)
- Exhibits52: Chart on Others - Market size and forecast 2024-2029 ($ million)
- Exhibits53: Data Table on Others - Market size and forecast 2024-2029 ($ million)
- Exhibits54: Chart on Others - Year-over-year growth 2024-2029 (%)
- Exhibits55: Data Table on Others - Year-over-year growth 2024-2029 (%)
- Exhibits56: Market opportunity by Type ($ million)
- Exhibits57: Data Table on Market opportunity by Type ($ million)
- Exhibits58: Chart on End-user - Market share 2024-2029 (%)
- Exhibits59: Data Table on End-user - Market share 2024-2029 (%)
- Exhibits60: Chart on Comparison by End-user
- Exhibits61: Data Table on Comparison by End-user
- Exhibits62: Chart on Residential - Market size and forecast 2024-2029 ($ million)
- Exhibits63: Data Table on Residential - Market size and forecast 2024-2029 ($ million)
- Exhibits64: Chart on Residential - Year-over-year growth 2024-2029 (%)
- Exhibits65: Data Table on Residential - Year-over-year growth 2024-2029 (%)
- Exhibits66: Chart on Commercial - Market size and forecast 2024-2029 ($ million)
- Exhibits67: Data Table on Commercial - Market size and forecast 2024-2029 ($ million)
- Exhibits68: Chart on Commercial - Year-over-year growth 2024-2029 (%)
- Exhibits69: Data Table on Commercial - Year-over-year growth 2024-2029 (%)
- Exhibits70: Market opportunity by End-user ($ million)
- Exhibits71: Data Table on Market opportunity by End-user ($ million)
- Exhibits72: Analysis of price sensitivity, lifecycle, customer purchase basket, adoption rates, and purchase criteria
- Exhibits73: Chart on Market share By Geographical Landscape 2024-2029 (%)
- Exhibits74: Data Table on Market share By Geographical Landscape 2024-2029 (%)
- Exhibits75: Chart on Geographic comparison
- Exhibits76: Data Table on Geographic comparison
- Exhibits77: Chart on North America - Market size and forecast 2024-2029 ($ million)
- Exhibits78: Data Table on North America - Market size and forecast 2024-2029 ($ million)
- Exhibits79: Chart on North America - Year-over-year growth 2024-2029 (%)
- Exhibits80: Data Table on North America - Year-over-year growth 2024-2029 (%)
- Exhibits81: Chart on Europe - Market size and forecast 2024-2029 ($ million)
- Exhibits82: Data Table on Europe - Market size and forecast 2024-2029 ($ million)
- Exhibits83: Chart on Europe - Year-over-year growth 2024-2029 (%)
- Exhibits84: Data Table on Europe - Year-over-year growth 2024-2029 (%)
- Exhibits85: Chart on APAC - Market size and forecast 2024-2029 ($ million)
- Exhibits86: Data Table on APAC - Market size and forecast 2024-2029 ($ million)
- Exhibits87: Chart on APAC - Year-over-year growth 2024-2029 (%)
- Exhibits88: Data Table on APAC - Year-over-year growth 2024-2029 (%)
- Exhibits89: Chart on South America - Market size and forecast 2024-2029 ($ million)
- Exhibits90: Data Table on South America - Market size and forecast 2024-2029 ($ million)
- Exhibits91: Chart on South America - Year-over-year growth 2024-2029 (%)
- Exhibits92: Data Table on South America - Year-over-year growth 2024-2029 (%)
- Exhibits93: Chart on Middle East and Africa - Market size and forecast 2024-2029 ($ million)
- Exhibits94: Data Table on Middle East and Africa - Market size and forecast 2024-2029 ($ million)
- Exhibits95: Chart on Middle East and Africa - Year-over-year growth 2024-2029 (%)
- Exhibits96: Data Table on Middle East and Africa - Year-over-year growth 2024-2029 (%)
- Exhibits97: Chart on US - Market size and forecast 2024-2029 ($ million)
- Exhibits98: Data Table on US - Market size and forecast 2024-2029 ($ million)
- Exhibits99: Chart on US - Year-over-year growth 2024-2029 (%)
- Exhibits100: Data Table on US - Year-over-year growth 2024-2029 (%)
- Exhibits101: Chart on China - Market size and forecast 2024-2029 ($ million)
- Exhibits102: Data Table on China - Market size and forecast 2024-2029 ($ million)
- Exhibits103: Chart on China - Year-over-year growth 2024-2029 (%)
- Exhibits104: Data Table on China - Year-over-year growth 2024-2029 (%)
- Exhibits105: Chart on Germany - Market size and forecast 2024-2029 ($ million)
- Exhibits106: Data Table on Germany - Market size and forecast 2024-2029 ($ million)
- Exhibits107: Chart on Germany - Year-over-year growth 2024-2029 (%)
- Exhibits108: Data Table on Germany - Year-over-year growth 2024-2029 (%)
- Exhibits109: Chart on Japan - Market size and forecast 2024-2029 ($ million)
- Exhibits110: Data Table on Japan - Market size and forecast 2024-2029 ($ million)
- Exhibits111: Chart on Japan - Year-over-year growth 2024-2029 (%)
- Exhibits112: Data Table on Japan - Year-over-year growth 2024-2029 (%)
- Exhibits113: Chart on UK - Market size and forecast 2024-2029 ($ million)
- Exhibits114: Data Table on UK - Market size and forecast 2024-2029 ($ million)
- Exhibits115: Chart on UK - Year-over-year growth 2024-2029 (%)
- Exhibits116: Data Table on UK - Year-over-year growth 2024-2029 (%)
- Exhibits117: Chart on India - Market size and forecast 2024-2029 ($ million)
- Exhibits118: Data Table on India - Market size and forecast 2024-2029 ($ million)
- Exhibits119: Chart on India - Year-over-year growth 2024-2029 (%)
- Exhibits120: Data Table on India - Year-over-year growth 2024-2029 (%)
- Exhibits121: Chart on Australia - Market size and forecast 2024-2029 ($ million)
- Exhibits122: Data Table on Australia - Market size and forecast 2024-2029 ($ million)
- Exhibits123: Chart on Australia - Year-over-year growth 2024-2029 (%)
- Exhibits124: Data Table on Australia - Year-over-year growth 2024-2029 (%)
- Exhibits125: Chart on France - Market size and forecast 2024-2029 ($ million)
- Exhibits126: Data Table on France - Market size and forecast 2024-2029 ($ million)
- Exhibits127: Chart on France - Year-over-year growth 2024-2029 (%)
- Exhibits128: Data Table on France - Year-over-year growth 2024-2029 (%)
- Exhibits129: Chart on Brazil - Market size and forecast 2024-2029 ($ million)
- Exhibits130: Data Table on Brazil - Market size and forecast 2024-2029 ($ million)
- Exhibits131: Chart on Brazil - Year-over-year growth 2024-2029 (%)
- Exhibits132: Data Table on Brazil - Year-over-year growth 2024-2029 (%)
- Exhibits133: Chart on Canada - Market size and forecast 2024-2029 ($ million)
- Exhibits134: Data Table on Canada - Market size and forecast 2024-2029 ($ million)
- Exhibits135: Chart on Canada - Year-over-year growth 2024-2029 (%)
- Exhibits136: Data Table on Canada - Year-over-year growth 2024-2029 (%)
- Exhibits137: Market opportunity By Geographical Landscape ($ million)
- Exhibits138: Data Tables on Market opportunity By Geographical Landscape ($ million)
- Exhibits139: Impact of drivers and challenges in 2024 and 2029
- Exhibits140: Overview on criticality of inputs and factors of differentiation
- Exhibits141: Overview on factors of disruption
- Exhibits142: Impact of key risks on business
- Exhibits143: Companies covered
- Exhibits144: Company ranking index
- Exhibits145: Matrix on companies position and classification
- Exhibits146: Beekenkamp Verpakkingen B.V - Overview
- Exhibits147: Beekenkamp Verpakkingen B.V - Product / Service
- Exhibits148: Beekenkamp Verpakkingen B.V - Key offerings
- Exhibits149: SWOT
- Exhibits150: Costa Farms LLC - Overview
- Exhibits151: Costa Farms LLC - Product / Service
- Exhibits152: Costa Farms LLC - Key offerings
- Exhibits153: SWOT
- Exhibits154: Double H Nurseries Ltd. - Overview
- Exhibits155: Double H Nurseries Ltd. - Product / Service
- Exhibits156: Double H Nurseries Ltd. - Key offerings
- Exhibits157: SWOT
- Exhibits158: Dummen Orange - Overview
- Exhibits159: Dummen Orange - Product / Service
- Exhibits160: Dummen Orange - Key offerings
- Exhibits161: SWOT
- Exhibits162: Dutch Flower Group - Overview
- Exhibits163: Dutch Flower Group - Product / Service
- Exhibits164: Dutch Flower Group - Key offerings
- Exhibits165: SWOT
- Exhibits166: Home Depot Inc. - Overview
- Exhibits167: Home Depot Inc. - Business segments
- Exhibits168: Home Depot Inc. - Key news
- Exhibits169: Home Depot Inc. - Key offerings
- Exhibits170: Home Depot Inc. - Segment focus
- Exhibits171: SWOT
- Exhibits172: Lowes Co. Inc. - Overview
- Exhibits173: Lowes Co. Inc. - Product / Service
- Exhibits174: Lowes Co. Inc. - Key news
- Exhibits175: Lowes Co. Inc. - Key offerings
- Exhibits176: SWOT
- Exhibits177: Marginpar BV - Overview
- Exhibits178: Marginpar BV - Product / Service
- Exhibits179: Marginpar BV - Key offerings
- Exhibits180: SWOT
- Exhibits181: Rentokil Initial Plc - Overview
- Exhibits182: Rentokil Initial Plc - Business segments
- Exhibits183: Rentokil Initial Plc - Key offerings
- Exhibits184: Rentokil Initial Plc - Segment focus
- Exhibits185: SWOT
- Exhibits186: Rolling Nature - Overview
- Exhibits187: Rolling Nature - Product / Service
- Exhibits188: Rolling Nature - Key offerings
- Exhibits189: SWOT
- Exhibits190: Rootly Plant Decor Pvt. Ltd. - Overview
- Exhibits191: Rootly Plant Decor Pvt. Ltd. - Product / Service
- Exhibits192: Rootly Plant Decor Pvt. Ltd. - Key offerings
- Exhibits193: SWOT
- Exhibits194: Santhi Online Plants - Overview
- Exhibits195: Santhi Online Plants - Product / Service
- Exhibits196: Santhi Online Plants - Key offerings
- Exhibits197: SWOT
- Exhibits198: Selecta Klemm GmbH and Co. KG - Overview
- Exhibits199: Selecta Klemm GmbH and Co. KG - Product / Service
- Exhibits200: Selecta Klemm GmbH and Co. KG - Key offerings
- Exhibits201: SWOT
- Exhibits202: The Sill Inc - Overview
- Exhibits203: The Sill Inc - Product / Service
- Exhibits204: The Sill Inc - Key offerings
- Exhibits205: SWOT
- Exhibits206: Walter Blom Plants BV - Overview
- Exhibits207: Walter Blom Plants BV - Product / Service
- Exhibits208: Walter Blom Plants BV - Key offerings
- Exhibits209: SWOT
- Exhibits210: Inclusions checklist
- Exhibits211: Exclusions checklist
- Exhibits212: Currency conversion rates for US$
- Exhibits213: Research methodology
- Exhibits214: Information sources
- Exhibits215: Data validation
- Exhibits216: Validation techniques employed for market sizing
- Exhibits217: Data synthesis
- Exhibits218: 360 degree market analysis
- Exhibits219: List of abbreviations
Indoor Plants Market 2025-2029
The indoor plants market is forecasted to grow by USD 6409.7 mn during 2024-2029, accelerating at a CAGR of 5.1% during the forecast period. The report on the indoor plants market provides a holistic analysis, market size and forecast, trends, growth drivers, and challenges, as well as vendor analysis covering around 25 vendors.
The report offers an up-to-date analysis regarding the current market scenario, the latest trends and drivers, and the overall market environment. The market is driven by increased interest in indoor gardening, urbanization and limited outdoor space, and growing concern for indoor air pollution.
| Market Scope | |
|---|---|
| Base Year | 2025 |
| End Year | 2029 |
| Series Year | 2025-2029 |
| Growth Momentum | Accelerate |
| YOY 2025 | 3.8% |
| CAGR | 5.1% |
| Incremental Value | $6409.7 mn |
Technavio's indoor plants market is segmented as below:
By Type
- Foliage plants
- Flowering plants
- Succulents
- Others
By End-user
- Residential
- Commercial
By Geographical Landscape
- North America
- Europe
- APAC
- South America
- Middle East and Africa
This study identifies the integration of smart sensors as one of the prime reasons driving the indoor plants market growth during the next few years. Also, e-commerce growth and revival of terrariums will lead to sizable demand in the market.
The report on the indoor plants market covers the following areas:
- Indoor Plants Market sizing
- Indoor Plants Market forecast
- Indoor Plants Market industry analysis
The robust vendor analysis is designed to help clients improve their market position, and in line with this, this report provides a detailed analysis of several leading indoor plants market vendors that include Beekenkamp Verpakkingen B.V, Costa Farms LLC, Double H Nurseries Ltd., Dummen Orange, Dutch Flower Group, Ferns N Petals Pvt. Ltd., Gardeners Supply Co., Home Depot Inc., Lowes Co. Inc., Marginpar BV, Premier Planters, Rentokil Initial Plc, Rocket Farms Inc., Rolling Nature, Rootly Plant Decor Pvt. Ltd., Santhi Online Plants, Selecta Klemm GmbH and Co. KG, The Sill Inc, Urban Plant, and Walter Blom Plants BV. Also, the indoor plants market analysis report includes information on upcoming trends and challenges that will influence market growth. This is to help companies strategize and leverage all forthcoming growth opportunities.
The study was conducted using an objective combination of primary and secondary information including inputs from key participants in the industry. The report contains a comprehensive market and vendor landscape in addition to an analysis of the key vendors.
The publisher presents a detailed picture of the market by the way of study, synthesis, and summation of data from multiple sources by an analysis of key parameters such as profit, pricing, competition, and promotions. It presents various market facets by identifying the key industry influencers. The data presented is comprehensive, reliable, and a result of extensive primary and secondary research. The market research reports provide a complete competitive landscape and an in-depth vendor selection methodology and analysis using qualitative and quantitative research to forecast accurate market growth.
Table of Contents
1 Executive Summary
- 1.1 Market overview
- Executive Summary - Chart on Market Overview
- Executive Summary - Data Table on Market Overview
- Executive Summary - Chart on Global Market Characteristics
- Executive Summary - Chart on Market By Geographical Landscape
- Executive Summary - Chart on Market Segmentation by Type
- Executive Summary - Chart on Market Segmentation by End-user
- Executive Summary - Chart on Incremental Growth
- Executive Summary - Data Table on Incremental Growth
- Executive Summary - Chart on Company Market Positioning
2 Technavio Analysis
- 2.1 Analysis of price sensitivity, lifecycle, customer purchase basket, adoption rates, and purchase criteria
- Analysis of price sensitivity, lifecycle, customer purchase basket, adoption rates, and purchase criteria
- 2.2 Criticality of inputs and Factors of differentiation
- Overview on criticality of inputs and factors of differentiation
- 2.3 Factors of disruption
- Overview on factors of disruption
- 2.4 Impact of drivers and challenges
- Impact of drivers and challenges in 2024 and 2029
3 Market Landscape
- 3.1 Market ecosystem
- Parent Market
- Data Table on - Parent Market
- 3.2 Market characteristics
- Market characteristics analysis
- 3.3 Value chain analysis
- Value chain analysis
4 Market Sizing
- 4.1 Market definition
- Offerings of companies included in the market definition
- 4.2 Market segment analysis
- Market segments
- 4.3 Market size 2024
- 4.4 Market outlook: Forecast for 2024-2029
- Chart on Global - Market size and forecast 2024-2029 ($ million)
- Data Table on Global - Market size and forecast 2024-2029 ($ million)
- Chart on Global Market: Year-over-year growth 2024-2029 (%)
- Data Table on Global Market: Year-over-year growth 2024-2029 (%)
5 Historic Market Size
- 5.1 Global Indoor Plants Market 2019 - 2023
- Historic Market Size - Data Table on Global Indoor Plants Market 2019 - 2023 ($ million)
- 5.2 Type segment analysis 2019 - 2023
- Historic Market Size - Type Segment 2019 - 2023 ($ million)
- 5.3 End-user segment analysis 2019 - 2023
- Historic Market Size - End-user Segment 2019 - 2023 ($ million)
- 5.4 Geography segment analysis 2019 - 2023
- Historic Market Size - Geography Segment 2019 - 2023 ($ million)
- 5.5 Country segment analysis 2019 - 2023
- Historic Market Size - Country Segment 2019 - 2023 ($ million)
6 Qualitative Analysis
- 6.1 The Impact of AI on the Global Indoor Plants Market
7 Five Forces Analysis
- 7.1 Five forces summary
- Five forces analysis - Comparison between 2024 and 2029
- 7.2 Bargaining power of buyers
- Bargaining power of buyers - Impact of key factors 2024 and 2029
- 7.3 Bargaining power of suppliers
- Bargaining power of suppliers - Impact of key factors in 2024 and 2029
- 7.4 Threat of new entrants
- Threat of new entrants - Impact of key factors in 2024 and 2029
- 7.5 Threat of substitutes
- Threat of substitutes - Impact of key factors in 2024 and 2029
- 7.6 Threat of rivalry
- Threat of rivalry - Impact of key factors in 2024 and 2029
- 7.7 Market condition
- Chart on Market condition - Five forces 2024 and 2029
8 Market Segmentation by Type
- 8.1 Market segments
- Chart on Type - Market share 2024-2029 (%)
- Data Table on Type - Market share 2024-2029 (%)
- 8.2 Comparison by Type
- Chart on Comparison by Type
- Data Table on Comparison by Type
- 8.3 Foliage plants - Market size and forecast 2024-2029
- Chart on Foliage plants - Market size and forecast 2024-2029 ($ million)
- Data Table on Foliage plants - Market size and forecast 2024-2029 ($ million)
- Chart on Foliage plants - Year-over-year growth 2024-2029 (%)
- Data Table on Foliage plants - Year-over-year growth 2024-2029 (%)
- 8.4 Flowering plants - Market size and forecast 2024-2029
- Chart on Flowering plants - Market size and forecast 2024-2029 ($ million)
- Data Table on Flowering plants - Market size and forecast 2024-2029 ($ million)
- Chart on Flowering plants - Year-over-year growth 2024-2029 (%)
- Data Table on Flowering plants - Year-over-year growth 2024-2029 (%)
- 8.5 Succulents - Market size and forecast 2024-2029
- Chart on Succulents - Market size and forecast 2024-2029 ($ million)
- Data Table on Succulents - Market size and forecast 2024-2029 ($ million)
- Chart on Succulents - Year-over-year growth 2024-2029 (%)
- Data Table on Succulents - Year-over-year growth 2024-2029 (%)
- 8.6 Others - Market size and forecast 2024-2029
- Chart on Others - Market size and forecast 2024-2029 ($ million)
- Data Table on Others - Market size and forecast 2024-2029 ($ million)
- Chart on Others - Year-over-year growth 2024-2029 (%)
- Data Table on Others - Year-over-year growth 2024-2029 (%)
- 8.7 Market opportunity by Type
- Market opportunity by Type ($ million)
- Data Table on Market opportunity by Type ($ million)
9 Market Segmentation by End-user
- 9.1 Market segments
- Chart on End-user - Market share 2024-2029 (%)
- Data Table on End-user - Market share 2024-2029 (%)
- 9.2 Comparison by End-user
- Chart on Comparison by End-user
- Data Table on Comparison by End-user
- 9.3 Residential - Market size and forecast 2024-2029
- Chart on Residential - Market size and forecast 2024-2029 ($ million)
- Data Table on Residential - Market size and forecast 2024-2029 ($ million)
- Chart on Residential - Year-over-year growth 2024-2029 (%)
- Data Table on Residential - Year-over-year growth 2024-2029 (%)
- 9.4 Commercial - Market size and forecast 2024-2029
- Chart on Commercial - Market size and forecast 2024-2029 ($ million)
- Data Table on Commercial - Market size and forecast 2024-2029 ($ million)
- Chart on Commercial - Year-over-year growth 2024-2029 (%)
- Data Table on Commercial - Year-over-year growth 2024-2029 (%)
- 9.5 Market opportunity by End-user
- Market opportunity by End-user ($ million)
- Data Table on Market opportunity by End-user ($ million)
10 Customer Landscape
- 10.1 Customer landscape overview
- Analysis of price sensitivity, lifecycle, customer purchase basket, adoption rates, and purchase criteria
11 Geographic Landscape
- 11.1 Geographic segmentation
- Chart on Market share By Geographical Landscape 2024-2029 (%)
- Data Table on Market share By Geographical Landscape 2024-2029 (%)
- 11.2 Geographic comparison
- Chart on Geographic comparison
- Data Table on Geographic comparison
- 11.3 North America - Market size and forecast 2024-2029
- Chart on North America - Market size and forecast 2024-2029 ($ million)
- Data Table on North America - Market size and forecast 2024-2029 ($ million)
- Chart on North America - Year-over-year growth 2024-2029 (%)
- Data Table on North America - Year-over-year growth 2024-2029 (%)
- 11.4 Europe - Market size and forecast 2024-2029
- Chart on Europe - Market size and forecast 2024-2029 ($ million)
- Data Table on Europe - Market size and forecast 2024-2029 ($ million)
- Chart on Europe - Year-over-year growth 2024-2029 (%)
- Data Table on Europe - Year-over-year growth 2024-2029 (%)
- 11.5 APAC - Market size and forecast 2024-2029
- Chart on APAC - Market size and forecast 2024-2029 ($ million)
- Data Table on APAC - Market size and forecast 2024-2029 ($ million)
- Chart on APAC - Year-over-year growth 2024-2029 (%)
- Data Table on APAC - Year-over-year growth 2024-2029 (%)
- 11.6 South America - Market size and forecast 2024-2029
- Chart on South America - Market size and forecast 2024-2029 ($ million)
- Data Table on South America - Market size and forecast 2024-2029 ($ million)
- Chart on South America - Year-over-year growth 2024-2029 (%)
- Data Table on South America - Year-over-year growth 2024-2029 (%)
- 11.7 Middle East and Africa - Market size and forecast 2024-2029
- Chart on Middle East and Africa - Market size and forecast 2024-2029 ($ million)
- Data Table on Middle East and Africa - Market size and forecast 2024-2029 ($ million)
- Chart on Middle East and Africa - Year-over-year growth 2024-2029 (%)
- Data Table on Middle East and Africa - Year-over-year growth 2024-2029 (%)
- 11.8 US - Market size and forecast 2024-2029
- Chart on US - Market size and forecast 2024-2029 ($ million)
- Data Table on US - Market size and forecast 2024-2029 ($ million)
- Chart on US - Year-over-year growth 2024-2029 (%)
- Data Table on US - Year-over-year growth 2024-2029 (%)
- 11.9 China - Market size and forecast 2024-2029
- Chart on China - Market size and forecast 2024-2029 ($ million)
- Data Table on China - Market size and forecast 2024-2029 ($ million)
- Chart on China - Year-over-year growth 2024-2029 (%)
- Data Table on China - Year-over-year growth 2024-2029 (%)
- 11.10 Germany - Market size and forecast 2024-2029
- Chart on Germany - Market size and forecast 2024-2029 ($ million)
- Data Table on Germany - Market size and forecast 2024-2029 ($ million)
- Chart on Germany - Year-over-year growth 2024-2029 (%)
- Data Table on Germany - Year-over-year growth 2024-2029 (%)
- 11.11 Japan - Market size and forecast 2024-2029
- Chart on Japan - Market size and forecast 2024-2029 ($ million)
- Data Table on Japan - Market size and forecast 2024-2029 ($ million)
- Chart on Japan - Year-over-year growth 2024-2029 (%)
- Data Table on Japan - Year-over-year growth 2024-2029 (%)
- 11.12 UK - Market size and forecast 2024-2029
- Chart on UK - Market size and forecast 2024-2029 ($ million)
- Data Table on UK - Market size and forecast 2024-2029 ($ million)
- Chart on UK - Year-over-year growth 2024-2029 (%)
- Data Table on UK - Year-over-year growth 2024-2029 (%)
- 11.13 India - Market size and forecast 2024-2029
- Chart on India - Market size and forecast 2024-2029 ($ million)
- Data Table on India - Market size and forecast 2024-2029 ($ million)
- Chart on India - Year-over-year growth 2024-2029 (%)
- Data Table on India - Year-over-year growth 2024-2029 (%)
- 11.14 Australia - Market size and forecast 2024-2029
- Chart on Australia - Market size and forecast 2024-2029 ($ million)
- Data Table on Australia - Market size and forecast 2024-2029 ($ million)
- Chart on Australia - Year-over-year growth 2024-2029 (%)
- Data Table on Australia - Year-over-year growth 2024-2029 (%)
- 11.15 France - Market size and forecast 2024-2029
- Chart on France - Market size and forecast 2024-2029 ($ million)
- Data Table on France - Market size and forecast 2024-2029 ($ million)
- Chart on France - Year-over-year growth 2024-2029 (%)
- Data Table on France - Year-over-year growth 2024-2029 (%)
- 11.16 Brazil - Market size and forecast 2024-2029
- Chart on Brazil - Market size and forecast 2024-2029 ($ million)
- Data Table on Brazil - Market size and forecast 2024-2029 ($ million)
- Chart on Brazil - Year-over-year growth 2024-2029 (%)
- Data Table on Brazil - Year-over-year growth 2024-2029 (%)
- 11.17 Canada - Market size and forecast 2024-2029
- Chart on Canada - Market size and forecast 2024-2029 ($ million)
- Data Table on Canada - Market size and forecast 2024-2029 ($ million)
- Chart on Canada - Year-over-year growth 2024-2029 (%)
- Data Table on Canada - Year-over-year growth 2024-2029 (%)
- 11.18 Market opportunity By Geographical Landscape
- Market opportunity By Geographical Landscape ($ million)
- Data Tables on Market opportunity By Geographical Landscape ($ million)
12 Drivers, Challenges, and Opportunity/Restraints
- 12.1 Market drivers
- 12.2 Market challenges
- 12.3 Impact of drivers and challenges
- Impact of drivers and challenges in 2024 and 2029
- 12.4 Market opportunities/restraints
13 Competitive Landscape
- 13.1 Overview
- 13.2 Competitive Landscape
- Overview on criticality of inputs and factors of differentiation
- 13.3 Landscape disruption
- Overview on factors of disruption
- 13.4 Industry risks
- Impact of key risks on business
14 Competitive Analysis
- 14.1 Companies profiled
- Companies covered
- 14.2 Company ranking index
- Company ranking index
- 14.3 Market positioning of companies
- Matrix on companies position and classification
- 14.4 Beekenkamp Verpakkingen B.V
- Beekenkamp Verpakkingen B.V - Overview
- Beekenkamp Verpakkingen B.V - Product / Service
- Beekenkamp Verpakkingen B.V - Key offerings
- SWOT
- 14.5 Costa Farms LLC
- Costa Farms LLC - Overview
- Costa Farms LLC - Product / Service
- Costa Farms LLC - Key offerings
- SWOT
- 14.6 Double H Nurseries Ltd.
- Double H Nurseries Ltd. - Overview
- Double H Nurseries Ltd. - Product / Service
- Double H Nurseries Ltd. - Key offerings
- SWOT
- 14.7 Dummen Orange
- Dummen Orange - Overview
- Dummen Orange - Product / Service
- Dummen Orange - Key offerings
- SWOT
- 14.8 Dutch Flower Group
- Dutch Flower Group - Overview
- Dutch Flower Group - Product / Service
- Dutch Flower Group - Key offerings
- SWOT
- 14.9 Home Depot Inc.
- Home Depot Inc. - Overview
- Home Depot Inc. - Business segments
- Home Depot Inc. - Key news
- Home Depot Inc. - Key offerings
- Home Depot Inc. - Segment focus
- SWOT
- 14.10 Lowes Co. Inc.
- Lowes Co. Inc. - Overview
- Lowes Co. Inc. - Product / Service
- Lowes Co. Inc. - Key news
- Lowes Co. Inc. - Key offerings
- SWOT
- 14.11 Marginpar BV
- Marginpar BV - Overview
- Marginpar BV - Product / Service
- Marginpar BV - Key offerings
- SWOT
- 14.12 Rentokil Initial Plc
- Rentokil Initial Plc - Overview
- Rentokil Initial Plc - Business segments
- Rentokil Initial Plc - Key offerings
- Rentokil Initial Plc - Segment focus
- SWOT
- 14.13 Rolling Nature
- Rolling Nature - Overview
- Rolling Nature - Product / Service
- Rolling Nature - Key offerings
- SWOT
- 14.14 Rootly Plant Decor Pvt. Ltd.
- Rootly Plant Decor Pvt. Ltd. - Overview
- Rootly Plant Decor Pvt. Ltd. - Product / Service
- Rootly Plant Decor Pvt. Ltd. - Key offerings
- SWOT
- 14.15 Santhi Online Plants
- Santhi Online Plants - Overview
- Santhi Online Plants - Product / Service
- Santhi Online Plants - Key offerings
- SWOT
- 14.16 Selecta Klemm GmbH and Co. KG
- Selecta Klemm GmbH and Co. KG - Overview
- Selecta Klemm GmbH and Co. KG - Product / Service
- Selecta Klemm GmbH and Co. KG - Key offerings
- SWOT
- 14.17 The Sill Inc
- The Sill Inc - Overview
- The Sill Inc - Product / Service
- The Sill Inc - Key offerings
- SWOT
- 14.18 Walter Blom Plants BV
- Walter Blom Plants BV - Overview
- Walter Blom Plants BV - Product / Service
- Walter Blom Plants BV - Key offerings
- SWOT
15 Appendix
- 15.1 Scope of the report
- 15.2 Inclusions and exclusions checklist
- Inclusions checklist
- Exclusions checklist
- 15.3 Currency conversion rates for US$
- Currency conversion rates for US$
- 15.4 Research methodology
- Research methodology
- 15.5 Data procurement
- Information sources
- 15.6 Data validation
- Data validation
- 15.7 Validation techniques employed for market sizing
- Validation techniques employed for market sizing
- 15.8 Data synthesis
- Data synthesis
- 15.9 360 degree market analysis
- 360 degree market analysis
- 15.10 List of abbreviations
- List of abbreviations
