|
|
市場調査レポート
商品コード
1626196
日本の石炭市場 2024-2028年Coal Market in Japan 2024-2028 |
||||||

|
|||||||
カスタマイズ可能
|
|||||||

| 日本の石炭市場 2024-2028年 |
|
出版日: 2024年12月17日
発行: TechNavio
ページ情報: 英文 130 Pages
納期: 即納可能
|

全表示
- 概要
- 図表
- 目次
日本の石炭市場は2023年から2028年にかけて45億米ドル成長し、予測期間中のCAGRは2%と予測されています。
当レポートでは、日本の石炭市場について包括的な分析、市場規模・予測、動向、成長促進要因、課題、約25のベンダーを網羅したベンダー分析などを掲載しています。
現在の市場シナリオ、最新動向と促進要因、市場環境全体に関する最新分析を提供しています。市場は、より優れた発電技術、産業およびインフラ開発活動の高まり、石炭採掘におけるロボットおよびドライバーレス技術によって牽引されています。
| 市場範囲 | |
|---|---|
| 基準年 | 2024 |
| 終了年 | 2028 |
| 予測期間 | 2024-2028 |
| 成長モメンタム | 加速 |
| 前年比2024年 | 2.1% |
| CAGR | 2% |
| 増分額 | 45億米ドル |
本調査では、今後数年間の日本の石炭市場の成長を促進する主な要因の1つとして、燃料および電力として液体状の石炭を使用することを挙げています。また、石炭燃焼製品(CCP)を使用することの利点や、オペレーショナルエクセレンスを達成するためのデータ主導型洞察の活用は、市場の大きな需要につながります。
目次
第1章 エグゼクティブサマリー
- 市場概要
第2章 Technavio別分析
- 価格・ライフサイクル・顧客購入バスケット・採用率・購入基準の分析
- インプットの重要性と差別化の要因
- 混乱の要因
- 促進要因と課題の影響
第3章 市場情勢
- 市場エコシステム
- 市場の特徴
- バリューチェーン分析
第4章 市場規模
- 市場の定義
- 市場セグメント分析
- 市場規模 2023
- 市場の見通し 2023-2028
第5章 市場規模実績
- 日本の石炭市場 2018-2022
- タイプ別セグメント分析 2018-2022
- 供給源別セグメント分析 2018-2022
第6章 定性分析
- AIの影響:日本の石炭市場
第7章 ファイブフォース分析
- ファイブフォースの要約
- 買い手の交渉力
- 供給企業の交渉力
- 新規参入業者の脅威
- 代替品の脅威
- 競争の脅威
- 市況
第8章 市場セグメンテーション:タイプ別
- 市場セグメント
- 比較:タイプ別
- 火力発電用石炭:市場規模と予測 2023-2028
- 冶金用石炭:市場規模と予測 2023-2028
- 市場機会:タイプ別
第9章 市場セグメンテーション:供給源別
- 市場セグメント
- 比較:供給源別
- 輸入:市場規模と予測 2023-2028
- 国内:市場規模と予測 2023-2028
- 市場機会:供給源別
第10章 顧客情勢
- 顧客情勢の概要
第11章 促進要因・課題・機会・抑制要因
- 市場促進要因
- 市場の課題
- 促進要因と課題の影響
- 市場の機会・抑制要因
第12章 競合情勢
- 概要
- 競合情勢
- 混乱の状況
- 業界のリスク
第13章 競合分析
- 企業プロファイル
- 企業ランキング指数
- 企業の市場ポジショニング
- Banpu Public Co. Ltd.
- BHP Group Ltd.
- Chiyoda Corp.
- ITOCHU Corp.
- J-POWER Electric Power Development Co. Ltd.
- L3Harris Technologies Inc.
- Mitsubishi Heavy Industries Ltd.
- Mitsui and Co. Ltd.
- QCoal Pty Ltd.
- Shandong Energy Group Co. Ltd.
第14章 付録
Exhibits:
- Exhibits1: Executive Summary - Chart on Market Overview
- Exhibits2: Executive Summary - Data Table on Market Overview
- Exhibits3: Executive Summary - Chart on Country Market Characteristics
- Exhibits4: Executive Summary - Chart on Market Segmentation by Type
- Exhibits5: Executive Summary - Chart on Market Segmentation by Source
- Exhibits6: Executive Summary - Chart on Company Market Positioning
- Exhibits7: Analysis of price sensitivity, lifecycle, customer purchase basket, adoption rates, and purchase criteria
- Exhibits8: Overview on criticality of inputs and factors of differentiation
- Exhibits9: Overview on factors of disruption
- Exhibits10: Impact of drivers and challenges in 2023 and 2028
- Exhibits11: Parent Market
- Exhibits12: Data Table on - Parent Market
- Exhibits13: Market characteristics analysis
- Exhibits14: Value chain analysis
- Exhibits15: Offerings of companies included in the market definition
- Exhibits16: Market segments
- Exhibits17: Chart on Japan - Market size and forecast 2023-2028 ($ billion)
- Exhibits18: Data Table on Japan - Market size and forecast 2023-2028 ($ billion)
- Exhibits19: Chart on Japan: Year-over-year growth 2023-2028 (%)
- Exhibits20: Data Table on Japan: Year-over-year growth 2023-2028 (%)
- Exhibits21: Historic Market Size - Data Table on Coal Market in Japan 2018 - 2022 ($ billion)
- Exhibits22: Historic Market Size - Type Segment 2018 - 2022 ($ billion)
- Exhibits23: Historic Market Size - Source Segment 2018 - 2022 ($ billion)
- Exhibits24: Five forces analysis - Comparison between 2023 and 2028
- Exhibits25: Bargaining power of buyers - Impact of key factors 2023 and 2028
- Exhibits26: Bargaining power of suppliers - Impact of key factors in 2023 and 2028
- Exhibits27: Threat of new entrants - Impact of key factors in 2023 and 2028
- Exhibits28: Threat of substitutes - Impact of key factors in 2023 and 2028
- Exhibits29: Threat of rivalry - Impact of key factors in 2023 and 2028
- Exhibits30: Chart on Market condition - Five forces 2023 and 2028
- Exhibits31: Chart on Type - Market share 2023-2028 (%)
- Exhibits32: Data Table on Type - Market share 2023-2028 (%)
- Exhibits33: Chart on Comparison by Type
- Exhibits34: Data Table on Comparison by Type
- Exhibits35: Chart on Thermal coal - Market size and forecast 2023-2028 ($ billion)
- Exhibits36: Data Table on Thermal coal - Market size and forecast 2023-2028 ($ billion)
- Exhibits37: Chart on Thermal coal - Year-over-year growth 2023-2028 (%)
- Exhibits38: Data Table on Thermal coal - Year-over-year growth 2023-2028 (%)
- Exhibits39: Chart on Metallurgical coal - Market size and forecast 2023-2028 ($ billion)
- Exhibits40: Data Table on Metallurgical coal - Market size and forecast 2023-2028 ($ billion)
- Exhibits41: Chart on Metallurgical coal - Year-over-year growth 2023-2028 (%)
- Exhibits42: Data Table on Metallurgical coal - Year-over-year growth 2023-2028 (%)
- Exhibits43: Market opportunity by Type ($ billion)
- Exhibits44: Data Table on Market opportunity by Type ($ billion)
- Exhibits45: Chart on Source - Market share 2023-2028 (%)
- Exhibits46: Data Table on Source - Market share 2023-2028 (%)
- Exhibits47: Chart on Comparison by Source
- Exhibits48: Data Table on Comparison by Source
- Exhibits49: Chart on Import - Market size and forecast 2023-2028 ($ billion)
- Exhibits50: Data Table on Import - Market size and forecast 2023-2028 ($ billion)
- Exhibits51: Chart on Import - Year-over-year growth 2023-2028 (%)
- Exhibits52: Data Table on Import - Year-over-year growth 2023-2028 (%)
- Exhibits53: Chart on Domestic - Market size and forecast 2023-2028 ($ billion)
- Exhibits54: Data Table on Domestic - Market size and forecast 2023-2028 ($ billion)
- Exhibits55: Chart on Domestic - Year-over-year growth 2023-2028 (%)
- Exhibits56: Data Table on Domestic - Year-over-year growth 2023-2028 (%)
- Exhibits57: Market opportunity by Source ($ billion)
- Exhibits58: Data Table on Market opportunity by Source ($ billion)
- Exhibits59: Analysis of price sensitivity, lifecycle, customer purchase basket, adoption rates, and purchase criteria
- Exhibits60: Impact of drivers and challenges in 2023 and 2028
- Exhibits61: Overview on criticality of inputs and factors of differentiation
- Exhibits62: Overview on factors of disruption
- Exhibits63: Impact of key risks on business
- Exhibits64: Companies covered
- Exhibits65: Company ranking index
- Exhibits66: Matrix on companies position and classification
- Exhibits67: Banpu Public Co. Ltd. - Overview
- Exhibits68: Banpu Public Co. Ltd. - Product / Service
- Exhibits69: Banpu Public Co. Ltd. - Key offerings
- Exhibits70: SWOT
- Exhibits71: BHP Group Ltd. - Overview
- Exhibits72: BHP Group Ltd. - Business segments
- Exhibits73: BHP Group Ltd. - Key offerings
- Exhibits74: BHP Group Ltd. - Segment focus
- Exhibits75: SWOT
- Exhibits76: Chiyoda Corp. - Overview
- Exhibits77: Chiyoda Corp. - Business segments
- Exhibits78: Chiyoda Corp. - Key news
- Exhibits79: Chiyoda Corp. - Key offerings
- Exhibits80: Chiyoda Corp. - Segment focus
- Exhibits81: SWOT
- Exhibits82: ITOCHU Corp. - Overview
- Exhibits83: ITOCHU Corp. - Business segments
- Exhibits84: ITOCHU Corp. - Key offerings
- Exhibits85: ITOCHU Corp. - Segment focus
- Exhibits86: SWOT
- Exhibits87: J-POWER Electric Power Development Co. Ltd. - Overview
- Exhibits88: J-POWER Electric Power Development Co. Ltd. - Product / Service
- Exhibits89: J-POWER Electric Power Development Co. Ltd. - Key offerings
- Exhibits90: SWOT
- Exhibits91: L3Harris Technologies Inc. - Overview
- Exhibits92: L3Harris Technologies Inc. - Business segments
- Exhibits93: L3Harris Technologies Inc. - Key news
- Exhibits94: L3Harris Technologies Inc. - Key offerings
- Exhibits95: L3Harris Technologies Inc. - Segment focus
- Exhibits96: SWOT
- Exhibits97: Mitsubishi Heavy Industries Ltd. - Overview
- Exhibits98: Mitsubishi Heavy Industries Ltd. - Business segments
- Exhibits99: Mitsubishi Heavy Industries Ltd. - Key news
- Exhibits100: Mitsubishi Heavy Industries Ltd. - Key offerings
- Exhibits101: Mitsubishi Heavy Industries Ltd. - Segment focus
- Exhibits102: SWOT
- Exhibits103: Mitsui and Co. Ltd. - Overview
- Exhibits104: Mitsui and Co. Ltd. - Business segments
- Exhibits105: Mitsui and Co. Ltd. - Key news
- Exhibits106: Mitsui and Co. Ltd. - Key offerings
- Exhibits107: Mitsui and Co. Ltd. - Segment focus
- Exhibits108: SWOT
- Exhibits109: QCoal Pty Ltd. - Overview
- Exhibits110: QCoal Pty Ltd. - Product / Service
- Exhibits111: QCoal Pty Ltd. - Key offerings
- Exhibits112: SWOT
- Exhibits113: Shandong Energy Group Co. Ltd. - Overview
- Exhibits114: Shandong Energy Group Co. Ltd. - Product / Service
- Exhibits115: Shandong Energy Group Co. Ltd. - Key offerings
- Exhibits116: SWOT
- Exhibits117: Inclusions checklist
- Exhibits118: Exclusions checklist
- Exhibits119: Currency conversion rates for US$
- Exhibits120: Research methodology
- Exhibits121: Information sources
- Exhibits122: Data validation
- Exhibits123: Validation techniques employed for market sizing
- Exhibits124: Data synthesis
- Exhibits125: 360 degree market analysis
- Exhibits126: List of abbreviations
The coal market in japan is forecasted to grow by USD 4.5 bn during 2023-2028, accelerating at a CAGR of 2% during the forecast period. The report on the coal market in japan provides a holistic analysis, market size and forecast, trends, growth drivers, and challenges, as well as vendor analysis covering around 25 vendors.
The report offers an up-to-date analysis regarding the current market scenario, the latest trends and drivers, and the overall market environment. The market is driven by better electricity generation technology, rising industrial and infrastructural development activities, and robotics and driverless technology in coal mining.
Technavio's coal market in japan is segmented as below:
| Market Scope | |
|---|---|
| Base Year | 2024 |
| End Year | 2028 |
| Series Year | 2024-2028 |
| Growth Momentum | Accelerate |
| YOY 2024 | 2.1% |
| CAGR | 2% |
| Incremental Value | $4.5 bn |
By Type
- Thermal coal
- Metallurgical coal
By Source
- Import
- Domestic
By Geographical Landscape
- APAC
This study identifies the usage of liquid form of coal as fuel and electricity as one of the prime reasons driving the coal market in japan growth during the next few years. Also, advantages of using coal combustion products (CCPs) and using data-driven insights to achieve operational excellence will lead to sizable demand in the market.
The report on the coal market in japan covers the following areas:
- Coal Market in Japan sizing
- Coal Market in Japan forecast
- Coal Market in Japan industry analysis
The robust vendor analysis is designed to help clients improve their market position, and in line with this, this report provides a detailed analysis of several leading coal market in japan vendors that include Banpu Public Co. Ltd., BHP Group Ltd., Bloomfield Group, Chiyoda Corp., ITOCHU Corp., Jellinbah Group Pty Ltd., J-POWER Electric Power Development Co. Ltd., L3Harris Technologies Inc., Mitsubishi Heavy Industries Ltd., Mitsui and Co. Ltd., QCoal Pty Ltd., and Shandong Energy Group Co. Ltd.. Also, the coal market in japan analysis report includes information on upcoming trends and challenges that will influence market growth. This is to help companies strategize and leverage all forthcoming growth opportunities.
The study was conducted using an objective combination of primary and secondary information including inputs from key participants in the industry. The report contains a comprehensive market and vendor landscape in addition to an analysis of the key vendors.
The publisher presents a detailed picture of the market by the way of study, synthesis, and summation of data from multiple sources by an analysis of key parameters such as profit, pricing, competition, and promotions. It presents various market facets by identifying the key industry influencers. The data presented is comprehensive, reliable, and a result of extensive primary and secondary research. The market research reports provide a complete competitive landscape and an in-depth vendor selection methodology and analysis using qualitative and quantitative research to forecast accurate market growth.
Table of Contents
1 Executive Summary
- 1.1 Market overview
- Executive Summary - Chart on Market Overview
- Executive Summary - Data Table on Market Overview
- Executive Summary - Chart on Country Market Characteristics
- Executive Summary - Chart on Market Segmentation by Type
- Executive Summary - Chart on Market Segmentation by Source
- Executive Summary - Chart on Company Market Positioning
2 Technavio Analysis
- 2.1 Analysis of price sensitivity, lifecycle, customer purchase basket, adoption rates, and purchase criteria
- Analysis of price sensitivity, lifecycle, customer purchase basket, adoption rates, and purchase criteria
- 2.2 Criticality of inputs and Factors of differentiation
- Overview on criticality of inputs and factors of differentiation
- 2.3 Factors of disruption
- Overview on factors of disruption
- 2.4 Impact of drivers and challenges
- Impact of drivers and challenges in 2023 and 2028
3 Market Landscape
- 3.1 Market ecosystem
- Parent Market
- Data Table on - Parent Market
- 3.2 Market characteristics
- Market characteristics analysis
- 3.3 Value chain analysis
- Value chain analysis
4 Market Sizing
- 4.1 Market definition
- Offerings of companies included in the market definition
- 4.2 Market segment analysis
- Market segments
- 4.3 Market size 2023
- 4.4 Market outlook: Forecast for 2023-2028
- Chart on Japan - Market size and forecast 2023-2028 ($ billion)
- Data Table on Japan - Market size and forecast 2023-2028 ($ billion)
- Chart on Japan: Year-over-year growth 2023-2028 (%)
- Data Table on Japan: Year-over-year growth 2023-2028 (%)
5 Historic Market Size
- 5.1 Coal Market in Japan 2018 - 2022
- Historic Market Size - Data Table on Coal Market in Japan 2018 - 2022 ($ billion)
- 5.2 Type segment analysis 2018 - 2022
- Historic Market Size - Type Segment 2018 - 2022 ($ billion)
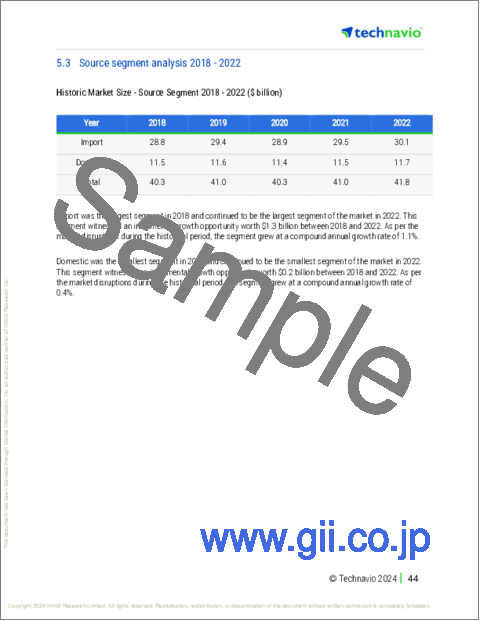
- 5.3 Source segment analysis 2018 - 2022
- Historic Market Size - Source Segment 2018 - 2022 ($ billion)
6 Qualitative Analysis
- 6.1 The AI impact on Coal Market in Japan
7 Five Forces Analysis
- 7.1 Five forces summary
- Five forces analysis - Comparison between 2023 and 2028
- 7.2 Bargaining power of buyers
- Bargaining power of buyers - Impact of key factors 2023 and 2028
- 7.3 Bargaining power of suppliers
- Bargaining power of suppliers - Impact of key factors in 2023 and 2028
- 7.4 Threat of new entrants
- Threat of new entrants - Impact of key factors in 2023 and 2028
- 7.5 Threat of substitutes
- Threat of substitutes - Impact of key factors in 2023 and 2028
- 7.6 Threat of rivalry
- Threat of rivalry - Impact of key factors in 2023 and 2028
- 7.7 Market condition
- Chart on Market condition - Five forces 2023 and 2028
8 Market Segmentation by Type
- 8.1 Market segments
- Chart on Type - Market share 2023-2028 (%)
- Data Table on Type - Market share 2023-2028 (%)
- 8.2 Comparison by Type
- Chart on Comparison by Type
- Data Table on Comparison by Type
- 8.3 Thermal coal - Market size and forecast 2023-2028
- Chart on Thermal coal - Market size and forecast 2023-2028 ($ billion)
- Data Table on Thermal coal - Market size and forecast 2023-2028 ($ billion)
- Chart on Thermal coal - Year-over-year growth 2023-2028 (%)
- Data Table on Thermal coal - Year-over-year growth 2023-2028 (%)
- 8.4 Metallurgical coal - Market size and forecast 2023-2028
- Chart on Metallurgical coal - Market size and forecast 2023-2028 ($ billion)
- Data Table on Metallurgical coal - Market size and forecast 2023-2028 ($ billion)
- Chart on Metallurgical coal - Year-over-year growth 2023-2028 (%)
- Data Table on Metallurgical coal - Year-over-year growth 2023-2028 (%)
- 8.5 Market opportunity by Type
- Market opportunity by Type ($ billion)
- Data Table on Market opportunity by Type ($ billion)
9 Market Segmentation by Source
- 9.1 Market segments
- Chart on Source - Market share 2023-2028 (%)
- Data Table on Source - Market share 2023-2028 (%)
- 9.2 Comparison by Source
- Chart on Comparison by Source
- Data Table on Comparison by Source
- 9.3 Import - Market size and forecast 2023-2028
- Chart on Import - Market size and forecast 2023-2028 ($ billion)
- Data Table on Import - Market size and forecast 2023-2028 ($ billion)
- Chart on Import - Year-over-year growth 2023-2028 (%)
- Data Table on Import - Year-over-year growth 2023-2028 (%)
- 9.4 Domestic - Market size and forecast 2023-2028
- Chart on Domestic - Market size and forecast 2023-2028 ($ billion)
- Data Table on Domestic - Market size and forecast 2023-2028 ($ billion)
- Chart on Domestic - Year-over-year growth 2023-2028 (%)
- Data Table on Domestic - Year-over-year growth 2023-2028 (%)
- 9.5 Market opportunity by Source
- Market opportunity by Source ($ billion)
- Data Table on Market opportunity by Source ($ billion)
10 Customer Landscape
- 10.1 Customer landscape overview
- Analysis of price sensitivity, lifecycle, customer purchase basket, adoption rates, and purchase criteria
11 Drivers, Challenges, and Opportunity/Restraints
- 11.1 Market drivers
- 11.2 Market challenges
- 11.3 Impact of drivers and challenges
- Impact of drivers and challenges in 2023 and 2028
- 11.4 Market opportunities/restraints
12 Competitive Landscape
- 12.1 Overview
- 12.2 Competitive Landscape
- Overview on criticality of inputs and factors of differentiation
- 12.3 Landscape disruption
- Overview on factors of disruption
- 12.4 Industry risks
- Impact of key risks on business
13 Competitive Analysis
- 13.1 Companies profiled
- Companies covered
- 13.2 Company ranking index
- Company ranking index
- 13.3 Market positioning of companies
- Matrix on companies position and classification
- 13.4 Banpu Public Co. Ltd.
- Banpu Public Co. Ltd. - Overview
- Banpu Public Co. Ltd. - Product / Service
- Banpu Public Co. Ltd. - Key offerings
- SWOT
- 13.5 BHP Group Ltd.
- BHP Group Ltd. - Overview
- BHP Group Ltd. - Business segments
- BHP Group Ltd. - Key offerings
- BHP Group Ltd. - Segment focus
- SWOT
- 13.6 Chiyoda Corp.
- Chiyoda Corp. - Overview
- Chiyoda Corp. - Business segments
- Chiyoda Corp. - Key news
- Chiyoda Corp. - Key offerings
- Chiyoda Corp. - Segment focus
- SWOT
- 13.7 ITOCHU Corp.
- ITOCHU Corp. - Overview
- ITOCHU Corp. - Business segments
- ITOCHU Corp. - Key offerings
- ITOCHU Corp. - Segment focus
- SWOT
- 13.8 J-POWER Electric Power Development Co. Ltd.
- J-POWER Electric Power Development Co. Ltd. - Overview
- J-POWER Electric Power Development Co. Ltd. - Product / Service
- J-POWER Electric Power Development Co. Ltd. - Key offerings
- SWOT
- 13.9 L3Harris Technologies Inc.
- L3Harris Technologies Inc. - Overview
- L3Harris Technologies Inc. - Business segments
- L3Harris Technologies Inc. - Key news
- L3Harris Technologies Inc. - Key offerings
- L3Harris Technologies Inc. - Segment focus
- SWOT
- 13.10 Mitsubishi Heavy Industries Ltd.
- Mitsubishi Heavy Industries Ltd. - Overview
- Mitsubishi Heavy Industries Ltd. - Business segments
- Mitsubishi Heavy Industries Ltd. - Key news
- Mitsubishi Heavy Industries Ltd. - Key offerings
- Mitsubishi Heavy Industries Ltd. - Segment focus
- SWOT
- 13.11 Mitsui and Co. Ltd.
- Mitsui and Co. Ltd. - Overview
- Mitsui and Co. Ltd. - Business segments
- Mitsui and Co. Ltd. - Key news
- Mitsui and Co. Ltd. - Key offerings
- Mitsui and Co. Ltd. - Segment focus
- SWOT
- 13.12 QCoal Pty Ltd.
- QCoal Pty Ltd. - Overview
- QCoal Pty Ltd. - Product / Service
- QCoal Pty Ltd. - Key offerings
- SWOT
- 13.13 Shandong Energy Group Co. Ltd.
- Shandong Energy Group Co. Ltd. - Overview
- Shandong Energy Group Co. Ltd. - Product / Service
- Shandong Energy Group Co. Ltd. - Key offerings
- SWOT
14 Appendix
- 14.1 Scope of the report
- 14.2 Inclusions and exclusions checklist
- Inclusions checklist
- Exclusions checklist
- 14.3 Currency conversion rates for US$
- Currency conversion rates for US$
- 14.4 Research methodology
- Research methodology
- 14.5 Data procurement
- Information sources
- 14.6 Data validation
- Data validation
- 14.7 Validation techniques employed for market sizing
- Validation techniques employed for market sizing
- 14.8 Data synthesis
- Data synthesis
- 14.9 360 degree market analysis
- 360 degree market analysis
- 14.10 List of abbreviations
- List of abbreviations
