|
|
市場調査レポート
商品コード
1626176
ケイ酸ナトリウムの世界市場 (2025~2029年)Global Sodium Silicate Market 2025-2029 |
||||||
|
|||||||
カスタマイズ可能
|
|||||||

| ケイ酸ナトリウムの世界市場 (2025~2029年) |
|
出版日: 2024年12月17日
発行: TechNavio
ページ情報: 英文 210 Pages
納期: 即納可能
|

全表示
- 概要
- 図表
- 目次
ケイ酸ナトリウム市場 (2025~2029年)
ケイ酸ナトリウム市場は2024年から2029年に14億3,850万米ドル分拡大し、予測期間中に4.1%のCAGRで成長すると予測されます。当レポートでは、ケイ酸ナトリウム市場の全体的な分析、市場規模・予測、動向、成長促進要因、課題、約25社のベンダーを網羅したベンダー分析などを掲載しています。
当レポートでは、現在の市場シナリオ、最新動向と促進要因、市場環境全体に関する最新分析を提供しています。当市場は、ケイ酸ナトリウム生産施設の拡大、水処理への取り組み、建設分野への投資の増加によって牽引されています。
| 市場範囲 | |
|---|---|
| 基準年 | 2025年 |
| 終了年 | 2029年 |
| 予測期間 | 2025~2029年 |
| 成長モメンタム | 加速 |
| 前年比 (2025年) | 3.9% |
| CAGR | 4.1% |
| 増分額 | 14億3,850万米ドル |
当レポートでは、今後数年間のケイ酸ナトリウム市場の成長を促進する主要因の1つとして、戦略的パートナーシップを挙げています。また、持続可能性と製品イノベーションへの注力も、同市場の大きな需要につながると思われます。
目次
第1章 エグゼクティブサマリー
- 市場概要
第2章 Technavioによる分析
- 価格感応度・ライフサイクル・顧客購入バスケット・採用率・購入基準の分析
- インプットの重要性と差別化の要因
- 混乱の要因
- 促進要因と課題の影響
第3章 市場情勢
- 市場エコシステム
- 市場の特徴
- バリューチェーン分析
第4章 市場規模の評価
- 市場の定義
- 市場セグメント分析
- 市場規模 (2024年)
- 市場の見通し (2024~2029年)
第5章 市場規模実績
- 世界のケイ酸ナトリウム市場 (2019~2023年)
- 用途別分析 (2019~2023年)
- フォームファクタ別分析 (2019~2023年)
- 地域別分析 (2019~2023年)
- 国別分析 (2019~2023年)
第6章 定性分析
- AIの影響:世界のケイ酸ナトリウム市場
第7章 ファイブフォース分析
- ファイブフォースの要約
- 買い手の交渉力
- 供給企業の交渉力
- 新規参入業者の脅威
- 代替品の脅威
- 競争の脅威
- 市況
第8章 市場区分:用途別
- 市場区分
- 比較:用途別
- 洗剤:市場規模と予測 (2024~2029年)
- パルプ・製紙:市場規模と予測 (2024~2029年)
- ケイ酸誘導体:市場規模と予測 (2024~2029年)
- 建設:市場規模と予測 (2024~2029年)
- その他:市場規模と予測 (2024~2029年)
- 市場機会:用途別
第9章 市場区分:フォームファクタ別
- 市場区分
- 比較:フォームファクタ別
- 液体:市場規模と予測 (2024~2029年)
- 固体:市場規模と予測 (2024~2029年)
- 市場機会:フォームファクタ別
第10章 顧客情勢
- 顧客情勢の概要
第11章 地域別情勢
- 地域別区分
- 地域別比較
- アジア太平洋:市場規模と予測 (2024~2029年)
- 北米:市場規模と予測 (2024~2029年)
- 欧州:市場規模と予測 (2024~2029年)
- 中東・アフリカ:市場規模と予測 (2024~2029年)
- 南米:市場規模と予測 (2024~2029年)
- 米国:市場規模と予測 (2024~2029年)
- 中国:市場規模と予測 (2024~2029年)
- インド:市場規模と予測 (2024~2029年)
- ドイツ:市場規模と予測 (2024~2029年)
- 日本:市場規模と予測 (2024~2029年)
- カナダ:市場規模と予測 (2024~2029年)
- ブラジル:市場規模と予測 (2024~2029年)
- 英国:市場規模と予測 (2024~2029年)
- 韓国:市場規模と予測 (2024~2029年)
- オーストラリア:市場規模と予測 (2024~2029年)
- 市場機会:地域別
第12章 促進要因・課題・機会・抑制要因
- 市場促進要因
- 市場の課題
- 促進要因と課題の影響
- 市場の機会・抑制要因
第13章 競合情勢
- 概要
- 競合情勢
- 混乱の状況
- 業界のリスク
第14章 競合分析
- 企業プロファイル
- 企業ランキング指数
- 企業の市場ポジショニング
- Ankit Silicate
- Antika Officina Botanika
- BASF SE
- Evonik Industries AG
- Fuji Silysia Chemical Ltd.
- Hindcon Chemicals Ltd.
- Hi-Tech Minerals and Chemicals
- Occidental Petroleum Corp.
- Possehl Erzkontor GmbH Co. KG
- PQ Group Holdings Inc.
- Qemetica
- Silmaco NV
- W. R. Grace and Co.
- Welcome Chemicals
- Z. Ch. Rudniki SA
第15章 付録
Exhibits:
- Exhibits1: Executive Summary - Chart on Market Overview
- Exhibits2: Executive Summary - Data Table on Market Overview
- Exhibits3: Executive Summary - Chart on Global Market Characteristics
- Exhibits4: Executive Summary - Chart on Market By Geographical Landscape
- Exhibits5: Executive Summary - Chart on Market Segmentation by Application
- Exhibits6: Executive Summary - Chart on Market Segmentation by Form Factor
- Exhibits7: Executive Summary - Chart on Incremental Growth
- Exhibits8: Executive Summary - Data Table on Incremental Growth
- Exhibits9: Executive Summary - Chart on Company Market Positioning
- Exhibits10: Analysis of price sensitivity, lifecycle, customer purchase basket, adoption rates, and purchase criteria
- Exhibits11: Overview on criticality of inputs and factors of differentiation
- Exhibits12: Overview on factors of disruption
- Exhibits13: Impact of drivers and challenges in 2024 and 2029
- Exhibits14: Parent Market
- Exhibits15: Data Table on - Parent Market
- Exhibits16: Market characteristics analysis
- Exhibits17: Value chain analysis
- Exhibits18: Offerings of companies included in the market definition
- Exhibits19: Market segments
- Exhibits20: Chart on Global - Market size and forecast 2024-2029 ($ million)
- Exhibits21: Data Table on Global - Market size and forecast 2024-2029 ($ million)
- Exhibits22: Chart on Global Market: Year-over-year growth 2024-2029 (%)
- Exhibits23: Data Table on Global Market: Year-over-year growth 2024-2029 (%)
- Exhibits24: Historic Market Size - Data Table on Global Sodium Silicate Market 2019 - 2023 ($ million)
- Exhibits25: Historic Market Size - Application Segment 2019 - 2023 ($ million)
- Exhibits26: Historic Market Size - Form Factor Segment 2019 - 2023 ($ million)
- Exhibits27: Historic Market Size - Geography Segment 2019 - 2023 ($ million)
- Exhibits28: Historic Market Size - Country Segment 2019 - 2023 ($ million)
- Exhibits29: Five forces analysis - Comparison between 2024 and 2029
- Exhibits30: Bargaining power of buyers - Impact of key factors 2024 and 2029
- Exhibits31: Bargaining power of suppliers - Impact of key factors in 2024 and 2029
- Exhibits32: Threat of new entrants - Impact of key factors in 2024 and 2029
- Exhibits33: Threat of substitutes - Impact of key factors in 2024 and 2029
- Exhibits34: Threat of rivalry - Impact of key factors in 2024 and 2029
- Exhibits35: Chart on Market condition - Five forces 2024 and 2029
- Exhibits36: Chart on Application - Market share 2024-2029 (%)
- Exhibits37: Data Table on Application - Market share 2024-2029 (%)
- Exhibits38: Chart on Comparison by Application
- Exhibits39: Data Table on Comparison by Application
- Exhibits40: Chart on Detergent - Market size and forecast 2024-2029 ($ million)
- Exhibits41: Data Table on Detergent - Market size and forecast 2024-2029 ($ million)
- Exhibits42: Chart on Detergent - Year-over-year growth 2024-2029 (%)
- Exhibits43: Data Table on Detergent - Year-over-year growth 2024-2029 (%)
- Exhibits44: Chart on Pulp and paper - Market size and forecast 2024-2029 ($ million)
- Exhibits45: Data Table on Pulp and paper - Market size and forecast 2024-2029 ($ million)
- Exhibits46: Chart on Pulp and paper - Year-over-year growth 2024-2029 (%)
- Exhibits47: Data Table on Pulp and paper - Year-over-year growth 2024-2029 (%)
- Exhibits48: Chart on Derivative silicates - Market size and forecast 2024-2029 ($ million)
- Exhibits49: Data Table on Derivative silicates - Market size and forecast 2024-2029 ($ million)
- Exhibits50: Chart on Derivative silicates - Year-over-year growth 2024-2029 (%)
- Exhibits51: Data Table on Derivative silicates - Year-over-year growth 2024-2029 (%)
- Exhibits52: Chart on Construction - Market size and forecast 2024-2029 ($ million)
- Exhibits53: Data Table on Construction - Market size and forecast 2024-2029 ($ million)
- Exhibits54: Chart on Construction - Year-over-year growth 2024-2029 (%)
- Exhibits55: Data Table on Construction - Year-over-year growth 2024-2029 (%)
- Exhibits56: Chart on Others - Market size and forecast 2024-2029 ($ million)
- Exhibits57: Data Table on Others - Market size and forecast 2024-2029 ($ million)
- Exhibits58: Chart on Others - Year-over-year growth 2024-2029 (%)
- Exhibits59: Data Table on Others - Year-over-year growth 2024-2029 (%)
- Exhibits60: Market opportunity by Application ($ million)
- Exhibits61: Data Table on Market opportunity by Application ($ million)
- Exhibits62: Chart on Form Factor - Market share 2024-2029 (%)
- Exhibits63: Data Table on Form Factor - Market share 2024-2029 (%)
- Exhibits64: Chart on Comparison by Form Factor
- Exhibits65: Data Table on Comparison by Form Factor
- Exhibits66: Chart on Liquid - Market size and forecast 2024-2029 ($ million)
- Exhibits67: Data Table on Liquid - Market size and forecast 2024-2029 ($ million)
- Exhibits68: Chart on Liquid - Year-over-year growth 2024-2029 (%)
- Exhibits69: Data Table on Liquid - Year-over-year growth 2024-2029 (%)
- Exhibits70: Chart on Solid - Market size and forecast 2024-2029 ($ million)
- Exhibits71: Data Table on Solid - Market size and forecast 2024-2029 ($ million)
- Exhibits72: Chart on Solid - Year-over-year growth 2024-2029 (%)
- Exhibits73: Data Table on Solid - Year-over-year growth 2024-2029 (%)
- Exhibits74: Market opportunity by Form Factor ($ million)
- Exhibits75: Data Table on Market opportunity by Form Factor ($ million)
- Exhibits76: Analysis of price sensitivity, lifecycle, customer purchase basket, adoption rates, and purchase criteria
- Exhibits77: Chart on Market share By Geographical Landscape 2024-2029 (%)
- Exhibits78: Data Table on Market share By Geographical Landscape 2024-2029 (%)
- Exhibits79: Chart on Geographic comparison
- Exhibits80: Data Table on Geographic comparison
- Exhibits81: Chart on APAC - Market size and forecast 2024-2029 ($ million)
- Exhibits82: Data Table on APAC - Market size and forecast 2024-2029 ($ million)
- Exhibits83: Chart on APAC - Year-over-year growth 2024-2029 (%)
- Exhibits84: Data Table on APAC - Year-over-year growth 2024-2029 (%)
- Exhibits85: Chart on North America - Market size and forecast 2024-2029 ($ million)
- Exhibits86: Data Table on North America - Market size and forecast 2024-2029 ($ million)
- Exhibits87: Chart on North America - Year-over-year growth 2024-2029 (%)
- Exhibits88: Data Table on North America - Year-over-year growth 2024-2029 (%)
- Exhibits89: Chart on Europe - Market size and forecast 2024-2029 ($ million)
- Exhibits90: Data Table on Europe - Market size and forecast 2024-2029 ($ million)
- Exhibits91: Chart on Europe - Year-over-year growth 2024-2029 (%)
- Exhibits92: Data Table on Europe - Year-over-year growth 2024-2029 (%)
- Exhibits93: Chart on Middle East and Africa - Market size and forecast 2024-2029 ($ million)
- Exhibits94: Data Table on Middle East and Africa - Market size and forecast 2024-2029 ($ million)
- Exhibits95: Chart on Middle East and Africa - Year-over-year growth 2024-2029 (%)
- Exhibits96: Data Table on Middle East and Africa - Year-over-year growth 2024-2029 (%)
- Exhibits97: Chart on South America - Market size and forecast 2024-2029 ($ million)
- Exhibits98: Data Table on South America - Market size and forecast 2024-2029 ($ million)
- Exhibits99: Chart on South America - Year-over-year growth 2024-2029 (%)
- Exhibits100: Data Table on South America - Year-over-year growth 2024-2029 (%)
- Exhibits101: Chart on US - Market size and forecast 2024-2029 ($ million)
- Exhibits102: Data Table on US - Market size and forecast 2024-2029 ($ million)
- Exhibits103: Chart on US - Year-over-year growth 2024-2029 (%)
- Exhibits104: Data Table on US - Year-over-year growth 2024-2029 (%)
- Exhibits105: Chart on China - Market size and forecast 2024-2029 ($ million)
- Exhibits106: Data Table on China - Market size and forecast 2024-2029 ($ million)
- Exhibits107: Chart on China - Year-over-year growth 2024-2029 (%)
- Exhibits108: Data Table on China - Year-over-year growth 2024-2029 (%)
- Exhibits109: Chart on India - Market size and forecast 2024-2029 ($ million)
- Exhibits110: Data Table on India - Market size and forecast 2024-2029 ($ million)
- Exhibits111: Chart on India - Year-over-year growth 2024-2029 (%)
- Exhibits112: Data Table on India - Year-over-year growth 2024-2029 (%)
- Exhibits113: Chart on Germany - Market size and forecast 2024-2029 ($ million)
- Exhibits114: Data Table on Germany - Market size and forecast 2024-2029 ($ million)
- Exhibits115: Chart on Germany - Year-over-year growth 2024-2029 (%)
- Exhibits116: Data Table on Germany - Year-over-year growth 2024-2029 (%)
- Exhibits117: Chart on Japan - Market size and forecast 2024-2029 ($ million)
- Exhibits118: Data Table on Japan - Market size and forecast 2024-2029 ($ million)
- Exhibits119: Chart on Japan - Year-over-year growth 2024-2029 (%)
- Exhibits120: Data Table on Japan - Year-over-year growth 2024-2029 (%)
- Exhibits121: Chart on Canada - Market size and forecast 2024-2029 ($ million)
- Exhibits122: Data Table on Canada - Market size and forecast 2024-2029 ($ million)
- Exhibits123: Chart on Canada - Year-over-year growth 2024-2029 (%)
- Exhibits124: Data Table on Canada - Year-over-year growth 2024-2029 (%)
- Exhibits125: Chart on Brazil - Market size and forecast 2024-2029 ($ million)
- Exhibits126: Data Table on Brazil - Market size and forecast 2024-2029 ($ million)
- Exhibits127: Chart on Brazil - Year-over-year growth 2024-2029 (%)
- Exhibits128: Data Table on Brazil - Year-over-year growth 2024-2029 (%)
- Exhibits129: Chart on UK - Market size and forecast 2024-2029 ($ million)
- Exhibits130: Data Table on UK - Market size and forecast 2024-2029 ($ million)
- Exhibits131: Chart on UK - Year-over-year growth 2024-2029 (%)
- Exhibits132: Data Table on UK - Year-over-year growth 2024-2029 (%)
- Exhibits133: Chart on South Korea - Market size and forecast 2024-2029 ($ million)
- Exhibits134: Data Table on South Korea - Market size and forecast 2024-2029 ($ million)
- Exhibits135: Chart on South Korea - Year-over-year growth 2024-2029 (%)
- Exhibits136: Data Table on South Korea - Year-over-year growth 2024-2029 (%)
- Exhibits137: Chart on Australia - Market size and forecast 2024-2029 ($ million)
- Exhibits138: Data Table on Australia - Market size and forecast 2024-2029 ($ million)
- Exhibits139: Chart on Australia - Year-over-year growth 2024-2029 (%)
- Exhibits140: Data Table on Australia - Year-over-year growth 2024-2029 (%)
- Exhibits141: Market opportunity By Geographical Landscape ($ million)
- Exhibits142: Data Tables on Market opportunity By Geographical Landscape ($ million)
- Exhibits143: Impact of drivers and challenges in 2024 and 2029
- Exhibits144: Overview on criticality of inputs and factors of differentiation
- Exhibits145: Overview on factors of disruption
- Exhibits146: Impact of key risks on business
- Exhibits147: Companies covered
- Exhibits148: Company ranking index
- Exhibits149: Matrix on companies position and classification
- Exhibits150: Ankit Silicate - Overview
- Exhibits151: Ankit Silicate - Product / Service
- Exhibits152: Ankit Silicate - Key offerings
- Exhibits153: SWOT
- Exhibits154: Antika Officina Botanika - Overview
- Exhibits155: Antika Officina Botanika - Product / Service
- Exhibits156: Antika Officina Botanika - Key offerings
- Exhibits157: SWOT
- Exhibits158: BASF SE - Overview
- Exhibits159: BASF SE - Business segments
- Exhibits160: BASF SE - Key news
- Exhibits161: BASF SE - Key offerings
- Exhibits162: BASF SE - Segment focus
- Exhibits163: SWOT
- Exhibits164: Evonik Industries AG - Overview
- Exhibits165: Evonik Industries AG - Business segments
- Exhibits166: Evonik Industries AG - Key news
- Exhibits167: Evonik Industries AG - Key offerings
- Exhibits168: Evonik Industries AG - Segment focus
- Exhibits169: SWOT
- Exhibits170: Fuji Silysia Chemical Ltd. - Overview
- Exhibits171: Fuji Silysia Chemical Ltd. - Product / Service
- Exhibits172: Fuji Silysia Chemical Ltd. - Key offerings
- Exhibits173: SWOT
- Exhibits174: Hindcon Chemicals Ltd. - Overview
- Exhibits175: Hindcon Chemicals Ltd. - Product / Service
- Exhibits176: Hindcon Chemicals Ltd. - Key offerings
- Exhibits177: SWOT
- Exhibits178: Hi-Tech Minerals and Chemicals - Overview
- Exhibits179: Hi-Tech Minerals and Chemicals - Product / Service
- Exhibits180: Hi-Tech Minerals and Chemicals - Key offerings
- Exhibits181: SWOT
- Exhibits182: Occidental Petroleum Corp. - Overview
- Exhibits183: Occidental Petroleum Corp. - Business segments
- Exhibits184: Occidental Petroleum Corp. - Key news
- Exhibits185: Occidental Petroleum Corp. - Key offerings
- Exhibits186: Occidental Petroleum Corp. - Segment focus
- Exhibits187: SWOT
- Exhibits188: Possehl Erzkontor GmbH & Co. KG - Overview
- Exhibits189: Possehl Erzkontor GmbH & Co. KG - Product / Service
- Exhibits190: Possehl Erzkontor GmbH & Co. KG - Key offerings
- Exhibits191: SWOT
- Exhibits192: PQ Group Holdings Inc. - Overview
- Exhibits193: PQ Group Holdings Inc. - Product / Service
- Exhibits194: PQ Group Holdings Inc. - Key news
- Exhibits195: PQ Group Holdings Inc. - Key offerings
- Exhibits196: SWOT
- Exhibits197: Qemetica - Overview
- Exhibits198: Qemetica - Product / Service
- Exhibits199: Qemetica - Key offerings
- Exhibits200: SWOT
- Exhibits201: Silmaco NV - Overview
- Exhibits202: Silmaco NV - Product / Service
- Exhibits203: Silmaco NV - Key offerings
- Exhibits204: SWOT
- Exhibits205: W. R. Grace and Co. - Overview
- Exhibits206: W. R. Grace and Co. - Product / Service
- Exhibits207: W. R. Grace and Co. - Key offerings
- Exhibits208: SWOT
- Exhibits209: Welcome Chemicals - Overview
- Exhibits210: Welcome Chemicals - Product / Service
- Exhibits211: Welcome Chemicals - Key offerings
- Exhibits212: SWOT
- Exhibits213: Z. Ch. Rudniki SA - Overview
- Exhibits214: Z. Ch. Rudniki SA - Product / Service
- Exhibits215: Z. Ch. Rudniki SA - Key offerings
- Exhibits216: SWOT
- Exhibits217: Inclusions checklist
- Exhibits218: Exclusions checklist
- Exhibits219: Currency conversion rates for US$
- Exhibits220: Research methodology
- Exhibits221: Information sources
- Exhibits222: Data validation
- Exhibits223: Validation techniques employed for market sizing
- Exhibits224: Data synthesis
- Exhibits225: 360 degree market analysis
- Exhibits226: List of abbreviations
Sodium Silicate Market 2025-2029
The sodium silicate market is forecasted to grow by USD 1438.5 mn during 2024-2029, accelerating at a CAGR of 4.1% during the forecast period. The report on the sodium silicate market provides a holistic analysis, market size and forecast, trends, growth drivers, and challenges, as well as vendor analysis covering around 25 vendors.
The report offers an up-to-date analysis regarding the current market scenario, the latest trends and drivers, and the overall market environment. The market is driven by expansion of sodium silicate production facilities, water treatment initiatives, and increasing investments in construction sector.
| Market Scope | |
|---|---|
| Base Year | 2025 |
| End Year | 2029 |
| Series Year | 2025-2029 |
| Growth Momentum | Accelerate |
| YOY 2025 | 3.9% |
| CAGR | 4.1% |
| Incremental Value | $1438.5 mn |
Technavio's sodium silicate market is segmented as below:
By Application
- Detergent
- Pulp and paper
- Derivative silicates
- Construction
- Others
By Form Factor
- Liquid
- Solid
By Geographical Landscape
- APAC
- North America
- Europe
- Middle East and Africa
- South America
This study identifies the strategic partnerships as one of the prime reasons driving the sodium silicate market growth during the next few years. Also, focus on sustainability and product innovations will lead to sizable demand in the market.
The report on the sodium silicate market covers the following areas:
- Sodium Silicate Market sizing
- Sodium Silicate Market forecast
- Sodium Silicate Market industry analysis
The robust vendor analysis is designed to help clients improve their market position, and in line with this, this report provides a detailed analysis of several leading sodium silicate market vendors that include Ankit Silicate, Antika Officina Botanika, BASF SE, Evonik Industries AG, Fuji Silysia Chemical Ltd., Hindcon Chemicals Ltd., Hi-Tech Minerals and Chemicals, Marsina Engineering S R L, NM Enterprises, Noble Alchem Pvt Ltd., Occidental Petroleum Corp., Possehl Erzkontor GmbH & Co. KG, PQ Group Holdings Inc., Qemetica, Silmaco NV, W. R. Grace and Co., Welcome Chemicals, and Z. Ch. Rudniki SA. Also, the sodium silicate market analysis report includes information on upcoming trends and challenges that will influence market growth. This is to help companies strategize and leverage all forthcoming growth opportunities.
The study was conducted using an objective combination of primary and secondary information including inputs from key participants in the industry. The report contains a comprehensive market and vendor landscape in addition to an analysis of the key vendors.
The publisher presents a detailed picture of the market by the way of study, synthesis, and summation of data from multiple sources by an analysis of key parameters such as profit, pricing, competition, and promotions. It presents various market facets by identifying the key industry influencers. The data presented is comprehensive, reliable, and a result of extensive primary and secondary research. The market research reports provide a complete competitive landscape and an in-depth vendor selection methodology and analysis using qualitative and quantitative research to forecast accurate market growth.
Table of Contents
1 Executive Summary
- 1.1 Market overview
- Executive Summary - Chart on Market Overview
- Executive Summary - Data Table on Market Overview
- Executive Summary - Chart on Global Market Characteristics
- Executive Summary - Chart on Market By Geographical Landscape
- Executive Summary - Chart on Market Segmentation by Application
- Executive Summary - Chart on Market Segmentation by Form Factor
- Executive Summary - Chart on Incremental Growth
- Executive Summary - Data Table on Incremental Growth
- Executive Summary - Chart on Company Market Positioning
2 Technavio Analysis
- 2.1 Analysis of price sensitivity, lifecycle, customer purchase basket, adoption rates, and purchase criteria
- Analysis of price sensitivity, lifecycle, customer purchase basket, adoption rates, and purchase criteria
- 2.2 Criticality of inputs and Factors of differentiation
- Overview on criticality of inputs and factors of differentiation
- 2.3 Factors of disruption
- Overview on factors of disruption
- 2.4 Impact of drivers and challenges
- Impact of drivers and challenges in 2024 and 2029
3 Market Landscape
- 3.1 Market ecosystem
- Parent Market
- Data Table on - Parent Market
- 3.2 Market characteristics
- Market characteristics analysis
- 3.3 Value chain analysis
- Value chain analysis
4 Market Sizing
- 4.1 Market definition
- Offerings of companies included in the market definition
- 4.2 Market segment analysis
- Market segments
- 4.3 Market size 2024
- 4.4 Market outlook: Forecast for 2024-2029
- Chart on Global - Market size and forecast 2024-2029 ($ million)
- Data Table on Global - Market size and forecast 2024-2029 ($ million)
- Chart on Global Market: Year-over-year growth 2024-2029 (%)
- Data Table on Global Market: Year-over-year growth 2024-2029 (%)
5 Historic Market Size
- 5.1 Global Sodium Silicate Market 2019 - 2023
- Historic Market Size - Data Table on Global Sodium Silicate Market 2019 - 2023 ($ million)
- 5.2 Application segment analysis 2019 - 2023
- Historic Market Size - Application Segment 2019 - 2023 ($ million)
- 5.3 Form Factor segment analysis 2019 - 2023
- Historic Market Size - Form Factor Segment 2019 - 2023 ($ million)
- 5.4 Geography segment analysis 2019 - 2023
- Historic Market Size - Geography Segment 2019 - 2023 ($ million)
- 5.5 Country segment analysis 2019 - 2023
- Historic Market Size - Country Segment 2019 - 2023 ($ million)
6 Qualitative Analysis
- 6.1 Impact of AI On The Global Sodium Silicate Market
7 Five Forces Analysis
- 7.1 Five forces summary
- Five forces analysis - Comparison between 2024 and 2029
- 7.2 Bargaining power of buyers
- Bargaining power of buyers - Impact of key factors 2024 and 2029
- 7.3 Bargaining power of suppliers
- Bargaining power of suppliers - Impact of key factors in 2024 and 2029
- 7.4 Threat of new entrants
- Threat of new entrants - Impact of key factors in 2024 and 2029
- 7.5 Threat of substitutes
- Threat of substitutes - Impact of key factors in 2024 and 2029
- 7.6 Threat of rivalry
- Threat of rivalry - Impact of key factors in 2024 and 2029
- 7.7 Market condition
- Chart on Market condition - Five forces 2024 and 2029
8 Market Segmentation by Application
- 8.1 Market segments
- Chart on Application - Market share 2024-2029 (%)
- Data Table on Application - Market share 2024-2029 (%)
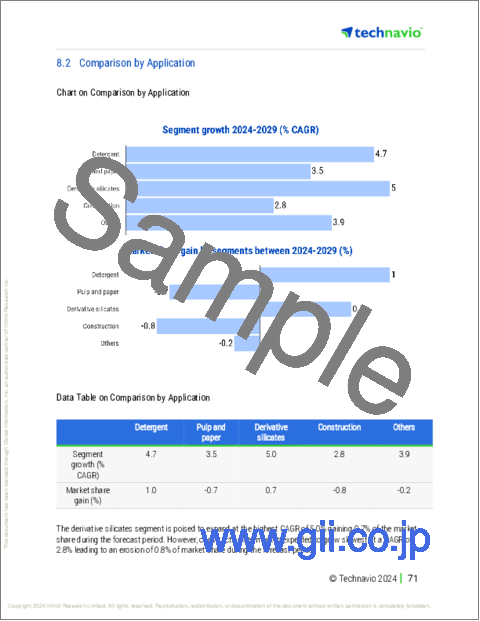
- 8.2 Comparison by Application
- Chart on Comparison by Application
- Data Table on Comparison by Application
- 8.3 Detergent - Market size and forecast 2024-2029
- Chart on Detergent - Market size and forecast 2024-2029 ($ million)
- Data Table on Detergent - Market size and forecast 2024-2029 ($ million)
- Chart on Detergent - Year-over-year growth 2024-2029 (%)
- Data Table on Detergent - Year-over-year growth 2024-2029 (%)
- 8.4 Pulp and paper - Market size and forecast 2024-2029
- Chart on Pulp and paper - Market size and forecast 2024-2029 ($ million)
- Data Table on Pulp and paper - Market size and forecast 2024-2029 ($ million)
- Chart on Pulp and paper - Year-over-year growth 2024-2029 (%)
- Data Table on Pulp and paper - Year-over-year growth 2024-2029 (%)
- 8.5 Derivative silicates - Market size and forecast 2024-2029
- Chart on Derivative silicates - Market size and forecast 2024-2029 ($ million)
- Data Table on Derivative silicates - Market size and forecast 2024-2029 ($ million)
- Chart on Derivative silicates - Year-over-year growth 2024-2029 (%)
- Data Table on Derivative silicates - Year-over-year growth 2024-2029 (%)
- 8.6 Construction - Market size and forecast 2024-2029
- Chart on Construction - Market size and forecast 2024-2029 ($ million)
- Data Table on Construction - Market size and forecast 2024-2029 ($ million)
- Chart on Construction - Year-over-year growth 2024-2029 (%)
- Data Table on Construction - Year-over-year growth 2024-2029 (%)
- 8.7 Others - Market size and forecast 2024-2029
- Chart on Others - Market size and forecast 2024-2029 ($ million)
- Data Table on Others - Market size and forecast 2024-2029 ($ million)
- Chart on Others - Year-over-year growth 2024-2029 (%)
- Data Table on Others - Year-over-year growth 2024-2029 (%)
- 8.8 Market opportunity by Application
- Market opportunity by Application ($ million)
- Data Table on Market opportunity by Application ($ million)
9 Market Segmentation by Form Factor
- 9.1 Market segments
- Chart on Form Factor - Market share 2024-2029 (%)
- Data Table on Form Factor - Market share 2024-2029 (%)
- 9.2 Comparison by Form Factor
- Chart on Comparison by Form Factor
- Data Table on Comparison by Form Factor
- 9.3 Liquid - Market size and forecast 2024-2029
- Chart on Liquid - Market size and forecast 2024-2029 ($ million)
- Data Table on Liquid - Market size and forecast 2024-2029 ($ million)
- Chart on Liquid - Year-over-year growth 2024-2029 (%)
- Data Table on Liquid - Year-over-year growth 2024-2029 (%)
- 9.4 Solid - Market size and forecast 2024-2029
- Chart on Solid - Market size and forecast 2024-2029 ($ million)
- Data Table on Solid - Market size and forecast 2024-2029 ($ million)
- Chart on Solid - Year-over-year growth 2024-2029 (%)
- Data Table on Solid - Year-over-year growth 2024-2029 (%)
- 9.5 Market opportunity by Form Factor
- Market opportunity by Form Factor ($ million)
- Data Table on Market opportunity by Form Factor ($ million)
10 Customer Landscape
- 10.1 Customer landscape overview
- Analysis of price sensitivity, lifecycle, customer purchase basket, adoption rates, and purchase criteria
11 Geographic Landscape
- 11.1 Geographic segmentation
- Chart on Market share By Geographical Landscape 2024-2029 (%)
- Data Table on Market share By Geographical Landscape 2024-2029 (%)
- 11.2 Geographic comparison
- Chart on Geographic comparison
- Data Table on Geographic comparison
- 11.3 APAC - Market size and forecast 2024-2029
- Chart on APAC - Market size and forecast 2024-2029 ($ million)
- Data Table on APAC - Market size and forecast 2024-2029 ($ million)
- Chart on APAC - Year-over-year growth 2024-2029 (%)
- Data Table on APAC - Year-over-year growth 2024-2029 (%)
- 11.4 North America - Market size and forecast 2024-2029
- Chart on North America - Market size and forecast 2024-2029 ($ million)
- Data Table on North America - Market size and forecast 2024-2029 ($ million)
- Chart on North America - Year-over-year growth 2024-2029 (%)
- Data Table on North America - Year-over-year growth 2024-2029 (%)
- 11.5 Europe - Market size and forecast 2024-2029
- Chart on Europe - Market size and forecast 2024-2029 ($ million)
- Data Table on Europe - Market size and forecast 2024-2029 ($ million)
- Chart on Europe - Year-over-year growth 2024-2029 (%)
- Data Table on Europe - Year-over-year growth 2024-2029 (%)
- 11.6 Middle East and Africa - Market size and forecast 2024-2029
- Chart on Middle East and Africa - Market size and forecast 2024-2029 ($ million)
- Data Table on Middle East and Africa - Market size and forecast 2024-2029 ($ million)
- Chart on Middle East and Africa - Year-over-year growth 2024-2029 (%)
- Data Table on Middle East and Africa - Year-over-year growth 2024-2029 (%)
- 11.7 South America - Market size and forecast 2024-2029
- Chart on South America - Market size and forecast 2024-2029 ($ million)
- Data Table on South America - Market size and forecast 2024-2029 ($ million)
- Chart on South America - Year-over-year growth 2024-2029 (%)
- Data Table on South America - Year-over-year growth 2024-2029 (%)
- 11.8 US - Market size and forecast 2024-2029
- Chart on US - Market size and forecast 2024-2029 ($ million)
- Data Table on US - Market size and forecast 2024-2029 ($ million)
- Chart on US - Year-over-year growth 2024-2029 (%)
- Data Table on US - Year-over-year growth 2024-2029 (%)
- 11.9 China - Market size and forecast 2024-2029
- Chart on China - Market size and forecast 2024-2029 ($ million)
- Data Table on China - Market size and forecast 2024-2029 ($ million)
- Chart on China - Year-over-year growth 2024-2029 (%)
- Data Table on China - Year-over-year growth 2024-2029 (%)
- 11.10 India - Market size and forecast 2024-2029
- Chart on India - Market size and forecast 2024-2029 ($ million)
- Data Table on India - Market size and forecast 2024-2029 ($ million)
- Chart on India - Year-over-year growth 2024-2029 (%)
- Data Table on India - Year-over-year growth 2024-2029 (%)
- 11.11 Germany - Market size and forecast 2024-2029
- Chart on Germany - Market size and forecast 2024-2029 ($ million)
- Data Table on Germany - Market size and forecast 2024-2029 ($ million)
- Chart on Germany - Year-over-year growth 2024-2029 (%)
- Data Table on Germany - Year-over-year growth 2024-2029 (%)
- 11.12 Japan - Market size and forecast 2024-2029
- Chart on Japan - Market size and forecast 2024-2029 ($ million)
- Data Table on Japan - Market size and forecast 2024-2029 ($ million)
- Chart on Japan - Year-over-year growth 2024-2029 (%)
- Data Table on Japan - Year-over-year growth 2024-2029 (%)
- 11.13 Canada - Market size and forecast 2024-2029
- Chart on Canada - Market size and forecast 2024-2029 ($ million)
- Data Table on Canada - Market size and forecast 2024-2029 ($ million)
- Chart on Canada - Year-over-year growth 2024-2029 (%)
- Data Table on Canada - Year-over-year growth 2024-2029 (%)
- 11.14 Brazil - Market size and forecast 2024-2029
- Chart on Brazil - Market size and forecast 2024-2029 ($ million)
- Data Table on Brazil - Market size and forecast 2024-2029 ($ million)
- Chart on Brazil - Year-over-year growth 2024-2029 (%)
- Data Table on Brazil - Year-over-year growth 2024-2029 (%)
- 11.15 UK - Market size and forecast 2024-2029
- Chart on UK - Market size and forecast 2024-2029 ($ million)
- Data Table on UK - Market size and forecast 2024-2029 ($ million)
- Chart on UK - Year-over-year growth 2024-2029 (%)
- Data Table on UK - Year-over-year growth 2024-2029 (%)
- 11.16 South Korea - Market size and forecast 2024-2029
- Chart on South Korea - Market size and forecast 2024-2029 ($ million)
- Data Table on South Korea - Market size and forecast 2024-2029 ($ million)
- Chart on South Korea - Year-over-year growth 2024-2029 (%)
- Data Table on South Korea - Year-over-year growth 2024-2029 (%)
- 11.17 Australia - Market size and forecast 2024-2029
- Chart on Australia - Market size and forecast 2024-2029 ($ million)
- Data Table on Australia - Market size and forecast 2024-2029 ($ million)
- Chart on Australia - Year-over-year growth 2024-2029 (%)
- Data Table on Australia - Year-over-year growth 2024-2029 (%)
- 11.18 Market opportunity By Geographical Landscape
- Market opportunity By Geographical Landscape ($ million)
- Data Tables on Market opportunity By Geographical Landscape ($ million)
12 Drivers, Challenges, and Opportunity/Restraints
- 12.1 Market drivers
- 12.2 Market challenges
- 12.3 Impact of drivers and challenges
- Impact of drivers and challenges in 2024 and 2029
- 12.4 Market opportunities/restraints
13 Competitive Landscape
- 13.1 Overview
- 13.2 Competitive Landscape
- Overview on criticality of inputs and factors of differentiation
- 13.3 Landscape disruption
- Overview on factors of disruption
- 13.4 Industry risks
- Impact of key risks on business
14 Competitive Analysis
- 14.1 Companies profiled
- Companies covered
- 14.2 Company ranking index
- Company ranking index
- 14.3 Market positioning of companies
- Matrix on companies position and classification
- 14.4 Ankit Silicate
- Ankit Silicate - Overview
- Ankit Silicate - Product / Service
- Ankit Silicate - Key offerings
- SWOT
- 14.5 Antika Officina Botanika
- Antika Officina Botanika - Overview
- Antika Officina Botanika - Product / Service
- Antika Officina Botanika - Key offerings
- SWOT
- 14.6 BASF SE
- BASF SE - Overview
- BASF SE - Business segments
- BASF SE - Key news
- BASF SE - Key offerings
- BASF SE - Segment focus
- SWOT
- 14.7 Evonik Industries AG
- Evonik Industries AG - Overview
- Evonik Industries AG - Business segments
- Evonik Industries AG - Key news
- Evonik Industries AG - Key offerings
- Evonik Industries AG - Segment focus
- SWOT
- 14.8 Fuji Silysia Chemical Ltd.
- Fuji Silysia Chemical Ltd. - Overview
- Fuji Silysia Chemical Ltd. - Product / Service
- Fuji Silysia Chemical Ltd. - Key offerings
- SWOT
- 14.9 Hindcon Chemicals Ltd.
- Hindcon Chemicals Ltd. - Overview
- Hindcon Chemicals Ltd. - Product / Service
- Hindcon Chemicals Ltd. - Key offerings
- SWOT
- 14.10 Hi-Tech Minerals and Chemicals
- Hi-Tech Minerals and Chemicals - Overview
- Hi-Tech Minerals and Chemicals - Product / Service
- Hi-Tech Minerals and Chemicals - Key offerings
- SWOT
- 14.11 Occidental Petroleum Corp.
- Occidental Petroleum Corp. - Overview
- Occidental Petroleum Corp. - Business segments
- Occidental Petroleum Corp. - Key news
- Occidental Petroleum Corp. - Key offerings
- Occidental Petroleum Corp. - Segment focus
- SWOT
- 14.12 Possehl Erzkontor GmbH Co. KG
- Possehl Erzkontor GmbH Co. KG - Overview
- Possehl Erzkontor GmbH Co. KG - Product / Service
- Possehl Erzkontor GmbH Co. KG - Key offerings
- SWOT
- 14.13 PQ Group Holdings Inc.
- PQ Group Holdings Inc. - Overview
- PQ Group Holdings Inc. - Product / Service
- PQ Group Holdings Inc. - Key news
- PQ Group Holdings Inc. - Key offerings
- SWOT
- 14.14 Qemetica
- Qemetica - Overview
- Qemetica - Product / Service
- Qemetica - Key offerings
- SWOT
- 14.15 Silmaco NV
- Silmaco NV - Overview
- Silmaco NV - Product / Service
- Silmaco NV - Key offerings
- SWOT
- 14.16 W. R. Grace and Co.
- W. R. Grace and Co. - Overview
- W. R. Grace and Co. - Product / Service
- W. R. Grace and Co. - Key offerings
- SWOT
- 14.17 Welcome Chemicals
- Welcome Chemicals - Overview
- Welcome Chemicals - Product / Service
- Welcome Chemicals - Key offerings
- SWOT
- 14.18 Z. Ch. Rudniki SA
- Z. Ch. Rudniki SA - Overview
- Z. Ch. Rudniki SA - Product / Service
- Z. Ch. Rudniki SA - Key offerings
- SWOT
15 Appendix
- 15.1 Scope of the report
- 15.2 Inclusions and exclusions checklist
- Inclusions checklist
- Exclusions checklist
- 15.3 Currency conversion rates for US$
- Currency conversion rates for US$
- 15.4 Research methodology
- Research methodology
- 15.5 Data procurement
- Information sources
- 15.6 Data validation
- Data validation
- 15.7 Validation techniques employed for market sizing
- Validation techniques employed for market sizing
- 15.8 Data synthesis
- Data synthesis
- 15.9 360 degree market analysis
- 360 degree market analysis
- 15.10 List of abbreviations
- List of abbreviations
