|
|
市場調査レポート
商品コード
1911047
世界のバイオプロセス技術市場2025-2029年Global Bioprocess Technology Market 2025-2029 |
||||||
|
|||||||
カスタマイズ可能
|
|||||||

| 世界のバイオプロセス技術市場2025-2029年 |
|
出版日: 2026年01月14日
発行: TechNavio
ページ情報: 英文 296 Pages
納期: 即納可能
|

概要
世界のバイオプロセス技術市場は、2024年から2029年にかけて556億3,540万米ドルの成長が見込まれており、予測期間中のCAGRは11.4%と予測されています。
本レポートでは、世界のバイオプロセス技術市場に関する包括的な分析、市場規模と予測、動向、成長要因、課題に加え、約25社のベンダー分析を提供しております。
本レポートは、現在の市場状況、最新の動向と促進要因、市場環境全般に関する最新の分析を提供します。市場は、感染症の増加、慢性疾患の増加、発展途上国におけるヘルスケア医療費の増加によって牽引されています。
本調査は、業界の主要関係者からの情報をはじめとする一次情報と二次情報を客観的に組み合わせて実施されました。本レポートには、主要企業の分析に加え、包括的な市場規模データ、地域別分析を伴うセグメント、ベンダー情勢が含まれています。レポートには過去データと予測データが記載されています。
| 市場範囲 | |
|---|---|
| 基準年 | 2025年 |
| 終了年 | 2029年 |
| 予測期間 | 2025-2029 |
| 成長モメンタム | 加速 |
| 前年比 | 10.3% |
| CAGR | 11.4% |
| 増分額 | 556億3,540万米ドル |
本調査では、今後数年間における世界のバイオプロセス技術市場の成長を牽引する主な要因の一つとして、各国における臨床試験の増加を挙げております。また、企業による合併・買収活動の増加や3D細胞培養への需要拡大が、市場における相当な需要につながると見込まれます。
目次
第1章 エグゼクティブサマリー
- 市場概要
第2章 Technavio分析
- 価格・ライフサイクル・顧客購入バスケット・採用率・購入基準の分析
- インプットの重要性と差別化の要因
- 混乱の要因
- 促進要因と課題の影響
第3章 市場情勢
- 市場エコシステム
- 市場の特徴
- バリューチェーン分析
第4章 市場規模
- 市場の定義
- 市場セグメント分析
- 市場規模 2024
- 市場の見通し 2024-2029
第5章 市場規模実績
- 世界のバイオプロセス技術市場 2019-2023
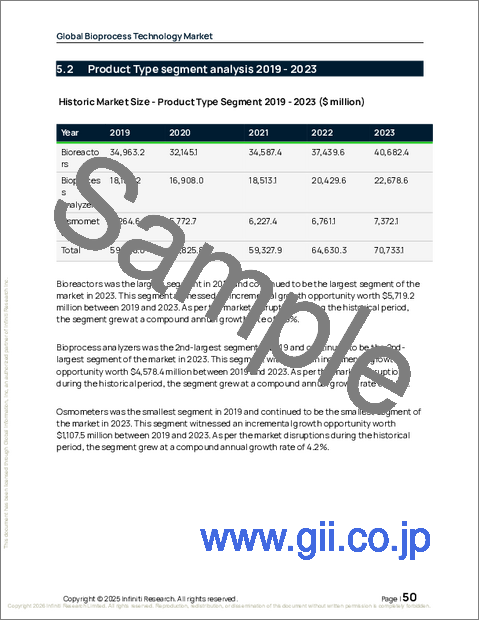
- 製品タイプセグメント分析 2019-2023
- 用途別セグメント分析 2019-2023
- エンドユーザーセグメント分析 2019-2023
- 地域別セグメント分析 2019-2023
- 国別セグメント分析 2019-2023
第6章 定性分析
- AIの影響:世界のバイオプロセス技術市場
第7章 ファイブフォース分析
- ファイブフォースの要約
- 買い手の交渉力
- 供給企業の交渉力
- 新規参入業者の脅威
- 代替品の脅威
- 競争の脅威
- 市況
第8章 市場セグメンテーション:製品タイプ別
- 市場セグメント
- 比較:製品タイプ別
- バイオリアクター:市場規模と予測 2024-2029
- バイオプロセス分析装置:市場規模と予測 2024-2029
- 浸透圧計:市場規模と予測 2024-2029
- 市場機会:製品タイプ別
第9章 市場セグメンテーション:用途別
- 市場セグメント
- 比較:用途別
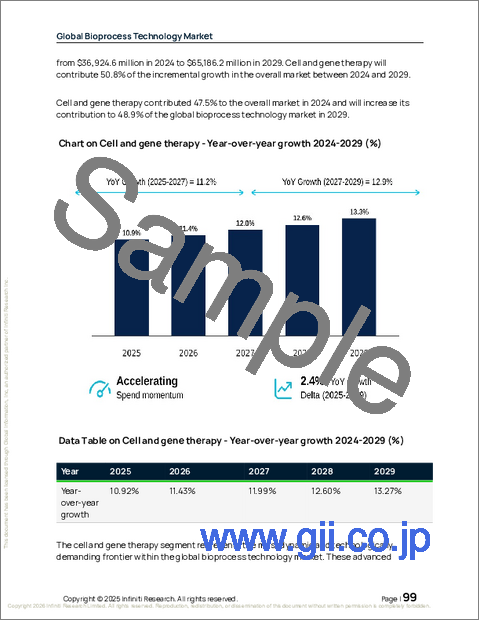
- 細胞・遺伝子治療:市場規模と予測 2024-2029
- モノクローナル抗体:市場規模と予測 2024-2029
- 組換えタンパク質:市場規模と予測 2024-2029
- 市場機会:用途別
第10章 市場セグメンテーション:エンドユーザー別
- 市場セグメント
- 比較:エンドユーザー別
- バイオ医薬品企業:市場規模と予測 2024-2029
- 受託製造機関:市場規模と予測 2024-2029
- 学術研究機関:市場規模と予測 2024-2029
- その他:市場規模と予測 2024-2029
- 市場機会:エンドユーザー別
第11章 顧客情勢
- 顧客情勢の概要
第12章 地域別情勢
- 地域別セグメンテーション
- 地域別比較
- 北米:市場規模と予測 2024-2029
- 欧州:市場規模と予測 2024-2029
- アジア:市場規模と予測 2024-2029
- 世界のその他の地域:市場規模と予測 2024-2029
- 市場機会:地域別
第13章 促進要因、課題、および機会
- 市場促進要因
- 市場の課題
- 促進要因と課題の影響
- 市場機会
第14章 競合情勢
- 概要
- 競合情勢
- 混乱の状況
- 業界のリスク
第15章 競合分析
- 企業プロファイル
- 企業ランキング指標
- 企業の市場ポジショニング
- Boehringer Ingelheim GmbH
- Catalent Inc.
- Charles River Laboratories
- Corning Inc.
- Danaher Corp.
- Emerson Electric Co.
- Eppendorf SE
- ILC Dover LP
- Lonza Group Ltd.
- Merck KGaA
- Nova Biomedical Corp.
- Repligen Corp.
- Sartorius AG
- Thermo Fisher Scientific Inc.
- Univercells SA

