|
|
市場調査レポート
商品コード
1915517
世界の亜塩素酸ナトリウム市場、2025年~2029年Global Sodium Chlorite Market 2025-2029 |
||||||
|
|||||||
カスタマイズ可能
|
|||||||

| 世界の亜塩素酸ナトリウム市場、2025年~2029年 |
|
出版日: 2026年01月19日
発行: TechNavio
ページ情報: 英文 286 Pages
納期: 即納可能
|

概要
世界の亜塩素酸ナトリウム市場は、2024年から2029年の間に8,960万米ドルの成長が見込まれ、予測期間中のCAGRは5.6%と予測されています。
本報告書では、世界の亜塩素酸ナトリウム市場に関する包括的な分析、市場規模と予測、動向、成長要因、課題に加え、約25社のベンダー分析を提供しております。
本レポートは、現在の市場状況、最新の動向と促進要因、市場環境全般に関する最新の分析を提供します。水処理および浄化への需要の高まりが市場成長を牽引し、パルプ・製紙業界における環境に優しい漂白への需要急増、消毒剤および抗菌剤としての用途拡大が市場を推進しています。
本調査は、業界の主要関係者からの情報を含む、一次情報と二次情報の客観的な組み合わせを用いて実施されました。本レポートには、主要企業の分析に加え、包括的な市場規模データ、地域別分析を伴うセグメント、ベンダー情勢が含まれています。レポートには過去データと予測データが掲載されています。
| 市場範囲 | |
|---|---|
| 基準年 | 2025年 |
| 対象期間 | 2029年 |
| 予測期間 | 2025年~2029年 |
| 成長モメンタム | 加速 |
| 前年比 | 5.1% |
| CAGR | 5.6% |
| 増分額 | 8,960万米ドル |
本調査では、今後数年間における世界の次亜塩素酸ナトリウム市場の成長を牽引する主な要因の一つとして、水質浄化および消毒への関心の高まりを挙げております。また、繊維・紙産業における持続可能な漂白への需要急増、ならびにアジア太平洋地域における優位性と戦略的拡大が、市場における相当な需要を生み出すものと見込まれます。
目次
第1章 エグゼクティブサマリー
第2章 Technavio分析
- 価格・ライフサイクル・顧客購入バスケット・採用率・購入基準の分析
- インプットの重要性と差別化の要因
- 混乱の要因
- 促進要因と課題の影響
第3章 市場情勢
- 市場エコシステム
- 市場の特徴
- バリューチェーン分析
第4章 市場規模
- 市場の定義
- 市場セグメント分析
- 市場規模 2024年
- 市場の見通し 2024年~2029年
第5章 市場規模実績
- 世界の亜塩素酸ナトリウム市場 2019年~2023年
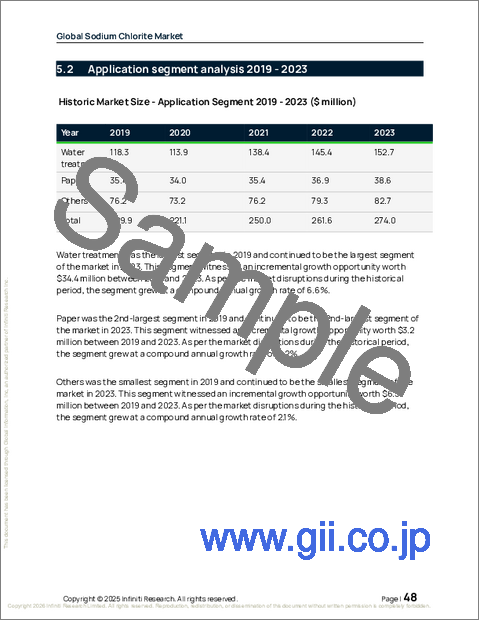
- 用途別セグメント分析 2019年~2023年
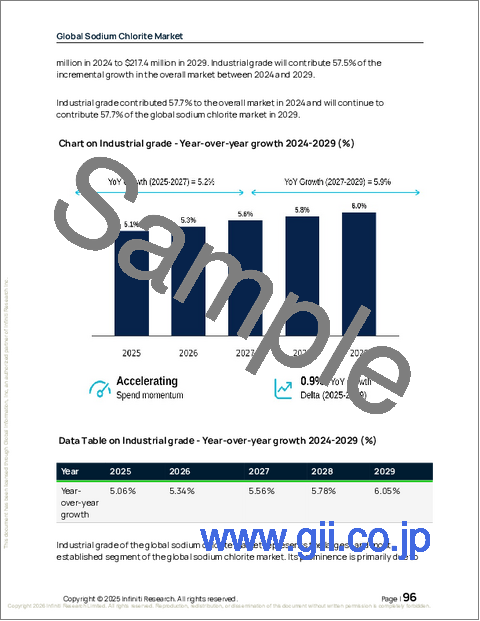
- グレードタイプセグメント分析 2019年~2023年
- 原料セグメント分析 2019年~2023年
- 地域別セグメント分析 2019年~2023年
- 国別セグメント分析 2019年~2023年
第6章 定性分析
- AIの影響:世界の亜塩素酸ナトリウム市場
第7章 ファイブフォース分析
- ファイブフォースの要約
- 買い手の交渉力
- 供給企業の交渉力
- 新規参入業者の脅威
- 代替品の脅威
- 競争の脅威
- 市況
第8章 市場セグメンテーション:用途別
- 比較:用途別
- 水処理
- 紙
- その他
- 市場機会:用途別
第9章 市場セグメンテーション:グレードタイプ別
- 比較:グレードタイプ別
- 工業用グレード
- 食品グレード
- 医薬品グレード
- 市場機会:グレードタイプ別
第10章 市場セグメンテーション:原材料別
- 比較:原材料別
- 水酸化ナトリウム
- 過酸化水素
- 二酸化塩素
- 市場機会:原材料別
第11章 顧客情勢
第12章 地域別情勢
- 地域別セグメンテーション
- 地域別比較
- アジア太平洋
- 中国
- インド
- 日本
- 韓国
- ベトナム
- オーストラリア
- 北米
- 米国
- カナダ
- メキシコ
- 欧州
- ドイツ
- 英国
- フランス
- イタリア
- スペイン
- オランダ
- 南米
- ブラジル
- アルゼンチン
- チリ
- 中東・アフリカ
- 南アフリカ
- サウジアラビア
- アラブ首長国連邦
- エジプト
- モロッコ
- 市場機会:地域別
第13章 促進要因・課題・機会
- 市場促進要因
- 市場の課題
- 促進要因と課題の影響
- 市場機会
第14章 競合情勢
- 概要
- 競合情勢
- 混乱の状況
- 業界のリスク
第15章 競合分析
- 企業プロファイル
- 企業ランキング指標
- 企業の市場ポジショニング
- Airedale Group
- American Elements Inc.
- Carlit Co. Ltd.
- Dongying Shengya Chemical Co. Ltd.
- ERCO Worldwide
- Ercros SA
- Fengchen Group Co. Ltd.
- International Dioxcide Inc.
- Occidental Petroleum Corp.
- OSAKA SODA CO. Ltd.
- Otto Chemie Pvt. Ltd.
- Sabara Group
- Shandong Gaomi Gaoyuan Chemical Industry Co. Ltd.
- Shree Chlorates Pvt. Ltd.
- Sigma Aldrich Chemicals Ltd.

