|
|
市場調査レポート
商品コード
1625771
自動車用冷却水の世界市場、2024~2028年Global Automotive Coolant Market 2024-2028 |
||||||

|
|||||||
カスタマイズ可能
|
|||||||

| 自動車用冷却水の世界市場、2024~2028年 |
|
出版日: 2024年11月21日
発行: TechNavio
ページ情報: 英文 208 Pages
納期: 即納可能
|

全表示
- 概要
- 図表
- 目次
自動車用冷却水市場、2024~2028年
自動車用冷却水市場は2023~2028年に14億1,310万米ドル、予測期間中のCAGRは5.8%で成長すると予測されます。当レポートでは、自動車用冷却水市場の全体的な分析、市場規模・予測、動向、成長促進要因、課題、約25のベンダーを網羅したベンダー分析などを掲載しています。
現在の市場シナリオ、最新動向と促進要因、市場環境全体に関する最新分析を提供しています。市場は、新製品の導入、製品開発の革新、環境に優しい自動車用冷却水への需要の高まりによって牽引されています。
| 市場範囲 | |
|---|---|
| 基準年 | 2024年 |
| 終了年 | 2028年 |
| 予測期間 | 2024~2028年 |
| 成長モメンタム | 加速 |
| 前年比2024年 | 5.3% |
| CAGR | 5.8% |
| 増分額 | 14億1,310万米ドル |
本調査では、今後数年間の自動車用冷却水市場の成長を牽引する主な要因の一つとして、インオーガニックグロース戦略を挙げています。また、生産能力の拡大やEVにおける自動車用冷却水需要の高まりは、市場の大きな需要につながります。
目次
第1章 エグゼクティブサマリー
- 市場概要
第2章 Technavio別分析
- 価格・ライフサイクル・顧客購入バスケット・採用率・購入基準の分析
- インプットの重要性と差別化の要因
- 混乱の要因
- 促進要因と課題の影響
第3章 市場情勢
- 市場エコシステム
- 市場の特徴
- バリューチェーン分析
第4章 市場規模
- 市場の定義
- 市場セグメント分析
- 市場規模 2023年
- 市場の展望 2023~2028年
第5章 市場規模実績
- 自動車用冷却水の世界市場 2018~2022年
- 用途別セグメント分析 2018~2022年
- エンドユーザー別セグメント分析 2018~2022年
- 地域別セグメント分析 2018~2022年
- 国別セグメント分析 2018~2022年
第6章 定性分析
- AIの影響:自動車用冷却水の世界市場
第7章 ファイブフォース分析
- ファイブフォースの要約
- 買い手の交渉力
- 供給企業の交渉力
- 新規参入業者の脅威
- 代替品の脅威
- 競争の脅威
- 市況
第8章 市場セグメンテーション:用途別
- 市場セグメント
- 比較:用途別
- 乗用車:市場規模と予測 2023~2028年
- 中型および大型商用車(MとHCV):市場規模と予測 2023~2028年
- 小型商用車(LCV):市場規模と予測 2023~2028年
- 市場機会:用途別
第9章 市場セグメンテーション:エンドユーザー別
- 市場セグメント
- 比較:エンドユーザー別
- アフターマーケット:市場規模と予測 2023~2028年
- OEM:市場規模と予測 2023~2028年
- 市場機会:エンドユーザー別
第10章 顧客情勢
- 顧客情勢の概要
第11章 地域別情勢
- 地域別セグメンテーション
- 地域別比較
- アジア太平洋:市場規模と予測 2023~2028年
- 欧州:市場規模と予測 2023~2028年
- 北米:市場規模と予測 2023~2028年
- 中東・アフリカ:市場規模と予測 2023~2028年
- 南米:市場規模と予測 2023~2028年
- 中国:市場規模と予測 2023~2028年
- 米国:市場規模と予測 2023~2028年
- インド:市場規模と予測 2023~2028年
- 日本:市場規模と予測 2023~2028年
- 韓国:市場規模と予測 2023~2028年
- ブラジル:市場規模と予測 2023~2028年
- ドイツ:市場規模と予測 2023~2028年
- 英国:市場規模と予測 2023~2028年
- フランス:市場規模と予測 2023~2028年
- ロシア:市場規模と予測 2023~2028年
- 市場機会:地域情勢別
第12章 促進要因・課題・機会・抑制要因
- 市場促進要因
- 市場の課題
- 促進要因と課題の影響
- 市場の機会・抑制要因
第13章 競合情勢
- 概要
- 競合情勢
- 混乱の状況
- 業界のリスク
第14章 競合分析
- 企業プロファイル
- 企業ランキング指数
- 企業の市場ポジショニング
- AMSOIL Inc.
- BASF SE
- Castrol Ltd.
- Chevron Corp.
- Cummins Inc.
- Exxon Mobil Corp.
- FUCHS SE
- Gandhar Oil Refinery India Ltd.
- Indian Oil Corp. Ltd.
- MOTUL SA
- PETRONAS Chemicals Group Berhad
- Prestone Products Corp.
- Recochem Inc.
- TotalEnergies SE
- Valvoline Inc.
第15章 付録
Exhibits:
- Exhibits1: Executive Summary - Chart on Market Overview
- Exhibits2: Executive Summary - Data Table on Market Overview
- Exhibits3: Executive Summary - Chart on Global Market Characteristics
- Exhibits4: Executive Summary - Chart on Market By Geographical Landscape
- Exhibits5: Executive Summary - Chart on Market Segmentation by Application
- Exhibits6: Executive Summary - Chart on Market Segmentation by End-user
- Exhibits7: Executive Summary - Chart on Incremental Growth
- Exhibits8: Executive Summary - Data Table on Incremental Growth
- Exhibits9: Executive Summary - Chart on Company Market Positioning
- Exhibits10: Analysis of price sensitivity, lifecycle, customer purchase basket, adoption rates, and purchase criteria
- Exhibits11: Overview on criticality of inputs and factors of differentiation
- Exhibits12: Overview on factors of disruption
- Exhibits13: Impact of drivers and challenges in 2023 and 2028
- Exhibits14: Parent Market
- Exhibits15: Data Table on - Parent Market
- Exhibits16: Market characteristics analysis
- Exhibits17: Value Chain Analysis
- Exhibits18: Offerings of companies included in the market definition
- Exhibits19: Market segments
- Exhibits20: Chart on Global - Market size and forecast 2023-2028 ($ million)
- Exhibits21: Data Table on Global - Market size and forecast 2023-2028 ($ million)
- Exhibits22: Chart on Global Market: Year-over-year growth 2023-2028 (%)
- Exhibits23: Data Table on Global Market: Year-over-year growth 2023-2028 (%)
- Exhibits24: Historic Market Size - Data Table on Global Automotive Coolant Market 2018 - 2022 ($ million)
- Exhibits25: Historic Market Size - Application Segment 2018 - 2022 ($ million)
- Exhibits26: Historic Market Size - End-user Segment 2018 - 2022 ($ million)
- Exhibits27: Historic Market Size - Geography Segment 2018 - 2022 ($ million)
- Exhibits28: Historic Market Size - Country Segment 2018 - 2022 ($ million)
- Exhibits29: Five forces analysis - Comparison between 2023 and 2028
- Exhibits30: Bargaining power of buyers - Impact of key factors 2023 and 2028
- Exhibits31: Bargaining power of suppliers - Impact of key factors in 2023 and 2028
- Exhibits32: Threat of new entrants - Impact of key factors in 2023 and 2028
- Exhibits33: Threat of substitutes - Impact of key factors in 2023 and 2028
- Exhibits34: Threat of rivalry - Impact of key factors in 2023 and 2028
- Exhibits35: Chart on Market condition - Five forces 2023 and 2028
- Exhibits36: Chart on Application - Market share 2023-2028 (%)
- Exhibits37: Data Table on Application - Market share 2023-2028 (%)
- Exhibits38: Chart on Comparison by Application
- Exhibits39: Data Table on Comparison by Application
- Exhibits40: Chart on Passenger cars - Market size and forecast 2023-2028 ($ million)
- Exhibits41: Data Table on Passenger cars - Market size and forecast 2023-2028 ($ million)
- Exhibits42: Chart on Passenger cars - Year-over-year growth 2023-2028 (%)
- Exhibits43: Data Table on Passenger cars - Year-over-year growth 2023-2028 (%)
- Exhibits44: Chart on M and HCV - Market size and forecast 2023-2028 ($ million)
- Exhibits45: Data Table on M and HCV - Market size and forecast 2023-2028 ($ million)
- Exhibits46: Chart on M and HCV - Year-over-year growth 2023-2028 (%)
- Exhibits47: Data Table on M and HCV - Year-over-year growth 2023-2028 (%)
- Exhibits48: Chart on LCV - Market size and forecast 2023-2028 ($ million)
- Exhibits49: Data Table on LCV - Market size and forecast 2023-2028 ($ million)
- Exhibits50: Chart on LCV - Year-over-year growth 2023-2028 (%)
- Exhibits51: Data Table on LCV - Year-over-year growth 2023-2028 (%)
- Exhibits52: Market opportunity by Application ($ million)
- Exhibits53: Data Table on Market opportunity by Application ($ million)
- Exhibits54: Chart on End-user - Market share 2023-2028 (%)
- Exhibits55: Data Table on End-user - Market share 2023-2028 (%)
- Exhibits56: Chart on Comparison by End-user
- Exhibits57: Data Table on Comparison by End-user
- Exhibits58: Chart on Aftermarket - Market size and forecast 2023-2028 ($ million)
- Exhibits59: Data Table on Aftermarket - Market size and forecast 2023-2028 ($ million)
- Exhibits60: Chart on Aftermarket - Year-over-year growth 2023-2028 (%)
- Exhibits61: Data Table on Aftermarket - Year-over-year growth 2023-2028 (%)
- Exhibits62: Chart on OEM - Market size and forecast 2023-2028 ($ million)
- Exhibits63: Data Table on OEM - Market size and forecast 2023-2028 ($ million)
- Exhibits64: Chart on OEM - Year-over-year growth 2023-2028 (%)
- Exhibits65: Data Table on OEM - Year-over-year growth 2023-2028 (%)
- Exhibits66: Market opportunity by End-user ($ million)
- Exhibits67: Data Table on Market opportunity by End-user ($ million)
- Exhibits68: Analysis of price sensitivity, lifecycle, customer purchase basket, adoption rates, and purchase criteria
- Exhibits69: Chart on Market share By Geographical Landscape 2023-2028 (%)
- Exhibits70: Data Table on Market share By Geographical Landscape 2023-2028 (%)
- Exhibits71: Chart on Geographic comparison
- Exhibits72: Data Table on Geographic comparison
- Exhibits73: Chart on APAC - Market size and forecast 2023-2028 ($ million)
- Exhibits74: Data Table on APAC - Market size and forecast 2023-2028 ($ million)
- Exhibits75: Chart on APAC - Year-over-year growth 2023-2028 (%)
- Exhibits76: Data Table on APAC - Year-over-year growth 2023-2028 (%)
- Exhibits77: Chart on Europe - Market size and forecast 2023-2028 ($ million)
- Exhibits78: Data Table on Europe - Market size and forecast 2023-2028 ($ million)
- Exhibits79: Chart on Europe - Year-over-year growth 2023-2028 (%)
- Exhibits80: Data Table on Europe - Year-over-year growth 2023-2028 (%)
- Exhibits81: Chart on North America - Market size and forecast 2023-2028 ($ million)
- Exhibits82: Data Table on North America - Market size and forecast 2023-2028 ($ million)
- Exhibits83: Chart on North America - Year-over-year growth 2023-2028 (%)
- Exhibits84: Data Table on North America - Year-over-year growth 2023-2028 (%)
- Exhibits85: Chart on Middle East and Africa - Market size and forecast 2023-2028 ($ million)
- Exhibits86: Data Table on Middle East and Africa - Market size and forecast 2023-2028 ($ million)
- Exhibits87: Chart on Middle East and Africa - Year-over-year growth 2023-2028 (%)
- Exhibits88: Data Table on Middle East and Africa - Year-over-year growth 2023-2028 (%)
- Exhibits89: Chart on South America - Market size and forecast 2023-2028 ($ million)
- Exhibits90: Data Table on South America - Market size and forecast 2023-2028 ($ million)
- Exhibits91: Chart on South America - Year-over-year growth 2023-2028 (%)
- Exhibits92: Data Table on South America - Year-over-year growth 2023-2028 (%)
- Exhibits93: Chart on China - Market size and forecast 2023-2028 ($ million)
- Exhibits94: Data Table on China - Market size and forecast 2023-2028 ($ million)
- Exhibits95: Chart on China - Year-over-year growth 2023-2028 (%)
- Exhibits96: Data Table on China - Year-over-year growth 2023-2028 (%)
- Exhibits97: Chart on US - Market size and forecast 2023-2028 ($ million)
- Exhibits98: Data Table on US - Market size and forecast 2023-2028 ($ million)
- Exhibits99: Chart on US - Year-over-year growth 2023-2028 (%)
- Exhibits100: Data Table on US - Year-over-year growth 2023-2028 (%)
- Exhibits101: Chart on India - Market size and forecast 2023-2028 ($ million)
- Exhibits102: Data Table on India - Market size and forecast 2023-2028 ($ million)
- Exhibits103: Chart on India - Year-over-year growth 2023-2028 (%)
- Exhibits104: Data Table on India - Year-over-year growth 2023-2028 (%)
- Exhibits105: Chart on Japan - Market size and forecast 2023-2028 ($ million)
- Exhibits106: Data Table on Japan - Market size and forecast 2023-2028 ($ million)
- Exhibits107: Chart on Japan - Year-over-year growth 2023-2028 (%)
- Exhibits108: Data Table on Japan - Year-over-year growth 2023-2028 (%)
- Exhibits109: Chart on South Korea - Market size and forecast 2023-2028 ($ million)
- Exhibits110: Data Table on South Korea - Market size and forecast 2023-2028 ($ million)
- Exhibits111: Chart on South Korea - Year-over-year growth 2023-2028 (%)
- Exhibits112: Data Table on South Korea - Year-over-year growth 2023-2028 (%)
- Exhibits113: Chart on Brazil - Market size and forecast 2023-2028 ($ million)
- Exhibits114: Data Table on Brazil - Market size and forecast 2023-2028 ($ million)
- Exhibits115: Chart on Brazil - Year-over-year growth 2023-2028 (%)
- Exhibits116: Data Table on Brazil - Year-over-year growth 2023-2028 (%)
- Exhibits117: Chart on Germany - Market size and forecast 2023-2028 ($ million)
- Exhibits118: Data Table on Germany - Market size and forecast 2023-2028 ($ million)
- Exhibits119: Chart on Germany - Year-over-year growth 2023-2028 (%)
- Exhibits120: Data Table on Germany - Year-over-year growth 2023-2028 (%)
- Exhibits121: Chart on UK - Market size and forecast 2023-2028 ($ million)
- Exhibits122: Data Table on UK - Market size and forecast 2023-2028 ($ million)
- Exhibits123: Chart on UK - Year-over-year growth 2023-2028 (%)
- Exhibits124: Data Table on UK - Year-over-year growth 2023-2028 (%)
- Exhibits125: Chart on France - Market size and forecast 2023-2028 ($ million)
- Exhibits126: Data Table on France - Market size and forecast 2023-2028 ($ million)
- Exhibits127: Chart on France - Year-over-year growth 2023-2028 (%)
- Exhibits128: Data Table on France - Year-over-year growth 2023-2028 (%)
- Exhibits129: Chart on Russia - Market size and forecast 2023-2028 ($ million)
- Exhibits130: Data Table on Russia - Market size and forecast 2023-2028 ($ million)
- Exhibits131: Chart on Russia - Year-over-year growth 2023-2028 (%)
- Exhibits132: Data Table on Russia - Year-over-year growth 2023-2028 (%)
- Exhibits133: Market opportunity By Geographical Landscape ($ million)
- Exhibits134: Data Tables on Market opportunity By Geographical Landscape ($ million)
- Exhibits135: Impact of drivers and challenges in 2023 and 2028
- Exhibits136: Overview on criticality of inputs and factors of differentiation
- Exhibits137: Overview on factors of disruption
- Exhibits138: Impact of key risks on business
- Exhibits139: Companies covered
- Exhibits140: Company ranking index
- Exhibits141: Matrix on companies position and classification
- Exhibits142: AMSOIL Inc. - Overview
- Exhibits143: AMSOIL Inc. - Product / Service
- Exhibits144: AMSOIL Inc. - Key offerings
- Exhibits145: SWOT
- Exhibits146: BASF SE - Overview
- Exhibits147: BASF SE - Business segments
- Exhibits148: BASF SE - Key news
- Exhibits149: BASF SE - Key offerings
- Exhibits150: BASF SE - Segment focus
- Exhibits151: SWOT
- Exhibits152: Castrol Ltd. - Overview
- Exhibits153: Castrol Ltd. - Product / Service
- Exhibits154: Castrol Ltd. - Key offerings
- Exhibits155: SWOT
- Exhibits156: Chevron Corp. - Overview
- Exhibits157: Chevron Corp. - Business segments
- Exhibits158: Chevron Corp. - Key news
- Exhibits159: Chevron Corp. - Key offerings
- Exhibits160: Chevron Corp. - Segment focus
- Exhibits161: SWOT
- Exhibits162: Cummins Inc. - Overview
- Exhibits163: Cummins Inc. - Business segments
- Exhibits164: Cummins Inc. - Key news
- Exhibits165: Cummins Inc. - Key offerings
- Exhibits166: Cummins Inc. - Segment focus
- Exhibits167: SWOT
- Exhibits168: Exxon Mobil Corp. - Overview
- Exhibits169: Exxon Mobil Corp. - Business segments
- Exhibits170: Exxon Mobil Corp. - Key news
- Exhibits171: Exxon Mobil Corp. - Key offerings
- Exhibits172: Exxon Mobil Corp. - Segment focus
- Exhibits173: SWOT
- Exhibits174: FUCHS SE - Overview
- Exhibits175: FUCHS SE - Business segments
- Exhibits176: FUCHS SE - Key news
- Exhibits177: FUCHS SE - Key offerings
- Exhibits178: FUCHS SE - Segment focus
- Exhibits179: SWOT
- Exhibits180: Gandhar Oil Refinery India Ltd. - Overview
- Exhibits181: Gandhar Oil Refinery India Ltd. - Product / Service
- Exhibits182: Gandhar Oil Refinery India Ltd. - Key offerings
- Exhibits183: SWOT
- Exhibits184: Indian Oil Corp. Ltd. - Overview
- Exhibits185: Indian Oil Corp. Ltd. - Business segments
- Exhibits186: Indian Oil Corp. Ltd. - Key news
- Exhibits187: Indian Oil Corp. Ltd. - Key offerings
- Exhibits188: Indian Oil Corp. Ltd. - Segment focus
- Exhibits189: SWOT
- Exhibits190: MOTUL SA - Overview
- Exhibits191: MOTUL SA - Product / Service
- Exhibits192: MOTUL SA - Key offerings
- Exhibits193: SWOT
- Exhibits194: PETRONAS Chemicals Group Berhad - Overview
- Exhibits195: PETRONAS Chemicals Group Berhad - Business segments
- Exhibits196: PETRONAS Chemicals Group Berhad - Key offerings
- Exhibits197: PETRONAS Chemicals Group Berhad - Segment focus
- Exhibits198: SWOT
- Exhibits199: Prestone Products Corp. - Overview
- Exhibits200: Prestone Products Corp. - Product / Service
- Exhibits201: Prestone Products Corp. - Key offerings
- Exhibits202: SWOT
- Exhibits203: Recochem Inc. - Overview
- Exhibits204: Recochem Inc. - Product / Service
- Exhibits205: Recochem Inc. - Key offerings
- Exhibits206: SWOT
- Exhibits207: TotalEnergies SE - Overview
- Exhibits208: TotalEnergies SE - Business segments
- Exhibits209: TotalEnergies SE - Key news
- Exhibits210: TotalEnergies SE - Key offerings
- Exhibits211: TotalEnergies SE - Segment focus
- Exhibits212: SWOT
- Exhibits213: Valvoline Inc. - Overview
- Exhibits214: Valvoline Inc. - Product / Service
- Exhibits215: Valvoline Inc. - Key news
- Exhibits216: Valvoline Inc. - Key offerings
- Exhibits217: SWOT
- Exhibits218: Inclusions checklist
- Exhibits219: Exclusions checklist
- Exhibits220: Currency conversion rates for US$
- Exhibits221: Research methodology
- Exhibits222: Information sources
- Exhibits223: Data validation
- Exhibits224: Validation techniques employed for market sizing
- Exhibits225: Data synthesis
- Exhibits226: 360 degree market analysis
- Exhibits227: List of abbreviations
Automotive Coolant Market 2024-2028
The automotive coolant market is forecasted to grow by USD 1413.1 mn during 2023-2028, accelerating at a CAGR of 5.8% during the forecast period. The report on the automotive coolant market provides a holistic analysis, market size and forecast, trends, growth drivers, and challenges, as well as vendor analysis covering around 25 vendors.
The report offers an up-to-date analysis regarding the current market scenario, the latest trends and drivers, and the overall market environment. The market is driven by introduction of new products, innovations in product development, and growing demand for eco-friendly automotive coolants.
| Market Scope | |
|---|---|
| Base Year | 2024 |
| End Year | 2028 |
| Series Year | 2024-2028 |
| Growth Momentum | Accelerate |
| YOY 2024 | 5.3% |
| CAGR | 5.8% |
| Incremental Value | $1413.1 mn |
Technavio's automotive coolant market is segmented as below:
By Application
- Passenger cars
- M and HCV
- LCV
By End-user
- Aftermarket
- OEM
By Geographical Landscape
- APAC
- Europe
- North America
- Middle East and Africa
- South America
This study identifies the strategies for inorganic growth as one of the prime reasons driving the automotive coolant market growth during the next few years. Also, expansion of production capabilities and rising demand for automotive coolants in evs will lead to sizable demand in the market.
The report on the automotive coolant market covers the following areas:
- Automotive Coolant Market sizing
- Automotive Coolant Market forecast
- Automotive Coolant Market industry analysis
The robust vendor analysis is designed to help clients improve their market position, and in line with this, this report provides a detailed analysis of several leading automotive coolant market vendors that include American Manufacturing Co., AMSOIL Inc., BASF SE, Castrol Ltd., Chevron Corp., Cummins Inc., Engine Ice, Evans Cooling Systems Inc., Exxon Mobil Corp., FUCHS SE, Gandhar Oil Refinery India Ltd., Indian Oil Corp. Ltd., MOTUL SA, Old World Industries LLC, PETRONAS Chemicals Group Berhad, Prestone Products Corp., Recochem Inc., Royal Super, TotalEnergies SE, and Valvoline Inc.. Also, the automotive coolant market analysis report includes information on upcoming trends and challenges that will influence market growth. This is to help companies strategize and leverage all forthcoming growth opportunities.
The study was conducted using an objective combination of primary and secondary information including inputs from key participants in the industry. The report contains a comprehensive market and vendor landscape in addition to an analysis of the key vendors.
The publisher presents a detailed picture of the market by the way of study, synthesis, and summation of data from multiple sources by an analysis of key parameters such as profit, pricing, competition, and promotions. It presents various market facets by identifying the key industry influencers. The data presented is comprehensive, reliable, and a result of extensive primary and secondary research. The market research reports provide a complete competitive landscape and an in-depth vendor selection methodology and analysis using qualitative and quantitative research to forecast accurate market growth.
Table of Contents
1 Executive Summary
- 1.1 Market overview
- Executive Summary - Chart on Market Overview
- Executive Summary - Data Table on Market Overview
- Executive Summary - Chart on Global Market Characteristics
- Executive Summary - Chart on Market By Geographical Landscape
- Executive Summary - Chart on Market Segmentation by Application
- Executive Summary - Chart on Market Segmentation by End-user
- Executive Summary - Chart on Incremental Growth
- Executive Summary - Data Table on Incremental Growth
- Executive Summary - Chart on Company Market Positioning
2 Technavio Analysis
- 2.1 Analysis of price sensitivity, lifecycle, customer purchase basket, adoption rates, and purchase criteria
- Analysis of price sensitivity, lifecycle, customer purchase basket, adoption rates, and purchase criteria
- 2.2 Criticality of inputs and Factors of differentiation
- Overview on criticality of inputs and factors of differentiation
- 2.3 Factors of disruption
- Overview on factors of disruption
- 2.4 Impact of drivers and challenges
- Impact of drivers and challenges in 2023 and 2028
3 Market Landscape
- 3.1 Market ecosystem
- Parent Market
- Data Table on - Parent Market
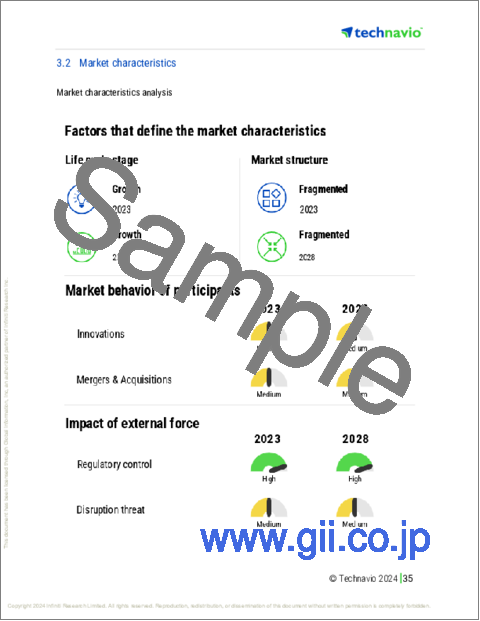
- 3.2 Market characteristics
- Market characteristics analysis
- 3.3 Value chain analysis
- Value Chain Analysis
4 Market Sizing
- 4.1 Market definition
- Offerings of companies included in the market definition
- 4.2 Market segment analysis
- Market segments
- 4.3 Market size 2023
- 4.4 Market outlook: Forecast for 2023-2028
- Chart on Global - Market size and forecast 2023-2028 ($ million)
- Data Table on Global - Market size and forecast 2023-2028 ($ million)
- Chart on Global Market: Year-over-year growth 2023-2028 (%)
- Data Table on Global Market: Year-over-year growth 2023-2028 (%)
5 Historic Market Size
- 5.1 Global Automotive Coolant Market 2018 - 2022
- Historic Market Size - Data Table on Global Automotive Coolant Market 2018 - 2022 ($ million)
- 5.2 Application segment analysis 2018 - 2022
- Historic Market Size - Application Segment 2018 - 2022 ($ million)
- 5.3 End-user segment analysis 2018 - 2022
- Historic Market Size - End-user Segment 2018 - 2022 ($ million)
- 5.4 Geography segment analysis 2018 - 2022
- Historic Market Size - Geography Segment 2018 - 2022 ($ million)
- 5.5 Country segment analysis 2018 - 2022
- Historic Market Size - Country Segment 2018 - 2022 ($ million)
6 Qualitative Analysis
- 6.1 Impact of AI on the Global Automotive Coolant Market
7 Five Forces Analysis
- 7.1 Five forces summary
- Five forces analysis - Comparison between 2023 and 2028
- 7.2 Bargaining power of buyers
- Bargaining power of buyers - Impact of key factors 2023 and 2028
- 7.3 Bargaining power of suppliers
- Bargaining power of suppliers - Impact of key factors in 2023 and 2028
- 7.4 Threat of new entrants
- Threat of new entrants - Impact of key factors in 2023 and 2028
- 7.5 Threat of substitutes
- Threat of substitutes - Impact of key factors in 2023 and 2028
- 7.6 Threat of rivalry
- Threat of rivalry - Impact of key factors in 2023 and 2028
- 7.7 Market condition
- Chart on Market condition - Five forces 2023 and 2028
8 Market Segmentation by Application
- 8.1 Market segments
- Chart on Application - Market share 2023-2028 (%)
- Data Table on Application - Market share 2023-2028 (%)
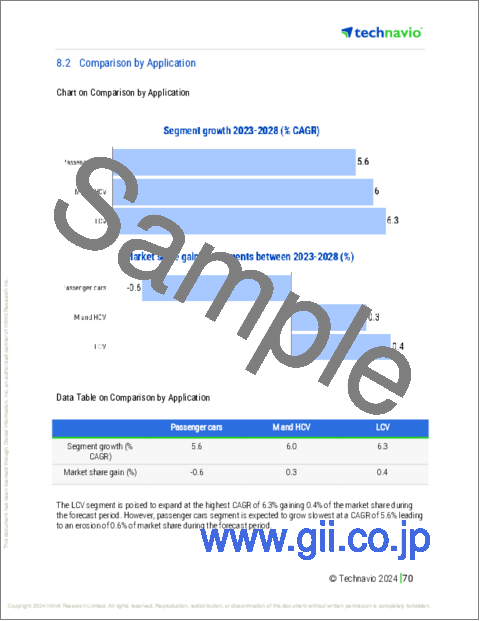
- 8.2 Comparison by Application
- Chart on Comparison by Application
- Data Table on Comparison by Application
- 8.3 Passenger cars - Market size and forecast 2023-2028
- Chart on Passenger cars - Market size and forecast 2023-2028 ($ million)
- Data Table on Passenger cars - Market size and forecast 2023-2028 ($ million)
- Chart on Passenger cars - Year-over-year growth 2023-2028 (%)
- Data Table on Passenger cars - Year-over-year growth 2023-2028 (%)
- 8.4 M and HCV - Market size and forecast 2023-2028
- Chart on M and HCV - Market size and forecast 2023-2028 ($ million)
- Data Table on M and HCV - Market size and forecast 2023-2028 ($ million)
- Chart on M and HCV - Year-over-year growth 2023-2028 (%)
- Data Table on M and HCV - Year-over-year growth 2023-2028 (%)
- 8.5 LCV - Market size and forecast 2023-2028
- Chart on LCV - Market size and forecast 2023-2028 ($ million)
- Data Table on LCV - Market size and forecast 2023-2028 ($ million)
- Chart on LCV - Year-over-year growth 2023-2028 (%)
- Data Table on LCV - Year-over-year growth 2023-2028 (%)
- 8.6 Market opportunity by Application
- Market opportunity by Application ($ million)
- Data Table on Market opportunity by Application ($ million)
9 Market Segmentation by End-user
- 9.1 Market segments
- Chart on End-user - Market share 2023-2028 (%)
- Data Table on End-user - Market share 2023-2028 (%)
- 9.2 Comparison by End-user
- Chart on Comparison by End-user
- Data Table on Comparison by End-user
- 9.3 Aftermarket - Market size and forecast 2023-2028
- Chart on Aftermarket - Market size and forecast 2023-2028 ($ million)
- Data Table on Aftermarket - Market size and forecast 2023-2028 ($ million)
- Chart on Aftermarket - Year-over-year growth 2023-2028 (%)
- Data Table on Aftermarket - Year-over-year growth 2023-2028 (%)
- 9.4 OEM - Market size and forecast 2023-2028
- Chart on OEM - Market size and forecast 2023-2028 ($ million)
- Data Table on OEM - Market size and forecast 2023-2028 ($ million)
- Chart on OEM - Year-over-year growth 2023-2028 (%)
- Data Table on OEM - Year-over-year growth 2023-2028 (%)
- 9.5 Market opportunity by End-user
- Market opportunity by End-user ($ million)
- Data Table on Market opportunity by End-user ($ million)
10 Customer Landscape
- 10.1 Customer landscape overview
- Analysis of price sensitivity, lifecycle, customer purchase basket, adoption rates, and purchase criteria
11 Geographic Landscape
- 11.1 Geographic segmentation
- Chart on Market share By Geographical Landscape 2023-2028 (%)
- Data Table on Market share By Geographical Landscape 2023-2028 (%)
- 11.2 Geographic comparison
- Chart on Geographic comparison
- Data Table on Geographic comparison
- 11.3 APAC - Market size and forecast 2023-2028
- Chart on APAC - Market size and forecast 2023-2028 ($ million)
- Data Table on APAC - Market size and forecast 2023-2028 ($ million)
- Chart on APAC - Year-over-year growth 2023-2028 (%)
- Data Table on APAC - Year-over-year growth 2023-2028 (%)
- 11.4 Europe - Market size and forecast 2023-2028
- Chart on Europe - Market size and forecast 2023-2028 ($ million)
- Data Table on Europe - Market size and forecast 2023-2028 ($ million)
- Chart on Europe - Year-over-year growth 2023-2028 (%)
- Data Table on Europe - Year-over-year growth 2023-2028 (%)
- 11.5 North America - Market size and forecast 2023-2028
- Chart on North America - Market size and forecast 2023-2028 ($ million)
- Data Table on North America - Market size and forecast 2023-2028 ($ million)
- Chart on North America - Year-over-year growth 2023-2028 (%)
- Data Table on North America - Year-over-year growth 2023-2028 (%)
- 11.6 Middle East and Africa - Market size and forecast 2023-2028
- Chart on Middle East and Africa - Market size and forecast 2023-2028 ($ million)
- Data Table on Middle East and Africa - Market size and forecast 2023-2028 ($ million)
- Chart on Middle East and Africa - Year-over-year growth 2023-2028 (%)
- Data Table on Middle East and Africa - Year-over-year growth 2023-2028 (%)
- 11.7 South America - Market size and forecast 2023-2028
- Chart on South America - Market size and forecast 2023-2028 ($ million)
- Data Table on South America - Market size and forecast 2023-2028 ($ million)
- Chart on South America - Year-over-year growth 2023-2028 (%)
- Data Table on South America - Year-over-year growth 2023-2028 (%)
- 11.8 China - Market size and forecast 2023-2028
- Chart on China - Market size and forecast 2023-2028 ($ million)
- Data Table on China - Market size and forecast 2023-2028 ($ million)
- Chart on China - Year-over-year growth 2023-2028 (%)
- Data Table on China - Year-over-year growth 2023-2028 (%)
- 11.9 US - Market size and forecast 2023-2028
- Chart on US - Market size and forecast 2023-2028 ($ million)
- Data Table on US - Market size and forecast 2023-2028 ($ million)
- Chart on US - Year-over-year growth 2023-2028 (%)
- Data Table on US - Year-over-year growth 2023-2028 (%)
- 11.10 India - Market size and forecast 2023-2028
- Chart on India - Market size and forecast 2023-2028 ($ million)
- Data Table on India - Market size and forecast 2023-2028 ($ million)
- Chart on India - Year-over-year growth 2023-2028 (%)
- Data Table on India - Year-over-year growth 2023-2028 (%)
- 11.11 Japan - Market size and forecast 2023-2028
- Chart on Japan - Market size and forecast 2023-2028 ($ million)
- Data Table on Japan - Market size and forecast 2023-2028 ($ million)
- Chart on Japan - Year-over-year growth 2023-2028 (%)
- Data Table on Japan - Year-over-year growth 2023-2028 (%)
- 11.12 South Korea - Market size and forecast 2023-2028
- Chart on South Korea - Market size and forecast 2023-2028 ($ million)
- Data Table on South Korea - Market size and forecast 2023-2028 ($ million)
- Chart on South Korea - Year-over-year growth 2023-2028 (%)
- Data Table on South Korea - Year-over-year growth 2023-2028 (%)
- 11.13 Brazil - Market size and forecast 2023-2028
- Chart on Brazil - Market size and forecast 2023-2028 ($ million)
- Data Table on Brazil - Market size and forecast 2023-2028 ($ million)
- Chart on Brazil - Year-over-year growth 2023-2028 (%)
- Data Table on Brazil - Year-over-year growth 2023-2028 (%)
- 11.14 Germany - Market size and forecast 2023-2028
- Chart on Germany - Market size and forecast 2023-2028 ($ million)
- Data Table on Germany - Market size and forecast 2023-2028 ($ million)
- Chart on Germany - Year-over-year growth 2023-2028 (%)
- Data Table on Germany - Year-over-year growth 2023-2028 (%)
- 11.15 UK - Market size and forecast 2023-2028
- Chart on UK - Market size and forecast 2023-2028 ($ million)
- Data Table on UK - Market size and forecast 2023-2028 ($ million)
- Chart on UK - Year-over-year growth 2023-2028 (%)
- Data Table on UK - Year-over-year growth 2023-2028 (%)
- 11.16 France - Market size and forecast 2023-2028
- Chart on France - Market size and forecast 2023-2028 ($ million)
- Data Table on France - Market size and forecast 2023-2028 ($ million)
- Chart on France - Year-over-year growth 2023-2028 (%)
- Data Table on France - Year-over-year growth 2023-2028 (%)
- 11.17 Russia - Market size and forecast 2023-2028
- Chart on Russia - Market size and forecast 2023-2028 ($ million)
- Data Table on Russia - Market size and forecast 2023-2028 ($ million)
- Chart on Russia - Year-over-year growth 2023-2028 (%)
- Data Table on Russia - Year-over-year growth 2023-2028 (%)
- 11.18 Market opportunity By Geographical Landscape
- Market opportunity By Geographical Landscape ($ million)
- Data Tables on Market opportunity By Geographical Landscape ($ million)
12 Drivers, Challenges, and Opportunity/Restraints
- 12.1 Market drivers
- 12.2 Market challenges
- 12.3 Impact of drivers and challenges
- Impact of drivers and challenges in 2023 and 2028
- 12.4 Market opportunities/restraints
13 Competitive Landscape
- 13.1 Overview
- 13.2 Competitive Landscape
- Overview on criticality of inputs and factors of differentiation
- 13.3 Landscape disruption
- Overview on factors of disruption
- 13.4 Industry risks
- Impact of key risks on business
14 Competitive Analysis
- 14.1 Companies profiled
- Companies covered
- 14.2 Company ranking index
- Company ranking index
- 14.3 Market positioning of companies
- Matrix on companies position and classification
- 14.4 AMSOIL Inc.
- AMSOIL Inc. - Overview
- AMSOIL Inc. - Product / Service
- AMSOIL Inc. - Key offerings
- SWOT
- 14.5 BASF SE
- BASF SE - Overview
- BASF SE - Business segments
- BASF SE - Key news
- BASF SE - Key offerings
- BASF SE - Segment focus
- SWOT
- 14.6 Castrol Ltd.
- Castrol Ltd. - Overview
- Castrol Ltd. - Product / Service
- Castrol Ltd. - Key offerings
- SWOT
- 14.7 Chevron Corp.
- Chevron Corp. - Overview
- Chevron Corp. - Business segments
- Chevron Corp. - Key news
- Chevron Corp. - Key offerings
- Chevron Corp. - Segment focus
- SWOT
- 14.8 Cummins Inc.
- Cummins Inc. - Overview
- Cummins Inc. - Business segments
- Cummins Inc. - Key news
- Cummins Inc. - Key offerings
- Cummins Inc. - Segment focus
- SWOT
- 14.9 Exxon Mobil Corp.
- Exxon Mobil Corp. - Overview
- Exxon Mobil Corp. - Business segments
- Exxon Mobil Corp. - Key news
- Exxon Mobil Corp. - Key offerings
- Exxon Mobil Corp. - Segment focus
- SWOT
- 14.10 FUCHS SE
- FUCHS SE - Overview
- FUCHS SE - Business segments
- FUCHS SE - Key news
- FUCHS SE - Key offerings
- FUCHS SE - Segment focus
- SWOT
- 14.11 Gandhar Oil Refinery India Ltd.
- Gandhar Oil Refinery India Ltd. - Overview
- Gandhar Oil Refinery India Ltd. - Product / Service
- Gandhar Oil Refinery India Ltd. - Key offerings
- SWOT
- 14.12 Indian Oil Corp. Ltd.
- Indian Oil Corp. Ltd. - Overview
- Indian Oil Corp. Ltd. - Business segments
- Indian Oil Corp. Ltd. - Key news
- Indian Oil Corp. Ltd. - Key offerings
- Indian Oil Corp. Ltd. - Segment focus
- SWOT
- 14.13 MOTUL SA
- MOTUL SA - Overview
- MOTUL SA - Product / Service
- MOTUL SA - Key offerings
- SWOT
- 14.14 PETRONAS Chemicals Group Berhad
- PETRONAS Chemicals Group Berhad - Overview
- PETRONAS Chemicals Group Berhad - Business segments
- PETRONAS Chemicals Group Berhad - Key offerings
- PETRONAS Chemicals Group Berhad - Segment focus
- SWOT
- 14.15 Prestone Products Corp.
- Prestone Products Corp. - Overview
- Prestone Products Corp. - Product / Service
- Prestone Products Corp. - Key offerings
- SWOT
- 14.16 Recochem Inc.
- Recochem Inc. - Overview
- Recochem Inc. - Product / Service
- Recochem Inc. - Key offerings
- SWOT
- 14.17 TotalEnergies SE
- TotalEnergies SE - Overview
- TotalEnergies SE - Business segments
- TotalEnergies SE - Key news
- TotalEnergies SE - Key offerings
- TotalEnergies SE - Segment focus
- SWOT
- 14.18 Valvoline Inc.
- Valvoline Inc. - Overview
- Valvoline Inc. - Product / Service
- Valvoline Inc. - Key news
- Valvoline Inc. - Key offerings
- SWOT
15 Appendix
- 15.1 Scope of the report
- 15.2 Inclusions and exclusions checklist
- Inclusions checklist
- Exclusions checklist
- 15.3 Currency conversion rates for US$
- Currency conversion rates for US$
- 15.4 Research methodology
- Research methodology
- 15.5 Data procurement
- Information sources
- 15.6 Data validation
- Data validation
- 15.7 Validation techniques employed for market sizing
- Validation techniques employed for market sizing
- 15.8 Data synthesis
- Data synthesis
- 15.9 360 degree market analysis
- 360 degree market analysis
- 15.10 List of abbreviations
- List of abbreviations

