|
|
市場調査レポート
商品コード
1604072
歯周病歯科サービスの世界市場 2024年~2028年Global Periodontal Dental Services Market 2024-2028 |
||||||

|
|||||||
カスタマイズ可能
|
|||||||

| 歯周病歯科サービスの世界市場 2024年~2028年 |
|
出版日: 2024年10月19日
発行: TechNavio
ページ情報: 英文 149 Pages
納期: 即納可能
|

全表示
- 概要
- 図表
- 目次
歯周病歯科サービス市場2024-2028
歯周病歯科サービス市場は2023年~2028年年に109億米ドル、予測期間中のCAGRは9.9%で成長すると予測されます。当レポートでは、歯周病歯科サービス市場の全体的な分析、市場規模・予測、動向、成長促進要因、課題、約25のベンダーを網羅したベンダー分析などを掲載しています。
現在の市場シナリオ、最新動向と促進要因、市場環境全体に関する最新分析を提供しています。市場は、歯周病有病率の上昇、歯周病学におけるレーザー治療の導入、歯周病サービスを向上させるための先端技術の使用によって牽引されています。
| 市場範囲 | |
|---|---|
| 基準年 | 2024 |
| 終了年 | 2028 |
| 予測期間 | 2024-2028 |
| 成長モメンタム | 加速 |
| 前年比2024年 | 8.9% |
| CAGR | 9.9% |
| 増分額 | 109億米ドル |
本調査では、今後数年間の歯周病歯科サービス市場成長を牽引する主な要因の1つとして、サービスコスト削減を目的とした歯科医療機関と保険プロバイダーとの連携を挙げています。また、非外科的歯周病サービスに対する払い戻しや医療ツーリズムの人気の高まりは、市場の大きな需要につながると思われます。
目次
第1章 エグゼクティブサマリー
- 市場概要
第2章 市場情勢
- 市場エコシステム
- 市場の特徴
- バリューチェーン分析
第3章 市場規模
- 市場の定義
- 市場セグメント分析
- 市場規模 2023年
- 市場の見通し 2023年~2028年
第4章 市場規模実績
- 歯周病歯科サービスの世界市場 2018年~2022年
- エンドユーザー別セグメント分析 2018年~2022年
- サービス別セグメント分析 2018年~2022年
- 地域別セグメント分析 2018年~2022年
- 国別セグメント分析 2018年~2022年
第5章 ファイブフォース分析
- ファイブフォースの要約
- 買い手の交渉力
- 供給企業の交渉力
- 新規参入業者の脅威
- 代替品の脅威
- 競争の脅威
- 市況
第6章 市場セグメンテーション:エンドユーザー別
- 市場セグメント
- 比較:エンドユーザー別
- 病院:市場規模と予測 2023年~2028年
- 歯科医院:市場規模と予測 2023年~2028年
- 市場機会:エンドユーザー別
第7章 市場セグメンテーション:サービス別
- 市場セグメント
- 比較:サービス別
- 非外科的:市場規模と予測 2023年~2028年
- 外科手術:市場規模と予測 2023年~2028年
- 市場機会:サービス別
第8章 顧客情勢
- 顧客情勢の概要
第9章 地域別情勢
- 地域別セグメンテーション
- 地域別比較
- 北米:市場規模と予測 2023年~2028年
- 欧州:市場規模と予測 2023年~2028年
- アジア:市場規模と予測 2023年~2028年
- 世界のその他の地域:市場規模と予測 2023年~2028年
- 米国:市場規模と予測 2023年~2028年
- 英国:市場規模と予測 2023年~2028年
- ドイツ:市場規模と予測 2023年~2028年
- 中国:市場規模と予測 2023年~2028年
- カナダ:市場規模と予測 2023年~2028年
- 市場機会:地域情勢別
第10章 促進要因・課題・機会・抑制要因
- 市場促進要因
- 市場の課題
- 促進要因と課題の影響
- 市場の機会・抑制要因
第11章 競合情勢
- 概要
- 競合情勢
- 混乱の状況
- 業界のリスク
第12章 競合分析
- 企業プロファイル
- 企業の市場ポジショニング
- Apollo Hospitals Enterprise Ltd
- Aspen Dental Management Inc.
- Birmingham Periodontal and Implant Centre Ltd.
- Burlingame Dental Arts
- Coast Dental Services LLC
- Medtronic Plc
- Pacific Dental Services LLC
- Q and M Dental Group Singapore Ltd.
- Sun Lakes Dental
第13章 付録
Exhibits:
- Exhibits1: Executive Summary - Chart on Market Overview
- Exhibits2: Executive Summary - Data Table on Market Overview
- Exhibits3: Executive Summary - Chart on Global Market Characteristics
- Exhibits4: Executive Summary - Chart on Market By Geographical Landscape
- Exhibits5: Executive Summary - Chart on Market Segmentation by End-user
- Exhibits6: Executive Summary - Chart on Market Segmentation by Service
- Exhibits7: Executive Summary - Chart on Incremental Growth
- Exhibits8: Executive Summary - Data Table on Incremental Growth
- Exhibits9: Executive Summary - Chart on Company Market Positioning
- Exhibits10: Parent Market
- Exhibits11: Data Table on - Parent Market
- Exhibits12: Market characteristics analysis
- Exhibits13: Value Chain Analysis
- Exhibits14: Offerings of companies included in the market definition
- Exhibits15: Market segments
- Exhibits16: Chart on Global - Market size and forecast 2023-2028 ($ million)
- Exhibits17: Data Table on Global - Market size and forecast 2023-2028 ($ million)
- Exhibits18: Chart on Global Market: Year-over-year growth 2023-2028 (%)
- Exhibits19: Data Table on Global Market: Year-over-year growth 2023-2028 (%)
- Exhibits20: Historic Market Size - Data Table on Global Periodontal Dental Services Market 2018 - 2022 ($ million)
- Exhibits21: Historic Market Size - End-user Segment 2018 - 2022 ($ million)
- Exhibits22: Historic Market Size - Service Segment 2018 - 2022 ($ million)
- Exhibits23: Historic Market Size - Geography Segment 2018 - 2022 ($ million)
- Exhibits24: Historic Market Size - Country Segment 2018 - 2022 ($ million)
- Exhibits25: Five forces analysis - Comparison between 2023 and 2028
- Exhibits26: Bargaining power of buyers - Impact of key factors 2023 and 2028
- Exhibits27: Bargaining power of suppliers - Impact of key factors in 2023 and 2028
- Exhibits28: Threat of new entrants - Impact of key factors in 2023 and 2028
- Exhibits29: Threat of substitutes - Impact of key factors in 2023 and 2028
- Exhibits30: Threat of rivalry - Impact of key factors in 2023 and 2028
- Exhibits31: Chart on Market condition - Five forces 2023 and 2028
- Exhibits32: Chart on End-user - Market share 2023-2028 (%)
- Exhibits33: Data Table on End-user - Market share 2023-2028 (%)
- Exhibits34: Chart on Comparison by End-user
- Exhibits35: Data Table on Comparison by End-user
- Exhibits36: Chart on Hospitals - Market size and forecast 2023-2028 ($ million)
- Exhibits37: Data Table on Hospitals - Market size and forecast 2023-2028 ($ million)
- Exhibits38: Chart on Hospitals - Year-over-year growth 2023-2028 (%)
- Exhibits39: Data Table on Hospitals - Year-over-year growth 2023-2028 (%)
- Exhibits40: Chart on Dental clinics - Market size and forecast 2023-2028 ($ million)
- Exhibits41: Data Table on Dental clinics - Market size and forecast 2023-2028 ($ million)
- Exhibits42: Chart on Dental clinics - Year-over-year growth 2023-2028 (%)
- Exhibits43: Data Table on Dental clinics - Year-over-year growth 2023-2028 (%)
- Exhibits44: Market opportunity by End-user ($ million)
- Exhibits45: Data Table on Market opportunity by End-user ($ million)
- Exhibits46: Chart on Service - Market share 2023-2028 (%)
- Exhibits47: Data Table on Service - Market share 2023-2028 (%)
- Exhibits48: Chart on Comparison by Service
- Exhibits49: Data Table on Comparison by Service
- Exhibits50: Chart on Non-surgical - Market size and forecast 2023-2028 ($ million)
- Exhibits51: Data Table on Non-surgical - Market size and forecast 2023-2028 ($ million)
- Exhibits52: Chart on Non-surgical - Year-over-year growth 2023-2028 (%)
- Exhibits53: Data Table on Non-surgical - Year-over-year growth 2023-2028 (%)
- Exhibits54: Chart on Surgical - Market size and forecast 2023-2028 ($ million)
- Exhibits55: Data Table on Surgical - Market size and forecast 2023-2028 ($ million)
- Exhibits56: Chart on Surgical - Year-over-year growth 2023-2028 (%)
- Exhibits57: Data Table on Surgical - Year-over-year growth 2023-2028 (%)
- Exhibits58: Market opportunity by Service ($ million)
- Exhibits59: Data Table on Market opportunity by Service ($ million)
- Exhibits60: Analysis of price sensitivity, lifecycle, customer purchase basket, adoption rates, and purchase criteria
- Exhibits61: Chart on Market share By Geographical Landscape 2023-2028 (%)
- Exhibits62: Data Table on Market share By Geographical Landscape 2023-2028 (%)
- Exhibits63: Chart on Geographic comparison
- Exhibits64: Data Table on Geographic comparison
- Exhibits65: Chart on North America - Market size and forecast 2023-2028 ($ million)
- Exhibits66: Data Table on North America - Market size and forecast 2023-2028 ($ million)
- Exhibits67: Chart on North America - Year-over-year growth 2023-2028 (%)
- Exhibits68: Data Table on North America - Year-over-year growth 2023-2028 (%)
- Exhibits69: Chart on Europe - Market size and forecast 2023-2028 ($ million)
- Exhibits70: Data Table on Europe - Market size and forecast 2023-2028 ($ million)
- Exhibits71: Chart on Europe - Year-over-year growth 2023-2028 (%)
- Exhibits72: Data Table on Europe - Year-over-year growth 2023-2028 (%)
- Exhibits73: Chart on Asia - Market size and forecast 2023-2028 ($ million)
- Exhibits74: Data Table on Asia - Market size and forecast 2023-2028 ($ million)
- Exhibits75: Chart on Asia - Year-over-year growth 2023-2028 (%)
- Exhibits76: Data Table on Asia - Year-over-year growth 2023-2028 (%)
- Exhibits77: Chart on Rest of World (ROW) - Market size and forecast 2023-2028 ($ million)
- Exhibits78: Data Table on Rest of World (ROW) - Market size and forecast 2023-2028 ($ million)
- Exhibits79: Chart on Rest of World (ROW) - Year-over-year growth 2023-2028 (%)
- Exhibits80: Data Table on Rest of World (ROW) - Year-over-year growth 2023-2028 (%)
- Exhibits81: Chart on US - Market size and forecast 2023-2028 ($ million)
- Exhibits82: Data Table on US - Market size and forecast 2023-2028 ($ million)
- Exhibits83: Chart on US - Year-over-year growth 2023-2028 (%)
- Exhibits84: Data Table on US - Year-over-year growth 2023-2028 (%)
- Exhibits85: Chart on UK - Market size and forecast 2023-2028 ($ million)
- Exhibits86: Data Table on UK - Market size and forecast 2023-2028 ($ million)
- Exhibits87: Chart on UK - Year-over-year growth 2023-2028 (%)
- Exhibits88: Data Table on UK - Year-over-year growth 2023-2028 (%)
- Exhibits89: Chart on Germany - Market size and forecast 2023-2028 ($ million)
- Exhibits90: Data Table on Germany - Market size and forecast 2023-2028 ($ million)
- Exhibits91: Chart on Germany - Year-over-year growth 2023-2028 (%)
- Exhibits92: Data Table on Germany - Year-over-year growth 2023-2028 (%)
- Exhibits93: Chart on China - Market size and forecast 2023-2028 ($ million)
- Exhibits94: Data Table on China - Market size and forecast 2023-2028 ($ million)
- Exhibits95: Chart on China - Year-over-year growth 2023-2028 (%)
- Exhibits96: Data Table on China - Year-over-year growth 2023-2028 (%)
- Exhibits97: Chart on Canada - Market size and forecast 2023-2028 ($ million)
- Exhibits98: Data Table on Canada - Market size and forecast 2023-2028 ($ million)
- Exhibits99: Chart on Canada - Year-over-year growth 2023-2028 (%)
- Exhibits100: Data Table on Canada - Year-over-year growth 2023-2028 (%)
- Exhibits101: Market opportunity By Geographical Landscape ($ million)
- Exhibits102: Data Tables on Market opportunity By Geographical Landscape ($ million)
- Exhibits103: Impact of drivers and challenges in 2023 and 2028
- Exhibits104: Overview on criticality of inputs and factors of differentiation
- Exhibits105: Overview on factors of disruption
- Exhibits106: Impact of key risks on business
- Exhibits107: Companies covered
- Exhibits108: Matrix on companies position and classification
- Exhibits109: 123Dentist Inc. - Overview
- Exhibits110: 123Dentist Inc. - Product / Service
- Exhibits111: 123Dentist Inc. - Key offerings
- Exhibits112: Apollo Hospitals Enterprise Ltd - Overview
- Exhibits113: Apollo Hospitals Enterprise Ltd - Business segments
- Exhibits114: Apollo Hospitals Enterprise Ltd - Key news
- Exhibits115: Apollo Hospitals Enterprise Ltd - Key offerings
- Exhibits116: Apollo Hospitals Enterprise Ltd - Segment focus
- Exhibits117: Aspen Dental Management Inc. - Overview
- Exhibits118: Aspen Dental Management Inc. - Product / Service
- Exhibits119: Aspen Dental Management Inc. - Key offerings
- Exhibits120: Birmingham Periodontal and Implant Centre Ltd. - Overview
- Exhibits121: Birmingham Periodontal and Implant Centre Ltd. - Product / Service
- Exhibits122: Birmingham Periodontal and Implant Centre Ltd. - Key offerings
- Exhibits123: Burlingame Dental Arts - Overview
- Exhibits124: Burlingame Dental Arts - Product / Service
- Exhibits125: Burlingame Dental Arts - Key offerings
- Exhibits126: Coast Dental Services LLC - Overview
- Exhibits127: Coast Dental Services LLC - Product / Service
- Exhibits128: Coast Dental Services LLC - Key offerings
- Exhibits129: Medtronic Plc - Overview
- Exhibits130: Medtronic Plc - Business segments
- Exhibits131: Medtronic Plc - Key news
- Exhibits132: Medtronic Plc - Key offerings
- Exhibits133: Medtronic Plc - Segment focus
- Exhibits134: Pacific Dental Services LLC - Overview
- Exhibits135: Pacific Dental Services LLC - Product / Service
- Exhibits136: Pacific Dental Services LLC - Key offerings
- Exhibits137: Q and M Dental Group Singapore Ltd. - Overview
- Exhibits138: Q and M Dental Group Singapore Ltd. - Product / Service
- Exhibits139: Q and M Dental Group Singapore Ltd. - Key offerings
- Exhibits140: Sun Lakes Dental - Overview
- Exhibits141: Sun Lakes Dental - Product / Service
- Exhibits142: Sun Lakes Dental - Key offerings
- Exhibits143: Inclusions checklist
- Exhibits144: Exclusions checklist
- Exhibits145: Currency conversion rates for US$
- Exhibits146: Research methodology
- Exhibits147: Information sources
- Exhibits148: Data validation
- Exhibits149: Validation techniques employed for market sizing
- Exhibits150: Data synthesis
- Exhibits151: 360 degree market analysis
- Exhibits152: List of abbreviations
Periodontal Dental Services Market 2024-2028
The periodontal dental services market is forecasted to grow by USD 10900 mn during 2023-2028, accelerating at a CAGR of 9.9% during the forecast period. The report on the periodontal dental services market provides a holistic analysis, market size and forecast, trends, growth drivers, and challenges, as well as vendor analysis covering around 25 vendors.
The report offers an up-to-date analysis regarding the current market scenario, the latest trends and drivers, and the overall market environment. The market is driven by rise in prevalence of periodontal diseases, incorporation of laser therapy in periodontics, and use of advanced technology to improve periodontal services.
| Market Scope | |
|---|---|
| Base Year | 2024 |
| End Year | 2028 |
| Series Year | 2024-2028 |
| Growth Momentum | Accelerate |
| YOY 2024 | 8.9% |
| CAGR | 9.9% |
| Incremental Value | $10900 mn |
Technavio's periodontal dental services market is segmented as below:
By End-user
- Hospitals
- Dental clinics
By Service
- Non-surgical
- Surgical
By Geographical Landscape
- North America
- Europe
- Asia
- Rest of World (ROW)
This study identifies the collaboration between dental care organizations and insurance providers to reduce service costs as one of the prime reasons driving the periodontal dental services market growth during the next few years. Also, reimbursement for non-surgical periodontal services and growing popularity of medical tourism will lead to sizable demand in the market.
The report on the periodontal dental services market covers the following areas:
- Periodontal Dental Services Market sizing
- Periodontal Dental Services Market forecast
- Periodontal Dental Services Market industry analysis
The robust vendor analysis is designed to help clients improve their market position, and in line with this, this report provides a detailed analysis of several leading periodontal dental services market vendors that include 123Dentist Inc., 42 NORTH DENTAL, Apollo Hospitals Enterprise Ltd, Aspen Dental Management Inc., Birmingham Periodontal and Implant Centre Ltd., Brighton Dental Group PLLC, Burlingame Dental Arts, Coast Dental Services LLC, Highland Dental Care, Integrated Dental Holdings, Lenga Perio, Medtronic Plc, Pacific Dental Services LLC, PKWY Dental Specialist Practice, Prevention and Health Services Srl, Q and M Dental Group Singapore Ltd., St. Helena Dental Studio services, St. Marys Dental, Sun Lakes Dental, and The Dentists at 650 Heights. Also, the periodontal dental services market analysis report includes information on upcoming trends and challenges that will influence market growth. This is to help companies strategize and leverage all forthcoming growth opportunities.
The study was conducted using an objective combination of primary and secondary information including inputs from key participants in the industry. The report contains a comprehensive market and vendor landscape in addition to an analysis of the key vendors.
The publisher presents a detailed picture of the market by the way of study, synthesis, and summation of data from multiple sources by an analysis of key parameters such as profit, pricing, competition, and promotions. It presents various market facets by identifying the key industry influencers. The data presented is comprehensive, reliable, and a result of extensive primary and secondary research. The market research reports provide a complete competitive landscape and an in-depth vendor selection methodology and analysis using qualitative and quantitative research to forecast accurate market growth.
Table of Contents
1 Executive Summary
- 1.1 Market overview
- Executive Summary - Chart on Market Overview
- Executive Summary - Data Table on Market Overview
- Executive Summary - Chart on Global Market Characteristics
- Executive Summary - Chart on Market By Geographical Landscape
- Executive Summary - Chart on Market Segmentation by End-user
- Executive Summary - Chart on Market Segmentation by Service
- Executive Summary - Chart on Incremental Growth
- Executive Summary - Data Table on Incremental Growth
- Executive Summary - Chart on Company Market Positioning
2 Market Landscape
- 2.1 Market ecosystem
- Parent Market
- Data Table on - Parent Market
- 2.2 Market characteristics
- Market characteristics analysis
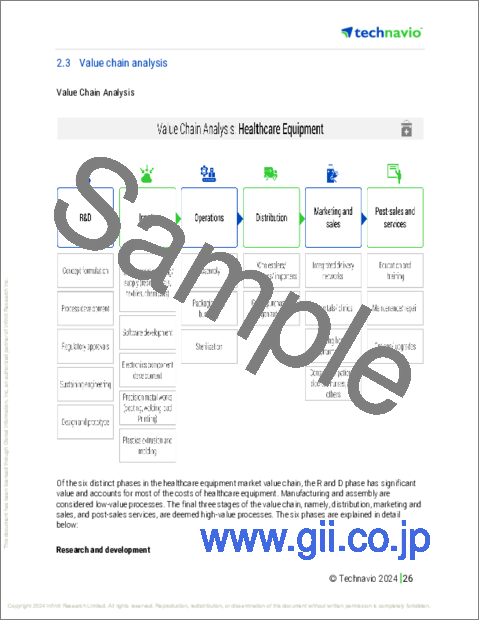
- 2.3 Value chain analysis
- Value Chain Analysis
3 Market Sizing
- 3.1 Market definition
- Offerings of companies included in the market definition
- 3.2 Market segment analysis
- Market segments
- 3.3 Market size 2023
- 3.4 Market outlook: Forecast for 2023-2028
- Chart on Global - Market size and forecast 2023-2028 ($ million)
- Data Table on Global - Market size and forecast 2023-2028 ($ million)
- Chart on Global Market: Year-over-year growth 2023-2028 (%)
- Data Table on Global Market: Year-over-year growth 2023-2028 (%)
4 Historic Market Size
- 4.1 Global Periodontal Dental Services Market 2018 - 2022
- Historic Market Size - Data Table on Global Periodontal Dental Services Market 2018 - 2022 ($ million)
- 4.2 End-user segment analysis 2018 - 2022
- Historic Market Size - End-user Segment 2018 - 2022 ($ million)
- 4.3 Service segment analysis 2018 - 2022
- Historic Market Size - Service Segment 2018 - 2022 ($ million)
- 4.4 Geography segment analysis 2018 - 2022
- Historic Market Size - Geography Segment 2018 - 2022 ($ million)
- 4.5 Country segment analysis 2018 - 2022
- Historic Market Size - Country Segment 2018 - 2022 ($ million)
5 Five Forces Analysis
- 5.1 Five forces summary
- Five forces analysis - Comparison between 2023 and 2028
- 5.2 Bargaining power of buyers
- Bargaining power of buyers - Impact of key factors 2023 and 2028
- 5.3 Bargaining power of suppliers
- Bargaining power of suppliers - Impact of key factors in 2023 and 2028
- 5.4 Threat of new entrants
- Threat of new entrants - Impact of key factors in 2023 and 2028
- 5.5 Threat of substitutes
- Threat of substitutes - Impact of key factors in 2023 and 2028
- 5.6 Threat of rivalry
- Threat of rivalry - Impact of key factors in 2023 and 2028
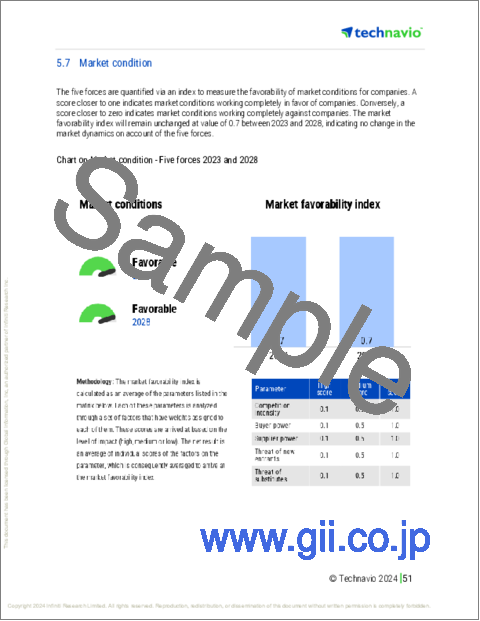
- 5.7 Market condition
- Chart on Market condition - Five forces 2023 and 2028
6 Market Segmentation by End-user
- 6.1 Market segments
- Chart on End-user - Market share 2023-2028 (%)
- Data Table on End-user - Market share 2023-2028 (%)
- 6.2 Comparison by End-user
- Chart on Comparison by End-user
- Data Table on Comparison by End-user
- 6.3 Hospitals - Market size and forecast 2023-2028
- Chart on Hospitals - Market size and forecast 2023-2028 ($ million)
- Data Table on Hospitals - Market size and forecast 2023-2028 ($ million)
- Chart on Hospitals - Year-over-year growth 2023-2028 (%)
- Data Table on Hospitals - Year-over-year growth 2023-2028 (%)
- 6.4 Dental clinics - Market size and forecast 2023-2028
- Chart on Dental clinics - Market size and forecast 2023-2028 ($ million)
- Data Table on Dental clinics - Market size and forecast 2023-2028 ($ million)
- Chart on Dental clinics - Year-over-year growth 2023-2028 (%)
- Data Table on Dental clinics - Year-over-year growth 2023-2028 (%)
- 6.5 Market opportunity by End-user
- Market opportunity by End-user ($ million)
- Data Table on Market opportunity by End-user ($ million)
7 Market Segmentation by Service
- 7.1 Market segments
- Chart on Service - Market share 2023-2028 (%)
- Data Table on Service - Market share 2023-2028 (%)
- 7.2 Comparison by Service
- Chart on Comparison by Service
- Data Table on Comparison by Service
- 7.3 Non-surgical - Market size and forecast 2023-2028
- Chart on Non-surgical - Market size and forecast 2023-2028 ($ million)
- Data Table on Non-surgical - Market size and forecast 2023-2028 ($ million)
- Chart on Non-surgical - Year-over-year growth 2023-2028 (%)
- Data Table on Non-surgical - Year-over-year growth 2023-2028 (%)
- 7.4 Surgical - Market size and forecast 2023-2028
- Chart on Surgical - Market size and forecast 2023-2028 ($ million)
- Data Table on Surgical - Market size and forecast 2023-2028 ($ million)
- Chart on Surgical - Year-over-year growth 2023-2028 (%)
- Data Table on Surgical - Year-over-year growth 2023-2028 (%)
- 7.5 Market opportunity by Service
- Market opportunity by Service ($ million)
- Data Table on Market opportunity by Service ($ million)
8 Customer Landscape
- 8.1 Customer landscape overview
- Analysis of price sensitivity, lifecycle, customer purchase basket, adoption rates, and purchase criteria
9 Geographic Landscape
- 9.1 Geographic segmentation
- Chart on Market share By Geographical Landscape 2023-2028 (%)
- Data Table on Market share By Geographical Landscape 2023-2028 (%)
- 9.2 Geographic comparison
- Chart on Geographic comparison
- Data Table on Geographic comparison
- 9.3 North America - Market size and forecast 2023-2028
- Chart on North America - Market size and forecast 2023-2028 ($ million)
- Data Table on North America - Market size and forecast 2023-2028 ($ million)
- Chart on North America - Year-over-year growth 2023-2028 (%)
- Data Table on North America - Year-over-year growth 2023-2028 (%)
- 9.4 Europe - Market size and forecast 2023-2028
- Chart on Europe - Market size and forecast 2023-2028 ($ million)
- Data Table on Europe - Market size and forecast 2023-2028 ($ million)
- Chart on Europe - Year-over-year growth 2023-2028 (%)
- Data Table on Europe - Year-over-year growth 2023-2028 (%)
- 9.5 Asia - Market size and forecast 2023-2028
- Chart on Asia - Market size and forecast 2023-2028 ($ million)
- Data Table on Asia - Market size and forecast 2023-2028 ($ million)
- Chart on Asia - Year-over-year growth 2023-2028 (%)
- Data Table on Asia - Year-over-year growth 2023-2028 (%)
- 9.6 Rest of World (ROW) - Market size and forecast 2023-2028
- Chart on Rest of World (ROW) - Market size and forecast 2023-2028 ($ million)
- Data Table on Rest of World (ROW) - Market size and forecast 2023-2028 ($ million)
- Chart on Rest of World (ROW) - Year-over-year growth 2023-2028 (%)
- Data Table on Rest of World (ROW) - Year-over-year growth 2023-2028 (%)
- 9.7 US - Market size and forecast 2023-2028
- Chart on US - Market size and forecast 2023-2028 ($ million)
- Data Table on US - Market size and forecast 2023-2028 ($ million)
- Chart on US - Year-over-year growth 2023-2028 (%)
- Data Table on US - Year-over-year growth 2023-2028 (%)
- 9.8 UK - Market size and forecast 2023-2028
- Chart on UK - Market size and forecast 2023-2028 ($ million)
- Data Table on UK - Market size and forecast 2023-2028 ($ million)
- Chart on UK - Year-over-year growth 2023-2028 (%)
- Data Table on UK - Year-over-year growth 2023-2028 (%)
- 9.9 Germany - Market size and forecast 2023-2028
- Chart on Germany - Market size and forecast 2023-2028 ($ million)
- Data Table on Germany - Market size and forecast 2023-2028 ($ million)
- Chart on Germany - Year-over-year growth 2023-2028 (%)
- Data Table on Germany - Year-over-year growth 2023-2028 (%)
- 9.10 China - Market size and forecast 2023-2028
- Chart on China - Market size and forecast 2023-2028 ($ million)
- Data Table on China - Market size and forecast 2023-2028 ($ million)
- Chart on China - Year-over-year growth 2023-2028 (%)
- Data Table on China - Year-over-year growth 2023-2028 (%)
- 9.11 Canada - Market size and forecast 2023-2028
- Chart on Canada - Market size and forecast 2023-2028 ($ million)
- Data Table on Canada - Market size and forecast 2023-2028 ($ million)
- Chart on Canada - Year-over-year growth 2023-2028 (%)
- Data Table on Canada - Year-over-year growth 2023-2028 (%)
- 9.12 Market opportunity By Geographical Landscape
- Market opportunity By Geographical Landscape ($ million)
- Data Tables on Market opportunity By Geographical Landscape ($ million)
10 Drivers, Challenges, and Opportunity/Restraints
- 10.1 Market drivers
- 10.2 Market challenges
- 10.3 Impact of drivers and challenges
- Impact of drivers and challenges in 2023 and 2028
- 10.4 Market opportunities/restraints
11 Competitive Landscape
- 11.1 Overview
- 11.2 Competitive Landscape
- Overview on criticality of inputs and factors of differentiation
- 11.3 Landscape disruption
- Overview on factors of disruption
- 11.4 Industry risks
- Impact of key risks on business
12 Competitive Analysis
- 12.1 Companies profiled
- Companies covered
- 12.2 Market positioning of companies
- Matrix on companies position and classification
- 123Dentist Inc.
- 123Dentist Inc. - Overview
- 123Dentist Inc. - Product / Service
- 123Dentist Inc. - Key offerings
- 12.4 Apollo Hospitals Enterprise Ltd
- Apollo Hospitals Enterprise Ltd - Overview
- Apollo Hospitals Enterprise Ltd - Business segments
- Apollo Hospitals Enterprise Ltd - Key news
- Apollo Hospitals Enterprise Ltd - Key offerings
- Apollo Hospitals Enterprise Ltd - Segment focus
- 12.5 Aspen Dental Management Inc.
- Aspen Dental Management Inc. - Overview
- Aspen Dental Management Inc. - Product / Service
- Aspen Dental Management Inc. - Key offerings
- 12.6 Birmingham Periodontal and Implant Centre Ltd.
- Birmingham Periodontal and Implant Centre Ltd. - Overview
- Birmingham Periodontal and Implant Centre Ltd. - Product / Service
- Birmingham Periodontal and Implant Centre Ltd. - Key offerings
- 12.7 Burlingame Dental Arts
- Burlingame Dental Arts - Overview
- Burlingame Dental Arts - Product / Service
- Burlingame Dental Arts - Key offerings
- 12.8 Coast Dental Services LLC
- Coast Dental Services LLC - Overview
- Coast Dental Services LLC - Product / Service
- Coast Dental Services LLC - Key offerings
- 12.9 Medtronic Plc
- Medtronic Plc - Overview
- Medtronic Plc - Business segments
- Medtronic Plc - Key news
- Medtronic Plc - Key offerings
- Medtronic Plc - Segment focus
- 12.10 Pacific Dental Services LLC
- Pacific Dental Services LLC - Overview
- Pacific Dental Services LLC - Product / Service
- Pacific Dental Services LLC - Key offerings
- 12.11 Q and M Dental Group Singapore Ltd.
- Q and M Dental Group Singapore Ltd. - Overview
- Q and M Dental Group Singapore Ltd. - Product / Service
- Q and M Dental Group Singapore Ltd. - Key offerings
- 12.12 Sun Lakes Dental
- Sun Lakes Dental - Overview
- Sun Lakes Dental - Product / Service
- Sun Lakes Dental - Key offerings
13 Appendix
- 13.1 Scope of the report
- 13.2 Inclusions and exclusions checklist
- Inclusions checklist
- Exclusions checklist
- 13.3 Currency conversion rates for US$
- Currency conversion rates for US$
- 13.4 Research methodology
- Research methodology
- 13.5 Data procurement
- Information sources
- 13.6 Data validation
- Data validation
- 13.7 Validation techniques employed for market sizing
- Validation techniques employed for market sizing
- 13.8 Data synthesis
- Data synthesis
- 13.9 360 degree market analysis
- 360 degree market analysis
- 13.10 List of abbreviations
- List of abbreviations
