|
|
市場調査レポート
商品コード
1604071
画像記録通信システムの世界市場、2024~2028年Global Picture Archiving and Communication System Market 2024-2028 |
||||||

|
|||||||
カスタマイズ可能
|
|||||||


| 画像記録通信システムの世界市場、2024~2028年 |
|
出版日: 2024年10月19日
発行: TechNavio
ページ情報: 英文 165 Pages
納期: 即納可能
|

全表示
- 概要
- 図表
- 目次
画像記録通信システム市場、2024~2028年
画像記録通信システム(PACS)市場は2023~2028年に12億5,160万米ドル、予測期間中のCAGRは5.5%で成長すると予測されます。当レポートでは、画像記録通信システム市場の全体的な分析、市場規模・予測、動向、成長促進要因、課題、約25のベンダーを網羅したベンダー分析などを掲載しています。
現在の市場シナリオ、最新動向と促進要因、市場環境全体に関する最新分析を提供しています。市場は、医療へのIT導入を奨励する政府のイニシアティブ、小規模病院やイメージングセンターでのPACS導入の増加、モバイルPACSの需要増加が牽引しています。
| 市場範囲 | |
|---|---|
| 基準年 | 2024年 |
| 終了年 | 2028年 |
| 予測期間 | 2024~2028年 |
| 成長モメンタム | 加速 |
| 前年比[2024年] | 5.3% |
| CAGR | 5.5% |
| 増分額 | 12億5,160万米ドル |
本調査では、今後数年間の画像記録通信システム市場成長を牽引する主要因の1つとして、クラウドベースPACSの台頭を挙げています。また、医療支出の増加や、患者中心の放射線ソリューションを求めるプロバイダーの増加は、市場の大きな需要につながります。
目次
第1章 エグゼクティブサマリー
- 市場概要
第2章 市場情勢
- 市場エコシステム
- 市場の特徴
- バリューチェーン分析
第3章 市場規模
- 市場の定義
- 市場セグメント分析
- 市場規模 2023年
- 市場の展望 2023~2028年
第4章 市場規模実績
- 画像記録通信システムの世界市場 2018~2022年
- 製品別セグメント分析 2018~2022年
- 用途別セグメント分析 2018~2022年
- 地域別セグメント分析 2018~2022年
- 国別セグメント分析 2018~2022年
第5章 ファイブフォース分析
- ファイブフォースの要約
- 買い手の交渉力
- 供給企業の交渉力
- 新規参入業者の脅威
- 代替品の脅威
- 競争の脅威
- 市況
第6章 市場セグメンテーション:製品別
- 市場セグメント
- 比較:製品別
- ミッドエンドPACS:市場規模と予測 2023~2028年
- エンタープライズPACS:市場規模と予測 2023~2028年
- ミニPACS:市場規模と予測 2023~2028年
- 市場機会:製品別
第7章 市場セグメンテーション:用途別
- 市場セグメント
- 比較:用途別
- 放射線科PACS:市場規模と予測 2023~2028年
- 心臓病学PACS:市場規模と予測 2023~2028年
- 病理学PACS:市場規模と予測 2023~2028年
- 市場機会:用途別
第8章 顧客情勢
- 顧客情勢概要
第9章 地域別情勢
- 地域別セグメンテーション
- 比較:地域別
- 北米:市場規模と予測 2023~2028年
- 欧州:市場規模と予測 2023~2028年
- アジア:市場規模と予測 2023~2028年
- その他:市場規模と予測 2023~2028年
- 米国:市場規模と予測 2023~2028年
- ドイツ:市場規模と予測 2023~2028年
- 日本:市場規模と予測 2023~2028年
- 中国:市場規模と予測 2023~2028年
- 英国:市場規模と予測 2023~2028年
- 地域情勢による市場機会
第10章 促進要因・課題・機会・抑制要因
- 市場促進要因
- 市場課題
- 促進要因と課題の影響
- 市場機会・抑制要因
第11章 競合情勢
- 概要
- 競合情勢
- 混乱の状況
- 産業のリスク
第12章 競合分析
- 企業プロファイル
- 企業の市場ポジショニング
- Apollo Enterprise Imaging Corp.
- Dell Technologies Inc.
- FUJIFILM Corp.
- General Electric Co.
- Intelerad Medical Systems Inc.
- International Business Machines Corp.
- Koninklijke Philips N.V.
- PaxeraHealth
- Sectra AB
- Siemens AG
第13章 付録
Exhibits:
- Exhibits1: Executive Summary - Chart on Market Overview
- Exhibits2: Executive Summary - Data Table on Market Overview
- Exhibits3: Executive Summary - Chart on Global Market Characteristics
- Exhibits4: Executive Summary - Chart on Market By Geographical Landscape
- Exhibits5: Executive Summary - Chart on Market Segmentation by Product
- Exhibits6: Executive Summary - Chart on Market Segmentation by Application
- Exhibits7: Executive Summary - Chart on Incremental Growth
- Exhibits8: Executive Summary - Data Table on Incremental Growth
- Exhibits9: Executive Summary - Chart on Company Market Positioning
- Exhibits10: Parent Market
- Exhibits11: Data Table on - Parent Market
- Exhibits12: Market characteristics analysis
- Exhibits13: Value Chain Analysis
- Exhibits14: Offerings of companies included in the market definition
- Exhibits15: Market segments
- Exhibits16: Chart on Global - Market size and forecast 2023-2028 ($ million)
- Exhibits17: Data Table on Global - Market size and forecast 2023-2028 ($ million)
- Exhibits18: Chart on Global Market: Year-over-year growth 2023-2028 (%)
- Exhibits19: Data Table on Global Market: Year-over-year growth 2023-2028 (%)
- Exhibits20: Historic Market Size - Data Table on Global Picture Archiving And Communication System Market 2018 - 2022 ($ million)
- Exhibits21: Historic Market Size - Product Segment 2018 - 2022 ($ million)
- Exhibits22: Historic Market Size - Application Segment 2018 - 2022 ($ million)
- Exhibits23: Historic Market Size - Geography Segment 2018 - 2022 ($ million)
- Exhibits24: Historic Market Size - Country Segment 2018 - 2022 ($ million)
- Exhibits25: Five forces analysis - Comparison between 2023 and 2028
- Exhibits26: Bargaining power of buyers - Impact of key factors 2023 and 2028
- Exhibits27: Bargaining power of suppliers - Impact of key factors in 2023 and 2028
- Exhibits28: Threat of new entrants - Impact of key factors in 2023 and 2028
- Exhibits29: Threat of substitutes - Impact of key factors in 2023 and 2028
- Exhibits30: Threat of rivalry - Impact of key factors in 2023 and 2028
- Exhibits31: Chart on Market condition - Five forces 2023 and 2028
- Exhibits32: Chart on Product - Market share 2023-2028 (%)
- Exhibits33: Data Table on Product - Market share 2023-2028 (%)
- Exhibits34: Chart on Comparison by Product
- Exhibits35: Data Table on Comparison by Product
- Exhibits36: Chart on Mid-end PACS - Market size and forecast 2023-2028 ($ million)
- Exhibits37: Data Table on Mid-end PACS - Market size and forecast 2023-2028 ($ million)
- Exhibits38: Chart on Mid-end PACS - Year-over-year growth 2023-2028 (%)
- Exhibits39: Data Table on Mid-end PACS - Year-over-year growth 2023-2028 (%)
- Exhibits40: Chart on Enterprise PACS - Market size and forecast 2023-2028 ($ million)
- Exhibits41: Data Table on Enterprise PACS - Market size and forecast 2023-2028 ($ million)
- Exhibits42: Chart on Enterprise PACS - Year-over-year growth 2023-2028 (%)
- Exhibits43: Data Table on Enterprise PACS - Year-over-year growth 2023-2028 (%)
- Exhibits44: Chart on Mini PACS - Market size and forecast 2023-2028 ($ million)
- Exhibits45: Data Table on Mini PACS - Market size and forecast 2023-2028 ($ million)
- Exhibits46: Chart on Mini PACS - Year-over-year growth 2023-2028 (%)
- Exhibits47: Data Table on Mini PACS - Year-over-year growth 2023-2028 (%)
- Exhibits48: Market opportunity by Product ($ million)
- Exhibits49: Data Table on Market opportunity by Product ($ million)
- Exhibits50: Chart on Application - Market share 2023-2028 (%)
- Exhibits51: Data Table on Application - Market share 2023-2028 (%)
- Exhibits52: Chart on Comparison by Application
- Exhibits53: Data Table on Comparison by Application
- Exhibits54: Chart on Radiology PACS - Market size and forecast 2023-2028 ($ million)
- Exhibits55: Data Table on Radiology PACS - Market size and forecast 2023-2028 ($ million)
- Exhibits56: Chart on Radiology PACS - Year-over-year growth 2023-2028 (%)
- Exhibits57: Data Table on Radiology PACS - Year-over-year growth 2023-2028 (%)
- Exhibits58: Chart on Cardiology PACS - Market size and forecast 2023-2028 ($ million)
- Exhibits59: Data Table on Cardiology PACS - Market size and forecast 2023-2028 ($ million)
- Exhibits60: Chart on Cardiology PACS - Year-over-year growth 2023-2028 (%)
- Exhibits61: Data Table on Cardiology PACS - Year-over-year growth 2023-2028 (%)
- Exhibits62: Chart on Pathology PACS - Market size and forecast 2023-2028 ($ million)
- Exhibits63: Data Table on Pathology PACS - Market size and forecast 2023-2028 ($ million)
- Exhibits64: Chart on Pathology PACS - Year-over-year growth 2023-2028 (%)
- Exhibits65: Data Table on Pathology PACS - Year-over-year growth 2023-2028 (%)
- Exhibits66: Market opportunity by Application ($ million)
- Exhibits67: Data Table on Market opportunity by Application ($ million)
- Exhibits68: Analysis of price sensitivity, lifecycle, customer purchase basket, adoption rates, and purchase criteria
- Exhibits69: Chart on Market share By Geographical Landscape 2023-2028 (%)
- Exhibits70: Data Table on Market share By Geographical Landscape 2023-2028 (%)
- Exhibits71: Chart on Geographic comparison
- Exhibits72: Data Table on Geographic comparison
- Exhibits73: Chart on North America - Market size and forecast 2023-2028 ($ million)
- Exhibits74: Data Table on North America - Market size and forecast 2023-2028 ($ million)
- Exhibits75: Chart on North America - Year-over-year growth 2023-2028 (%)
- Exhibits76: Data Table on North America - Year-over-year growth 2023-2028 (%)
- Exhibits77: Chart on Europe - Market size and forecast 2023-2028 ($ million)
- Exhibits78: Data Table on Europe - Market size and forecast 2023-2028 ($ million)
- Exhibits79: Chart on Europe - Year-over-year growth 2023-2028 (%)
- Exhibits80: Data Table on Europe - Year-over-year growth 2023-2028 (%)
- Exhibits81: Chart on Asia - Market size and forecast 2023-2028 ($ million)
- Exhibits82: Data Table on Asia - Market size and forecast 2023-2028 ($ million)
- Exhibits83: Chart on Asia - Year-over-year growth 2023-2028 (%)
- Exhibits84: Data Table on Asia - Year-over-year growth 2023-2028 (%)
- Exhibits85: Chart on Rest of World (ROW) - Market size and forecast 2023-2028 ($ million)
- Exhibits86: Data Table on Rest of World (ROW) - Market size and forecast 2023-2028 ($ million)
- Exhibits87: Chart on Rest of World (ROW) - Year-over-year growth 2023-2028 (%)
- Exhibits88: Data Table on Rest of World (ROW) - Year-over-year growth 2023-2028 (%)
- Exhibits89: Chart on US - Market size and forecast 2023-2028 ($ million)
- Exhibits90: Data Table on US - Market size and forecast 2023-2028 ($ million)
- Exhibits91: Chart on US - Year-over-year growth 2023-2028 (%)
- Exhibits92: Data Table on US - Year-over-year growth 2023-2028 (%)
- Exhibits93: Chart on Germany - Market size and forecast 2023-2028 ($ million)
- Exhibits94: Data Table on Germany - Market size and forecast 2023-2028 ($ million)
- Exhibits95: Chart on Germany - Year-over-year growth 2023-2028 (%)
- Exhibits96: Data Table on Germany - Year-over-year growth 2023-2028 (%)
- Exhibits97: Chart on Japan - Market size and forecast 2023-2028 ($ million)
- Exhibits98: Data Table on Japan - Market size and forecast 2023-2028 ($ million)
- Exhibits99: Chart on Japan - Year-over-year growth 2023-2028 (%)
- Exhibits100: Data Table on Japan - Year-over-year growth 2023-2028 (%)
- Exhibits101: Chart on China - Market size and forecast 2023-2028 ($ million)
- Exhibits102: Data Table on China - Market size and forecast 2023-2028 ($ million)
- Exhibits103: Chart on China - Year-over-year growth 2023-2028 (%)
- Exhibits104: Data Table on China - Year-over-year growth 2023-2028 (%)
- Exhibits105: Chart on UK - Market size and forecast 2023-2028 ($ million)
- Exhibits106: Data Table on UK - Market size and forecast 2023-2028 ($ million)
- Exhibits107: Chart on UK - Year-over-year growth 2023-2028 (%)
- Exhibits108: Data Table on UK - Year-over-year growth 2023-2028 (%)
- Exhibits109: Market opportunity By Geographical Landscape ($ million)
- Exhibits110: Data Tables on Market opportunity By Geographical Landscape ($ million)
- Exhibits111: Impact of drivers and challenges in 2023 and 2028
- Exhibits112: Overview on criticality of inputs and factors of differentiation
- Exhibits113: Overview on factors of disruption
- Exhibits114: Impact of key risks on business
- Exhibits115: Companies covered
- Exhibits116: Matrix on companies position and classification
- Exhibits117: Apollo Enterprise Imaging Corp. - Overview
- Exhibits118: Apollo Enterprise Imaging Corp. - Product / Service
- Exhibits119: Apollo Enterprise Imaging Corp. - Key news
- Exhibits120: Apollo Enterprise Imaging Corp. - Key offerings
- Exhibits121: Dell Technologies Inc. - Overview
- Exhibits122: Dell Technologies Inc. - Business segments
- Exhibits123: Dell Technologies Inc. - Key news
- Exhibits124: Dell Technologies Inc. - Key offerings
- Exhibits125: Dell Technologies Inc. - Segment focus
- Exhibits126: FUJIFILM Corp. - Overview
- Exhibits127: FUJIFILM Corp. - Business segments
- Exhibits128: FUJIFILM Corp. - Key news
- Exhibits129: FUJIFILM Corp. - Key offerings
- Exhibits130: FUJIFILM Corp. - Segment focus
- Exhibits131: General Electric Co. - Overview
- Exhibits132: General Electric Co. - Business segments
- Exhibits133: General Electric Co. - Key news
- Exhibits134: General Electric Co. - Key offerings
- Exhibits135: General Electric Co. - Segment focus
- Exhibits136: Intelerad Medical Systems Inc. - Overview
- Exhibits137: Intelerad Medical Systems Inc. - Product / Service
- Exhibits138: Intelerad Medical Systems Inc. - Key offerings
- Exhibits139: International Business Machines Corp. - Overview
- Exhibits140: International Business Machines Corp. - Business segments
- Exhibits141: International Business Machines Corp. - Key news
- Exhibits142: International Business Machines Corp. - Key offerings
- Exhibits143: International Business Machines Corp. - Segment focus
- Exhibits144: Koninklijke Philips N.V. - Overview
- Exhibits145: Koninklijke Philips N.V. - Business segments
- Exhibits146: Koninklijke Philips N.V. - Key news
- Exhibits147: Koninklijke Philips N.V. - Key offerings
- Exhibits148: Koninklijke Philips N.V. - Segment focus
- Exhibits149: PaxeraHealth - Overview
- Exhibits150: PaxeraHealth - Product / Service
- Exhibits151: PaxeraHealth - Key offerings
- Exhibits152: Sectra AB - Overview
- Exhibits153: Sectra AB - Business segments
- Exhibits154: Sectra AB - Key news
- Exhibits155: Sectra AB - Key offerings
- Exhibits156: Sectra AB - Segment focus
- Exhibits157: Siemens AG - Overview
- Exhibits158: Siemens AG - Business segments
- Exhibits159: Siemens AG - Key news
- Exhibits160: Siemens AG - Key offerings
- Exhibits161: Siemens AG - Segment focus
- Exhibits162: Inclusions checklist
- Exhibits163: Exclusions checklist
- Exhibits164: Currency conversion rates for US$
- Exhibits165: Research methodology
- Exhibits166: Information sources
- Exhibits167: Data validation
- Exhibits168: Validation techniques employed for market sizing
- Exhibits169: Data synthesis
- Exhibits170: 360 degree market analysis
- Exhibits171: List of abbreviations
Picture Archiving And Communication System Market 2024-2028
The picture archiving and communication system market is forecasted to grow by USD 1251.6 mn during 2023-2028, accelerating at a CAGR of 5.5% during the forecast period. The report on the picture archiving and communication system market provides a holistic analysis, market size and forecast, trends, growth drivers, and challenges, as well as vendor analysis covering around 25 vendors.
The report offers an up-to-date analysis regarding the current market scenario, the latest trends and drivers, and the overall market environment. The market is driven by government initiatives encouraging IT adoption in healthcare, increasing adoption of PACS by small hospitals and imaging centers, and increasing demand for mobile PACS.
| Market Scope | |
|---|---|
| Base Year | 2024 |
| End Year | 2028 |
| Series Year | 2024-2028 |
| Growth Momentum | Accelerate |
| YOY 2024 | 5.3% |
| CAGR | 5.5% |
| Incremental Value | $1251.6 mn |
Technavio's picture archiving and communication system market is segmented as below:
By Product
- Mid-end PACS
- Enterprise PACS
- Mini PACS
By Application
- Radiology PACS
- Cardiology PACS
- Pathology PACS
By Geographical Landscape
- North America
- Europe
- Asia
- Rest of World (ROW)
This study identifies the emergence of cloud-based PACS as one of the prime reasons driving the picture archiving and communication system market growth during the next few years. Also, increasing healthcare expenditure and increasing providers for patient-centered radiology solutions will lead to sizable demand in the market.
The report on the picture archiving and communication system market covers the following areas:
- Picture Archiving And Communication System Market sizing
- Picture Archiving And Communication System Market forecast
- Picture Archiving And Communication System Market industry analysis
The robust vendor analysis is designed to help clients improve their market position, and in line with this, this report provides a detailed analysis of several leading picture archiving and communication system market vendors that include 314e Corp., Agfa Gevaert NV, Apollo Enterprise Imaging Corp., Ashva Technologies Pvt. Ltd., Carestream Health Inc., Oracle Corp., Dell Technologies Inc., Esaote Spa, FUJIFILM Corp., General Electric Co., Intelerad Medical Systems Inc., International Business Machines Corp., Koninklijke Philips N.V., Laitek Inc., Lexmark International Inc., McKesson Corp., NovaRad Enterprise Healthcare Solutions, PaxeraHealth, Sectra AB, and Siemens AG. Also, the picture archiving and communication system market analysis report includes information on upcoming trends and challenges that will influence market growth. This is to help companies strategize and leverage all forthcoming growth opportunities.
The study was conducted using an objective combination of primary and secondary information including inputs from key participants in the industry. The report contains a comprehensive market and vendor landscape in addition to an analysis of the key vendors.
The publisher presents a detailed picture of the market by way of study, synthesis, and summation of data from multiple sources by an analysis of key parameters such as profit, pricing, competition, and promotions. It presents various market facets by identifying the key industry influencers. The data presented is comprehensive, reliable, and a result of extensive primary and secondary research. The market research reports provide a complete competitive landscape and an in-depth vendor selection methodology and analysis using qualitative and quantitative research to forecast accurate market growth.
Table of Contents
1 Executive Summary
- 1.1 Market overview
- Executive Summary - Chart on Market Overview
- Executive Summary - Data Table on Market Overview
- Executive Summary - Chart on Global Market Characteristics
- Executive Summary - Chart on Market By Geographical Landscape
- Executive Summary - Chart on Market Segmentation by Product
- Executive Summary - Chart on Market Segmentation by Application
- Executive Summary - Chart on Incremental Growth
- Executive Summary - Data Table on Incremental Growth
- Executive Summary - Chart on Company Market Positioning
2 Market Landscape
- 2.1 Market ecosystem
- Parent Market
- Data Table on - Parent Market
- 2.2 Market characteristics
- Market characteristics analysis
- 2.3 Value chain analysis
- Value Chain Analysis
3 Market Sizing
- 3.1 Market definition
- Offerings of companies included in the market definition
- 3.2 Market segment analysis
- Market segments
- 3.3 Market size 2023
- 3.4 Market outlook: Forecast for 2023-2028
- Chart on Global - Market size and forecast 2023-2028 ($ million)
- Data Table on Global - Market size and forecast 2023-2028 ($ million)
- Chart on Global Market: Year-over-year growth 2023-2028 (%)
- Data Table on Global Market: Year-over-year growth 2023-2028 (%)
4 Historic Market Size
- 4.1 Global Picture Archiving And Communication System Market 2018 - 2022
- Historic Market Size - Data Table on Global Picture Archiving And Communication System Market 2018 - 2022 ($ million)
- 4.2 Product segment analysis 2018 - 2022
- Historic Market Size - Product Segment 2018 - 2022 ($ million)
- 4.3 Application segment analysis 2018 - 2022
- Historic Market Size - Application Segment 2018 - 2022 ($ million)
- 4.4 Geography segment analysis 2018 - 2022
- Historic Market Size - Geography Segment 2018 - 2022 ($ million)
- 4.5 Country segment analysis 2018 - 2022
- Historic Market Size - Country Segment 2018 - 2022 ($ million)
5 Five Forces Analysis
- 5.1 Five forces summary
- Five forces analysis - Comparison between 2023 and 2028
- 5.2 Bargaining power of buyers
- Bargaining power of buyers - Impact of key factors 2023 and 2028
- 5.3 Bargaining power of suppliers
- Bargaining power of suppliers - Impact of key factors in 2023 and 2028
- 5.4 Threat of new entrants
- Threat of new entrants - Impact of key factors in 2023 and 2028
- 5.5 Threat of substitutes
- Threat of substitutes - Impact of key factors in 2023 and 2028
- 5.6 Threat of rivalry
- Threat of rivalry - Impact of key factors in 2023 and 2028
- 5.7 Market condition
- Chart on Market condition - Five forces 2023 and 2028
6 Market Segmentation by Product
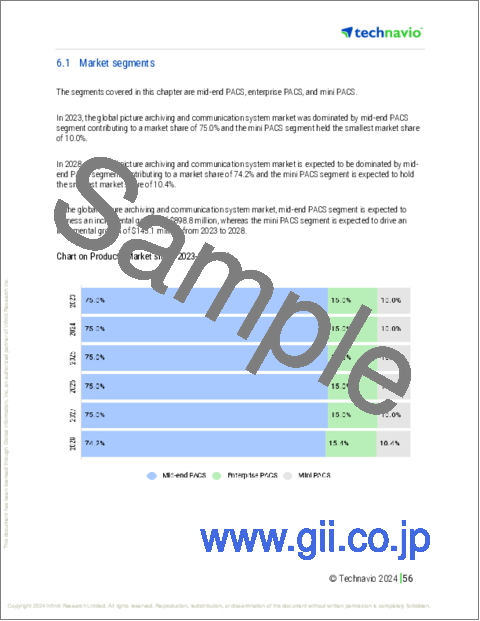
- 6.1 Market segments
- Chart on Product - Market share 2023-2028 (%)
- Data Table on Product - Market share 2023-2028 (%)
- 6.2 Comparison by Product
- Chart on Comparison by Product
- Data Table on Comparison by Product
- 6.3 Mid-end PACS - Market size and forecast 2023-2028
- Chart on Mid-end PACS - Market size and forecast 2023-2028 ($ million)
- Data Table on Mid-end PACS - Market size and forecast 2023-2028 ($ million)
- Chart on Mid-end PACS - Year-over-year growth 2023-2028 (%)
- Data Table on Mid-end PACS - Year-over-year growth 2023-2028 (%)
- 6.4 Enterprise PACS - Market size and forecast 2023-2028
- Chart on Enterprise PACS - Market size and forecast 2023-2028 ($ million)
- Data Table on Enterprise PACS - Market size and forecast 2023-2028 ($ million)
- Chart on Enterprise PACS - Year-over-year growth 2023-2028 (%)
- Data Table on Enterprise PACS - Year-over-year growth 2023-2028 (%)
- 6.5 Mini PACS - Market size and forecast 2023-2028
- Chart on Mini PACS - Market size and forecast 2023-2028 ($ million)
- Data Table on Mini PACS - Market size and forecast 2023-2028 ($ million)
- Chart on Mini PACS - Year-over-year growth 2023-2028 (%)
- Data Table on Mini PACS - Year-over-year growth 2023-2028 (%)
- 6.6 Market opportunity by Product
- Market opportunity by Product ($ million)
- Data Table on Market opportunity by Product ($ million)
7 Market Segmentation by Application
- 7.1 Market segments
- Chart on Application - Market share 2023-2028 (%)
- Data Table on Application - Market share 2023-2028 (%)
- 7.2 Comparison by Application
- Chart on Comparison by Application
- Data Table on Comparison by Application
- 7.3 Radiology PACS - Market size and forecast 2023-2028
- Chart on Radiology PACS - Market size and forecast 2023-2028 ($ million)
- Data Table on Radiology PACS - Market size and forecast 2023-2028 ($ million)
- Chart on Radiology PACS - Year-over-year growth 2023-2028 (%)
- Data Table on Radiology PACS - Year-over-year growth 2023-2028 (%)
- 7.4 Cardiology PACS - Market size and forecast 2023-2028
- Chart on Cardiology PACS - Market size and forecast 2023-2028 ($ million)
- Data Table on Cardiology PACS - Market size and forecast 2023-2028 ($ million)
- Chart on Cardiology PACS - Year-over-year growth 2023-2028 (%)
- Data Table on Cardiology PACS - Year-over-year growth 2023-2028 (%)
- 7.5 Pathology PACS - Market size and forecast 2023-2028
- Chart on Pathology PACS - Market size and forecast 2023-2028 ($ million)
- Data Table on Pathology PACS - Market size and forecast 2023-2028 ($ million)
- Chart on Pathology PACS - Year-over-year growth 2023-2028 (%)
- Data Table on Pathology PACS - Year-over-year growth 2023-2028 (%)
- 7.6 Market opportunity by Application
- Market opportunity by Application ($ million)
- Data Table on Market opportunity by Application ($ million)
8 Customer Landscape
- 8.1 Customer landscape overview
- Analysis of price sensitivity, lifecycle, customer purchase basket, adoption rates, and purchase criteria
9 Geographic Landscape
- 9.1 Geographic segmentation
- Chart on Market share By Geographical Landscape 2023-2028 (%)
- Data Table on Market share By Geographical Landscape 2023-2028 (%)
- 9.2 Geographic comparison
- Chart on Geographic comparison
- Data Table on Geographic comparison
- 9.3 North America - Market size and forecast 2023-2028
- Chart on North America - Market size and forecast 2023-2028 ($ million)
- Data Table on North America - Market size and forecast 2023-2028 ($ million)
- Chart on North America - Year-over-year growth 2023-2028 (%)
- Data Table on North America - Year-over-year growth 2023-2028 (%)
- 9.4 Europe - Market size and forecast 2023-2028
- Chart on Europe - Market size and forecast 2023-2028 ($ million)
- Data Table on Europe - Market size and forecast 2023-2028 ($ million)
- Chart on Europe - Year-over-year growth 2023-2028 (%)
- Data Table on Europe - Year-over-year growth 2023-2028 (%)
- 9.5 Asia - Market size and forecast 2023-2028
- Chart on Asia - Market size and forecast 2023-2028 ($ million)
- Data Table on Asia - Market size and forecast 2023-2028 ($ million)
- Chart on Asia - Year-over-year growth 2023-2028 (%)
- Data Table on Asia - Year-over-year growth 2023-2028 (%)
- 9.6 Rest of World (ROW) - Market size and forecast 2023-2028
- Chart on Rest of World (ROW) - Market size and forecast 2023-2028 ($ million)
- Data Table on Rest of World (ROW) - Market size and forecast 2023-2028 ($ million)
- Chart on Rest of World (ROW) - Year-over-year growth 2023-2028 (%)
- Data Table on Rest of World (ROW) - Year-over-year growth 2023-2028 (%)
- 9.7 US - Market size and forecast 2023-2028
- Chart on US - Market size and forecast 2023-2028 ($ million)
- Data Table on US - Market size and forecast 2023-2028 ($ million)
- Chart on US - Year-over-year growth 2023-2028 (%)
- Data Table on US - Year-over-year growth 2023-2028 (%)
- 9.8 Germany - Market size and forecast 2023-2028
- Chart on Germany - Market size and forecast 2023-2028 ($ million)
- Data Table on Germany - Market size and forecast 2023-2028 ($ million)
- Chart on Germany - Year-over-year growth 2023-2028 (%)
- Data Table on Germany - Year-over-year growth 2023-2028 (%)
- 9.9 Japan - Market size and forecast 2023-2028
- Chart on Japan - Market size and forecast 2023-2028 ($ million)
- Data Table on Japan - Market size and forecast 2023-2028 ($ million)
- Chart on Japan - Year-over-year growth 2023-2028 (%)
- Data Table on Japan - Year-over-year growth 2023-2028 (%)
- 9.10 China - Market size and forecast 2023-2028
- Chart on China - Market size and forecast 2023-2028 ($ million)
- Data Table on China - Market size and forecast 2023-2028 ($ million)
- Chart on China - Year-over-year growth 2023-2028 (%)
- Data Table on China - Year-over-year growth 2023-2028 (%)
- 9.11 UK - Market size and forecast 2023-2028
- Chart on UK - Market size and forecast 2023-2028 ($ million)
- Data Table on UK - Market size and forecast 2023-2028 ($ million)
- Chart on UK - Year-over-year growth 2023-2028 (%)
- Data Table on UK - Year-over-year growth 2023-2028 (%)
- 9.12 Market opportunity By Geographical Landscape
- Market opportunity By Geographical Landscape ($ million)
- Data Tables on Market opportunity By Geographical Landscape ($ million)
10 Drivers, Challenges, and Opportunity/Restraints
- 10.1 Market drivers
- 10.2 Market challenges
- 10.3 Impact of drivers and challenges
- Impact of drivers and challenges in 2023 and 2028
- 10.4 Market opportunities/restraints
11 Competitive Landscape
- 11.1 Overview
- 11.2 Competitive Landscape
- Overview on criticality of inputs and factors of differentiation
- 11.3 Landscape disruption
- Overview on factors of disruption
- 11.4 Industry risks
- Impact of key risks on business
12 Competitive Analysis
- 12.1 Companies profiled
- Companies covered
- 12.2 Market positioning of companies
- Matrix on companies position and classification
- 12.3 Apollo Enterprise Imaging Corp.
- Apollo Enterprise Imaging Corp. - Overview
- Apollo Enterprise Imaging Corp. - Product / Service
- Apollo Enterprise Imaging Corp. - Key news
- Apollo Enterprise Imaging Corp. - Key offerings
- 12.4 Dell Technologies Inc.
- Dell Technologies Inc. - Overview
- Dell Technologies Inc. - Business segments
- Dell Technologies Inc. - Key news
- Dell Technologies Inc. - Key offerings
- Dell Technologies Inc. - Segment focus
- 12.5 FUJIFILM Corp.
- FUJIFILM Corp. - Overview
- FUJIFILM Corp. - Business segments
- FUJIFILM Corp. - Key news
- FUJIFILM Corp. - Key offerings
- FUJIFILM Corp. - Segment focus
- 12.6 General Electric Co.
- General Electric Co. - Overview
- General Electric Co. - Business segments
- General Electric Co. - Key news
- General Electric Co. - Key offerings
- General Electric Co. - Segment focus
- 12.7 Intelerad Medical Systems Inc.
- Intelerad Medical Systems Inc. - Overview
- Intelerad Medical Systems Inc. - Product / Service
- Intelerad Medical Systems Inc. - Key offerings
- 12.8 International Business Machines Corp.
- International Business Machines Corp. - Overview
- International Business Machines Corp. - Business segments
- International Business Machines Corp. - Key news
- International Business Machines Corp. - Key offerings
- International Business Machines Corp. - Segment focus
- 12.9 Koninklijke Philips N.V.
- Koninklijke Philips N.V. - Overview
- Koninklijke Philips N.V. - Business segments
- Koninklijke Philips N.V. - Key news
- Koninklijke Philips N.V. - Key offerings
- Koninklijke Philips N.V. - Segment focus
- 12.10 PaxeraHealth
- PaxeraHealth - Overview
- PaxeraHealth - Product / Service
- PaxeraHealth - Key offerings
- 12.11 Sectra AB
- Sectra AB - Overview
- Sectra AB - Business segments
- Sectra AB - Key news
- Sectra AB - Key offerings
- Sectra AB - Segment focus
- 12.12 Siemens AG
- Siemens AG - Overview
- Siemens AG - Business segments
- Siemens AG - Key news
- Siemens AG - Key offerings
- Siemens AG - Segment focus
13 Appendix
- 13.1 Scope of the report
- 13.2 Inclusions and exclusions checklist
- Inclusions checklist
- Exclusions checklist
- 13.3 Currency conversion rates for US$
- Currency conversion rates for US$
- 13.4 Research methodology
- Research methodology
- 13.5 Data procurement
- Information sources
- 13.6 Data validation
- Data validation
- 13.7 Validation techniques employed for market sizing
- Validation techniques employed for market sizing
- 13.8 Data synthesis
- Data synthesis
- 13.9 360 degree market analysis
- 360 degree market analysis
- 13.10 List of abbreviations
- List of abbreviations
