|
|
市場調査レポート
商品コード
2030398
パッケージ入り米スナックの世界市場 2026-2030年Global Packaged Rice Snacks Market 2026-2030 |
||||||
|
|||||||
カスタマイズ可能
|
|||||||

| パッケージ入り米スナックの世界市場 2026-2030年 |
|
出版日: 2026年05月03日
発行: TechNavio
ページ情報: 英文 303 Pages
納期: 即納可能
|

概要
世界のパッケージ入り米スナック市場は、2025年から2030年にかけて42億260万米ドル成長し、予測期間中のCAGRは5.4%になると予測されています。
本レポートでは、世界のパッケージ入り米スナック市場について、包括的な分析、市場規模と予測、動向、成長要因、課題に加え、約25社のベンダー分析を提供しています。
本レポートでは、現在の市場状況、最新の動向と促進要因、および市場環境全体に関する最新の分析を提供しています。この市場は、グルテン過敏症やセリアック病の有病率の高まり、クリーンラベルや最小限の加工を施した原材料への移行、消費の拡大、そして手軽なスナック食の普及によって牽引されています。
本調査は、業界の主要関係者からの意見を含む一次情報と二次情報を客観的に組み合わせて実施されました。本レポートには、主要企業の分析に加え、包括的な市場規模データ、地域別分析を伴うセグメント、およびベンダー情勢が含まれています。レポートには、過去データと予測データが掲載されています。
| 市場範囲 | |
|---|---|
| 基準年 | 2025年 |
| 終了年 | 2030 |
| 調査対象期間 | 2026年~2030年 |
| 成長モメンタム | 加速 |
| 2026年の前年比 | 5.2% |
| CAGR | 5.4% |
| 増分額 | 42億260万米ドル |
本調査では、今後数年間における世界のパッケージ入り米スナック市場の成長を牽引する主な要因の一つとして、エスニックおよび世界の味の融合の広がりを挙げています。また、古代穀物やスーパーフードの取り入れによるプレミアム化の進展、および持続可能で循環型のパッケージソリューションの採用が、市場において相当な需要を生み出すと見込まれます。
目次
第1章 エグゼクティブサマリー
第2章 Technavio分析
- 価格・ライフサイクル・顧客購入バスケット・採用率・購入基準の分析
- インプットの重要性と差別化の要因
- ディスラプション要因
- 促進要因と課題の影響
第3章 市場情勢
- 市場エコシステム
- 市場の特徴
- バリューチェーン分析
第4章 市場規模
- 市場の定義
- 市場セグメント分析
- 市場規模、2025年
- 市場の見通し、2025年-2030年
第5章 市場規模実績
- 世界のパッケージ入り米スナック市場、2020年-2024年
- 製品別セグメント分析、2020年-2024年
- 包装別セグメント分析、2020年-2024年
- 流通チャネル別セグメント分析、2020年-2024年
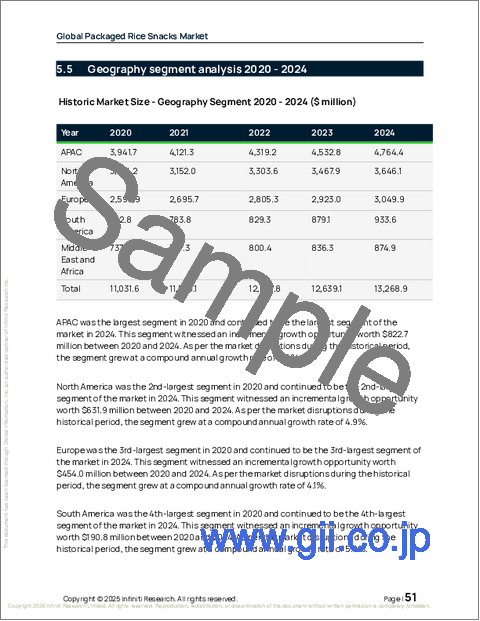
- 地域別セグメント分析、2020年-2024年
- 国別セグメント分析、2020年-2024年
第6章 定性分析
- AIの影響:世界のパッケージ入り米スナック市場
- 地政学的紛争が及ぼす影響:世界のパッケージ入り米スナック市場
第7章 ファイブフォース分析
第8章 市場セグメンテーション:製品別
- 比較:製品別
- ライスケーキ
- RCCB
- ライスクリスプ
- 市場機会:製品別
第9章 市場セグメンテーション:包装別
- 比較:包装別
- パウチ
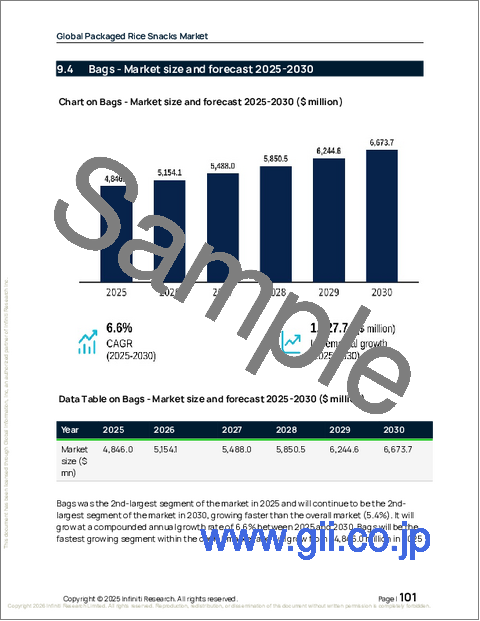
- バッグ
- 箱
- 市場機会:包装別
第10章 市場セグメンテーション:流通チャネル別
- 比較:流通チャネル別
- スーパーマーケットまたはハイパーマーケット
- コンビニエンスストア
- オンラインリテール
- 専門食品店
- 市場機会:流通チャネル別
第11章 顧客情勢
第12章 地域別情勢
- 地域別セグメンテーション
- 地域別比較
- アジア太平洋地域
- 中国
- 日本
- インド
- 韓国
- オーストラリア
- インドネシア
- 北米
- 米国
- カナダ
- メキシコ
- 欧州
- ドイツ
- 英国
- フランス
- イタリア
- スペイン
- オランダ
- 南アメリカ
- ブラジル
- アルゼンチン
- チリ
- 中東・アフリカ
- サウジアラビア
- UAE
- 南アフリカ
- イスラエル
- トルコ
- 市場機会:地域別
第13章 促進要因・課題・機会
- 市場促進要因
- 市場の課題
- 促進要因と課題の影響
- 市場機会
第14章 競合情勢
- 概要
- 競合情勢
- ディスラプション情勢
- 業界のリスク
第15章 競合分析
- 企業プロファイル
- 企業ランキング指標
- 企業の市場ポジショニング
- Annie Chuns Inc.
- Blue Diamond Growers
- Calbee Inc.
- General Mills Inc.
- Kameda Seika Co. Ltd.
- Kellanova
- Lotte Corp.
- Lundberg Family Farms
- Nongshim Co. Ltd.
- Panos Brands LLC
- PepsiCo Inc.
- Ricegrowers Ltd.
- SanoRice
- The Campbell Co.
- Want Want China Holdings Ltd.
