|
|
市場調査レポート
商品コード
1603681
X線検査システム技術の世界市場 (2024~2028年)Global X Ray Inspection Systems Technology Market 2024-2028 |
||||||

|
|||||||
カスタマイズ可能
|
|||||||

| X線検査システム技術の世界市場 (2024~2028年) |
|
出版日: 2024年10月30日
発行: TechNavio
ページ情報: 英文 134 Pages
納期: 即納可能
|

全表示
- 概要
- 図表
- 目次
X線検査システム技術市場 (2024~2028年)
X線検査システム技術市場は2023-2028年に3億7,700万米ドル分拡大し、予測期間中に6.8%のCAGRで成長すると予測されます。当レポートでは、X線検査システム技術市場の全体的な分析、市場規模・予測、動向、成長促進要因、課題、約25のベンダーを網羅したベンダー分析などを掲載しています。
当レポートでは、現在の市場シナリオ、最新動向と促進要因、市場環境全体に関する最新分析を提供しています。市場を牽引しているのは、セキュリティ上の懸念からくる政府の厳しい規制、安全性や品質基準に対する消費者の意識の高まり、先進国・新興国双方からの需要などです。
| 市場範囲 | |
|---|---|
| 基準年 | 2024年 |
| 終了年 | 2028年 |
| 予測期間 | 2024~2028年 |
| 成長モメンタム | 加速 |
| 前年比 (2024年) | 6.4% |
| CAGR | 6.8% |
| 増分額 | 3億7,700万米ドル |
当レポートでは、デジタルX線検査システムの自動化が、今後数年間のX線検査システム技術市場成長を牽引する主要因の1つであると分析しています。また、エンドユーザー産業での製品の小型化や、カスタム型ソリューションの利用可能性が、市場の大きな需要につながります。
目次
第1章 エグゼクティブサマリー
- 市場概要
第2章 市場情勢
- 市場エコシステム
- 市場の特徴
- バリューチェーン分析
第3章 市場規模
- 市場の定義
- 市場セグメント分析
- 市場規模 (2023年)
- 市場の見通し (2023~2028年)
第4章 市場規模実績
- X線検査システム技術の世界市場 (2018~2022年)
- 技術別分析 (2018~2022年)
- 地域別分析 (2018~2022年)
- 国別分析 (2018~2022年)
第5章 ファイブフォース分析
- ファイブフォースの要約
- 買い手の交渉力
- 供給企業の交渉力
- 新規参入業者の脅威
- 代替品の脅威
- 競争の脅威
- 市況
第6章 市場セグメンテーション:技術別
- 市場セグメント
- 比較:技術別
- フィルムベース技術:市場規模と予測 (2023~2028年)
- デジタル画像技術:市場規模と予測 (2023~2028年)
- 市場機会:技術別
第7章 顧客情勢
- 顧客情勢の概要
第8章 地域別情勢
- 地域別セグメンテーション
- 地域別比較
- 北米:市場規模と予測 (2023~2028年)
- 欧州:市場規模と予測 (2023~2028年)
- アジア:市場規模と予測 (2023~2028年)
- 世界のその他の地域:市場規模と予測 (2023~2028年)
- 米国:市場規模と予測 (2023~2028年)
- カナダ:市場規模と予測 (2023~2028年)
- ドイツ:市場規模と予測 (2023~2028年)
- 中国:市場規模と予測 (2023~2028年)
- 英国:市場規模と予測 (2023~2028年)
- 市場機会:地域別
第9章 促進要因・課題・機会・抑制要因
- 市場促進要因
- 市場の課題
- 促進要因と課題の影響
- 市場の機会・抑制要因
第10章 競合情勢
- 概要
- 競合情勢
- 混乱の状況
- 業界のリスク
第11章 競合分析
- 企業プロファイル
- 企業の市場ポジショニング
- COMET Technologies Inc
- General Electric Co.
- Illinois Tool Works Inc.
- Mettler Toledo International Inc.
- Nikon Corp.
- Nordson Corp.
- Smiths Group Plc
- VisiConsult X-ray Systems and Solutions GmbH
- VJ Group Inc.
第12章 付録
Exhibits:
- Exhibits1: Executive Summary - Chart on Market Overview
- Exhibits2: Executive Summary - Data Table on Market Overview
- Exhibits3: Executive Summary - Chart on Global Market Characteristics
- Exhibits4: Executive Summary - Chart on Market By Geographical Landscape
- Exhibits5: Executive Summary - Chart on Market Segmentation by Technology
- Exhibits6: Executive Summary - Chart on Incremental Growth
- Exhibits7: Executive Summary - Data Table on Incremental Growth
- Exhibits8: Executive Summary - Chart on Company Market Positioning
- Exhibits9: Parent Market
- Exhibits10: Data Table on - Parent Market
- Exhibits11: Market characteristics analysis
- Exhibits12: Value Chain Analysis
- Exhibits13: Offerings of companies included in the market definition
- Exhibits14: Market segments
- Exhibits15: Chart on Global - Market size and forecast 2023-2028 ($ million)
- Exhibits16: Data Table on Global - Market size and forecast 2023-2028 ($ million)
- Exhibits17: Chart on Global Market: Year-over-year growth 2023-2028 (%)
- Exhibits18: Data Table on Global Market: Year-over-year growth 2023-2028 (%)
- Exhibits19: Historic Market Size - Data Table on Global X Ray Inspection Systems Technology Market 2018 - 2022 ($ million)
- Exhibits20: Historic Market Size - Technology Segment 2018 - 2022 ($ million)
- Exhibits21: Historic Market Size - Geography Segment 2018 - 2022 ($ million)
- Exhibits22: Historic Market Size - Country Segment 2018 - 2022 ($ million)
- Exhibits23: Five forces analysis - Comparison between 2023 and 2028
- Exhibits24: Bargaining power of buyers - Impact of key factors 2023 and 2028
- Exhibits25: Bargaining power of suppliers - Impact of key factors in 2023 and 2028
- Exhibits26: Threat of new entrants - Impact of key factors in 2023 and 2028
- Exhibits27: Threat of substitutes - Impact of key factors in 2023 and 2028
- Exhibits28: Threat of rivalry - Impact of key factors in 2023 and 2028
- Exhibits29: Chart on Market condition - Five forces 2023 and 2028
- Exhibits30: Chart on Technology - Market share 2023-2028 (%)
- Exhibits31: Data Table on Technology - Market share 2023-2028 (%)
- Exhibits32: Chart on Comparison by Technology
- Exhibits33: Data Table on Comparison by Technology
- Exhibits34: Chart on Flim based technology - Market size and forecast 2023-2028 ($ million)
- Exhibits35: Data Table on Flim based technology - Market size and forecast 2023-2028 ($ million)
- Exhibits36: Chart on Flim based technology - Year-over-year growth 2023-2028 (%)
- Exhibits37: Data Table on Flim based technology - Year-over-year growth 2023-2028 (%)
- Exhibits38: Chart on Digital imaging technology - Market size and forecast 2023-2028 ($ million)
- Exhibits39: Data Table on Digital imaging technology - Market size and forecast 2023-2028 ($ million)
- Exhibits40: Chart on Digital imaging technology - Year-over-year growth 2023-2028 (%)
- Exhibits41: Data Table on Digital imaging technology - Year-over-year growth 2023-2028 (%)
- Exhibits42: Market opportunity by Technology ($ million)
- Exhibits43: Data Table on Market opportunity by Technology ($ million)
- Exhibits44: Analysis of price sensitivity, lifecycle, customer purchase basket, adoption rates, and purchase criteria
- Exhibits45: Chart on Market share By Geographical Landscape 2023-2028 (%)
- Exhibits46: Data Table on Market share By Geographical Landscape 2023-2028 (%)
- Exhibits47: Chart on Geographic comparison
- Exhibits48: Data Table on Geographic comparison
- Exhibits49: Chart on North America - Market size and forecast 2023-2028 ($ million)
- Exhibits50: Data Table on North America - Market size and forecast 2023-2028 ($ million)
- Exhibits51: Chart on North America - Year-over-year growth 2023-2028 (%)
- Exhibits52: Data Table on North America - Year-over-year growth 2023-2028 (%)
- Exhibits53: Chart on Europe - Market size and forecast 2023-2028 ($ million)
- Exhibits54: Data Table on Europe - Market size and forecast 2023-2028 ($ million)
- Exhibits55: Chart on Europe - Year-over-year growth 2023-2028 (%)
- Exhibits56: Data Table on Europe - Year-over-year growth 2023-2028 (%)
- Exhibits57: Chart on Asia - Market size and forecast 2023-2028 ($ million)
- Exhibits58: Data Table on Asia - Market size and forecast 2023-2028 ($ million)
- Exhibits59: Chart on Asia - Year-over-year growth 2023-2028 (%)
- Exhibits60: Data Table on Asia - Year-over-year growth 2023-2028 (%)
- Exhibits61: Chart on Rest of World (ROW) - Market size and forecast 2023-2028 ($ million)
- Exhibits62: Data Table on Rest of World (ROW) - Market size and forecast 2023-2028 ($ million)
- Exhibits63: Chart on Rest of World (ROW) - Year-over-year growth 2023-2028 (%)
- Exhibits64: Data Table on Rest of World (ROW) - Year-over-year growth 2023-2028 (%)
- Exhibits65: Chart on US - Market size and forecast 2023-2028 ($ million)
- Exhibits66: Data Table on US - Market size and forecast 2023-2028 ($ million)
- Exhibits67: Chart on US - Year-over-year growth 2023-2028 (%)
- Exhibits68: Data Table on US - Year-over-year growth 2023-2028 (%)
- Exhibits69: Chart on Canada - Market size and forecast 2023-2028 ($ million)
- Exhibits70: Data Table on Canada - Market size and forecast 2023-2028 ($ million)
- Exhibits71: Chart on Canada - Year-over-year growth 2023-2028 (%)
- Exhibits72: Data Table on Canada - Year-over-year growth 2023-2028 (%)
- Exhibits73: Chart on Germany - Market size and forecast 2023-2028 ($ million)
- Exhibits74: Data Table on Germany - Market size and forecast 2023-2028 ($ million)
- Exhibits75: Chart on Germany - Year-over-year growth 2023-2028 (%)
- Exhibits76: Data Table on Germany - Year-over-year growth 2023-2028 (%)
- Exhibits77: Chart on China - Market size and forecast 2023-2028 ($ million)
- Exhibits78: Data Table on China - Market size and forecast 2023-2028 ($ million)
- Exhibits79: Chart on China - Year-over-year growth 2023-2028 (%)
- Exhibits80: Data Table on China - Year-over-year growth 2023-2028 (%)
- Exhibits81: Chart on UK - Market size and forecast 2023-2028 ($ million)
- Exhibits82: Data Table on UK - Market size and forecast 2023-2028 ($ million)
- Exhibits83: Chart on UK - Year-over-year growth 2023-2028 (%)
- Exhibits84: Data Table on UK - Year-over-year growth 2023-2028 (%)
- Exhibits85: Market opportunity By Geographical Landscape ($ million)
- Exhibits86: Data Tables on Market opportunity By Geographical Landscape ($ million)
- Exhibits87: Impact of drivers and challenges in 2023 and 2028
- Exhibits88: Overview on criticality of inputs and factors of differentiation
- Exhibits89: Overview on factors of disruption
- Exhibits90: Impact of key risks on business
- Exhibits91: Companies covered
- Exhibits92: Matrix on companies position and classification
- Exhibits93: 3DX-RAY Ltd - Overview
- Exhibits94: 3DX-RAY Ltd - Product / Service
- Exhibits95: 3DX-RAY Ltd - Key offerings
- Exhibits96: COMET Technologies Inc - Overview
- Exhibits97: COMET Technologies Inc - Product / Service
- Exhibits98: COMET Technologies Inc - Key offerings
- Exhibits99: General Electric Co. - Overview
- Exhibits100: General Electric Co. - Business segments
- Exhibits101: General Electric Co. - Key news
- Exhibits102: General Electric Co. - Key offerings
- Exhibits103: General Electric Co. - Segment focus
- Exhibits104: Illinois Tool Works Inc. - Overview
- Exhibits105: Illinois Tool Works Inc. - Business segments
- Exhibits106: Illinois Tool Works Inc. - Key news
- Exhibits107: Illinois Tool Works Inc. - Key offerings
- Exhibits108: Illinois Tool Works Inc. - Segment focus
- Exhibits109: Mettler Toledo International Inc. - Overview
- Exhibits110: Mettler Toledo International Inc. - Business segments
- Exhibits111: Mettler Toledo International Inc. - Key news
- Exhibits112: Mettler Toledo International Inc. - Key offerings
- Exhibits113: Mettler Toledo International Inc. - Segment focus
- Exhibits114: Nikon Corp. - Overview
- Exhibits115: Nikon Corp. - Business segments
- Exhibits116: Nikon Corp. - Key offerings
- Exhibits117: Nikon Corp. - Segment focus
- Exhibits118: Nordson Corp. - Overview
- Exhibits119: Nordson Corp. - Business segments
- Exhibits120: Nordson Corp. - Key news
- Exhibits121: Nordson Corp. - Key offerings
- Exhibits122: Nordson Corp. - Segment focus
- Exhibits123: Smiths Group Plc - Overview
- Exhibits124: Smiths Group Plc - Business segments
- Exhibits125: Smiths Group Plc - Key news
- Exhibits126: Smiths Group Plc - Key offerings
- Exhibits127: Smiths Group Plc - Segment focus
- Exhibits128: VisiConsult X-ray Systems and Solutions GmbH - Overview
- Exhibits129: VisiConsult X-ray Systems and Solutions GmbH - Product / Service
- Exhibits130: VisiConsult X-ray Systems and Solutions GmbH - Key offerings
- Exhibits131: VJ Group Inc. - Overview
- Exhibits132: VJ Group Inc. - Product / Service
- Exhibits133: VJ Group Inc. - Key offerings
- Exhibits134: Inclusions checklist
- Exhibits135: Exclusions checklist
- Exhibits136: Currency conversion rates for US$
- Exhibits137: Research methodology
- Exhibits138: Information sources
- Exhibits139: Data validation
- Exhibits140: Validation techniques employed for market sizing
- Exhibits141: Data synthesis
- Exhibits142: 360 degree market analysis
- Exhibits143: List of abbreviations
X Ray Inspection Systems Technology Market 2024-2028
The x ray inspection systems technology market is forecasted to grow by USD 377 mn during 2023-2028, accelerating at a CAGR of 6.8% during the forecast period. The report on the x ray inspection systems technology market provides a holistic analysis, market size and forecast, trends, growth drivers, and challenges, as well as vendor analysis covering around 25 vendors.
The report offers an up-to-date analysis regarding the current market scenario, the latest trends and drivers, and the overall market environment. The market is driven by stringent government regulations due to security concerns, growing consumer awareness raising bar of safety and quality standards, and demand from both developed and developing economies.
| Market Scope | |
|---|---|
| Base Year | 2024 |
| End Year | 2028 |
| Series Year | 2024-2028 |
| Growth Momentum | Accelerate |
| YOY 2024 | 6.4% |
| CAGR | 6.8% |
| Incremental Value | $377 mn |
Technavio's x ray inspection systems technology market is segmented as below:
By Technology
- Flim based technology
- Digital imaging technology
By Geographical Landscape
- North America
- Europe
- Asia
- Rest of World (ROW)
This study identifies the automation in digital x ray inspection systems as one of the prime reasons driving the x ray inspection systems technology market growth during the next few years. Also, miniaturization of products of end-user industries and availability of customized solutions will lead to sizable demand in the market.
The report on the x ray inspection systems technology market covers the following areas:
- X Ray Inspection Systems Technology Market sizing
- X Ray Inspection Systems Technology Market forecast
- X Ray Inspection Systems Technology Market industry analysis
The robust vendor analysis is designed to help clients improve their market position, and in line with this, this report provides a detailed analysis of several leading x ray inspection systems technology market vendors that include 3DX-RAY Ltd, Anritsu Corp., Carestream Health Inc., COMET Technologies Inc, Creative Electron Inc., Dandong Aolong Radiative Instrument Group Co. Ltd., Eagle Product Inspection LLC, General Electric Co., Glenbrook Technologies Inc., Illinois Tool Works Inc., Mettler Toledo International Inc., Nikon Corp., Nordson Corp., Scienscope International Inc, Shenzhen Zhuomao Technology Co. Ltd, Smiths Group Plc, Thermo Fisher Scientific Inc., Viscom AG, VisiConsult X-ray Systems and Solutions GmbH, and VJ Group Inc.. Also, the x ray inspection systems technology market analysis report includes information on upcoming trends and challenges that will influence market growth. This is to help companies strategize and leverage all forthcoming growth opportunities.
The study was conducted using an objective combination of primary and secondary information including inputs from key participants in the industry. The report contains a comprehensive market and vendor landscape in addition to an analysis of the key vendors.
The publisher presents a detailed picture of the market by the way of study, synthesis, and summation of data from multiple sources by an analysis of key parameters such as profit, pricing, competition, and promotions. It presents various market facets by identifying the key industry influencers. The data presented is comprehensive, reliable, and a result of extensive primary and secondary research. The market research reports provide a complete competitive landscape and an in-depth vendor selection methodology and analysis using qualitative and quantitative research to forecast accurate market growth.
Table of Contents
1 Executive Summary
- 1.1 Market overview
- Executive Summary - Chart on Market Overview
- Executive Summary - Data Table on Market Overview
- Executive Summary - Chart on Global Market Characteristics
- Executive Summary - Chart on Market By Geographical Landscape
- Executive Summary - Chart on Market Segmentation by Technology
- Executive Summary - Chart on Incremental Growth
- Executive Summary - Data Table on Incremental Growth
- Executive Summary - Chart on Company Market Positioning
2 Market Landscape
- 2.1 Market ecosystem
- Parent Market
- Data Table on - Parent Market
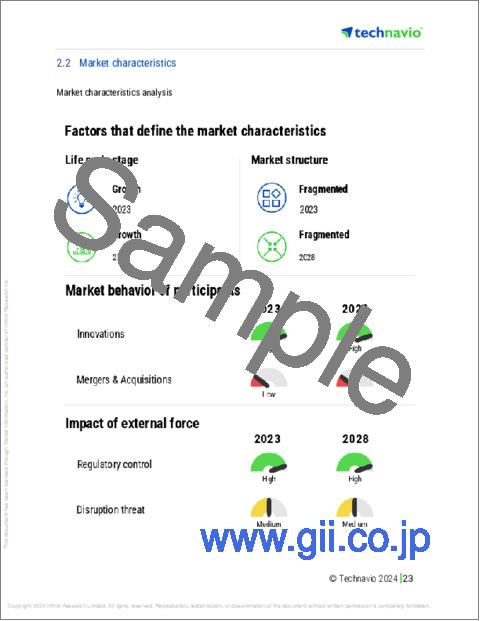
- 2.2 Market characteristics
- Market characteristics analysis
- 2.3 Value chain analysis
- Value Chain Analysis
3 Market Sizing
- 3.1 Market definition
- Offerings of companies included in the market definition
- 3.2 Market segment analysis
- Market segments
- 3.3 Market size 2023
- 3.4 Market outlook: Forecast for 2023-2028
- Chart on Global - Market size and forecast 2023-2028 ($ million)
- Data Table on Global - Market size and forecast 2023-2028 ($ million)
- Chart on Global Market: Year-over-year growth 2023-2028 (%)
- Data Table on Global Market: Year-over-year growth 2023-2028 (%)
4 Historic Market Size
- 4.1 Global X Ray Inspection Systems Technology Market 2018 - 2022
- Historic Market Size - Data Table on Global X Ray Inspection Systems Technology Market 2018 - 2022 ($ million)
- 4.2 Technology segment analysis 2018 - 2022
- Historic Market Size - Technology Segment 2018 - 2022 ($ million)
- 4.3 Geography segment analysis 2018 - 2022
- Historic Market Size - Geography Segment 2018 - 2022 ($ million)
- 4.4 Country segment analysis 2018 - 2022
- Historic Market Size - Country Segment 2018 - 2022 ($ million)
5 Five Forces Analysis
- 5.1 Five forces summary
- Five forces analysis - Comparison between 2023 and 2028
- 5.2 Bargaining power of buyers
- Bargaining power of buyers - Impact of key factors 2023 and 2028
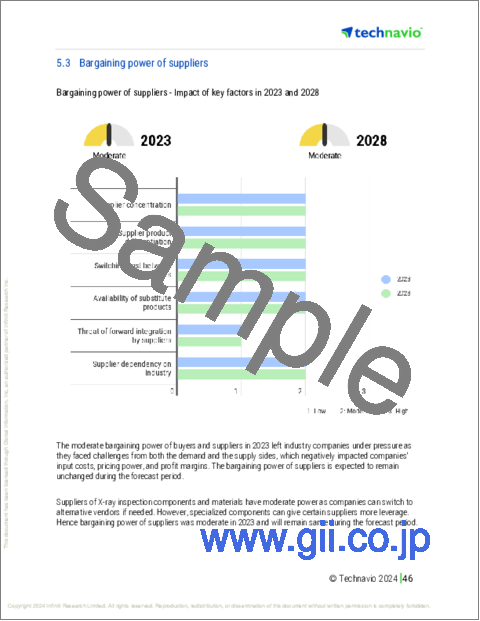
- 5.3 Bargaining power of suppliers
- Bargaining power of suppliers - Impact of key factors in 2023 and 2028
- 5.4 Threat of new entrants
- Threat of new entrants - Impact of key factors in 2023 and 2028
- 5.5 Threat of substitutes
- Threat of substitutes - Impact of key factors in 2023 and 2028
- 5.6 Threat of rivalry
- Threat of rivalry - Impact of key factors in 2023 and 2028
- 5.7 Market condition
- Chart on Market condition - Five forces 2023 and 2028
6 Market Segmentation by Technology
- 6.1 Market segments
- Chart on Technology - Market share 2023-2028 (%)
- Data Table on Technology - Market share 2023-2028 (%)
- 6.2 Comparison by Technology
- Chart on Comparison by Technology
- Data Table on Comparison by Technology
- 6.3 Flim based technology - Market size and forecast 2023-2028
- Chart on Flim based technology - Market size and forecast 2023-2028 ($ million)
- Data Table on Flim based technology - Market size and forecast 2023-2028 ($ million)
- Chart on Flim based technology - Year-over-year growth 2023-2028 (%)
- Data Table on Flim based technology - Year-over-year growth 2023-2028 (%)
- 6.4 Digital imaging technology - Market size and forecast 2023-2028
- Chart on Digital imaging technology - Market size and forecast 2023-2028 ($ million)
- Data Table on Digital imaging technology - Market size and forecast 2023-2028 ($ million)
- Chart on Digital imaging technology - Year-over-year growth 2023-2028 (%)
- Data Table on Digital imaging technology - Year-over-year growth 2023-2028 (%)
- 6.5 Market opportunity by Technology
- Market opportunity by Technology ($ million)
- Data Table on Market opportunity by Technology ($ million)
7 Customer Landscape
- 7.1 Customer landscape overview
- Analysis of price sensitivity, lifecycle, customer purchase basket, adoption rates, and purchase criteria
8 Geographic Landscape
- 8.1 Geographic segmentation
- Chart on Market share By Geographical Landscape 2023-2028 (%)
- Data Table on Market share By Geographical Landscape 2023-2028 (%)
- 8.2 Geographic comparison
- Chart on Geographic comparison
- Data Table on Geographic comparison
- 8.3 North America - Market size and forecast 2023-2028
- Chart on North America - Market size and forecast 2023-2028 ($ million)
- Data Table on North America - Market size and forecast 2023-2028 ($ million)
- Chart on North America - Year-over-year growth 2023-2028 (%)
- Data Table on North America - Year-over-year growth 2023-2028 (%)
- 8.4 Europe - Market size and forecast 2023-2028
- Chart on Europe - Market size and forecast 2023-2028 ($ million)
- Data Table on Europe - Market size and forecast 2023-2028 ($ million)
- Chart on Europe - Year-over-year growth 2023-2028 (%)
- Data Table on Europe - Year-over-year growth 2023-2028 (%)
- 8.5 Asia - Market size and forecast 2023-2028
- Chart on Asia - Market size and forecast 2023-2028 ($ million)
- Data Table on Asia - Market size and forecast 2023-2028 ($ million)
- Chart on Asia - Year-over-year growth 2023-2028 (%)
- Data Table on Asia - Year-over-year growth 2023-2028 (%)
- 8.6 Rest of World (ROW) - Market size and forecast 2023-2028
- Chart on Rest of World (ROW) - Market size and forecast 2023-2028 ($ million)
- Data Table on Rest of World (ROW) - Market size and forecast 2023-2028 ($ million)
- Chart on Rest of World (ROW) - Year-over-year growth 2023-2028 (%)
- Data Table on Rest of World (ROW) - Year-over-year growth 2023-2028 (%)
- 8.7 US - Market size and forecast 2023-2028
- Chart on US - Market size and forecast 2023-2028 ($ million)
- Data Table on US - Market size and forecast 2023-2028 ($ million)
- Chart on US - Year-over-year growth 2023-2028 (%)
- Data Table on US - Year-over-year growth 2023-2028 (%)
- 8.8 Canada - Market size and forecast 2023-2028
- Chart on Canada - Market size and forecast 2023-2028 ($ million)
- Data Table on Canada - Market size and forecast 2023-2028 ($ million)
- Chart on Canada - Year-over-year growth 2023-2028 (%)
- Data Table on Canada - Year-over-year growth 2023-2028 (%)
- 8.9 Germany - Market size and forecast 2023-2028
- Chart on Germany - Market size and forecast 2023-2028 ($ million)
- Data Table on Germany - Market size and forecast 2023-2028 ($ million)
- Chart on Germany - Year-over-year growth 2023-2028 (%)
- Data Table on Germany - Year-over-year growth 2023-2028 (%)
- 8.10 China - Market size and forecast 2023-2028
- Chart on China - Market size and forecast 2023-2028 ($ million)
- Data Table on China - Market size and forecast 2023-2028 ($ million)
- Chart on China - Year-over-year growth 2023-2028 (%)
- Data Table on China - Year-over-year growth 2023-2028 (%)
- 8.11 UK - Market size and forecast 2023-2028
- Chart on UK - Market size and forecast 2023-2028 ($ million)
- Data Table on UK - Market size and forecast 2023-2028 ($ million)
- Chart on UK - Year-over-year growth 2023-2028 (%)
- Data Table on UK - Year-over-year growth 2023-2028 (%)
- 8.12 Market opportunity By Geographical Landscape
- Market opportunity By Geographical Landscape ($ million)
- Data Tables on Market opportunity By Geographical Landscape ($ million)
9 Drivers, Challenges, and Opportunity/Restraints
- 9.1 Market drivers
- 9.2 Market challenges
- 9.3 Impact of drivers and challenges
- Impact of drivers and challenges in 2023 and 2028
- 9.4 Market opportunities/restraints
10 Competitive Landscape
- 10.1 Overview
- 10.2 Competitive Landscape
- Overview on criticality of inputs and factors of differentiation
- 10.3 Landscape disruption
- Overview on factors of disruption
- 10.4 Industry risks
- Impact of key risks on business
11 Competitive Analysis
- 11.1 Companies profiled
- Companies covered
- 11.2 Market positioning of companies
- Matrix on companies position and classification
- 3DX-RAY Ltd
- 3DX-RAY Ltd - Overview
- 3DX-RAY Ltd - Product / Service
- 3DX-RAY Ltd - Key offerings
- 11.4 COMET Technologies Inc
- COMET Technologies Inc - Overview
- COMET Technologies Inc - Product / Service
- COMET Technologies Inc - Key offerings
- 11.5 General Electric Co.
- General Electric Co. - Overview
- General Electric Co. - Business segments
- General Electric Co. - Key news
- General Electric Co. - Key offerings
- General Electric Co. - Segment focus
- 11.6 Illinois Tool Works Inc.
- Illinois Tool Works Inc. - Overview
- Illinois Tool Works Inc. - Business segments
- Illinois Tool Works Inc. - Key news
- Illinois Tool Works Inc. - Key offerings
- Illinois Tool Works Inc. - Segment focus
- 11.7 Mettler Toledo International Inc.
- Mettler Toledo International Inc. - Overview
- Mettler Toledo International Inc. - Business segments
- Mettler Toledo International Inc. - Key news
- Mettler Toledo International Inc. - Key offerings
- Mettler Toledo International Inc. - Segment focus
- 11.8 Nikon Corp.
- Nikon Corp. - Overview
- Nikon Corp. - Business segments
- Nikon Corp. - Key offerings
- Nikon Corp. - Segment focus
- 11.9 Nordson Corp.
- Nordson Corp. - Overview
- Nordson Corp. - Business segments
- Nordson Corp. - Key news
- Nordson Corp. - Key offerings
- Nordson Corp. - Segment focus
- 11.10 Smiths Group Plc
- Smiths Group Plc - Overview
- Smiths Group Plc - Business segments
- Smiths Group Plc - Key news
- Smiths Group Plc - Key offerings
- Smiths Group Plc - Segment focus
- 11.11 VisiConsult X-ray Systems and Solutions GmbH
- VisiConsult X-ray Systems and Solutions GmbH - Overview
- VisiConsult X-ray Systems and Solutions GmbH - Product / Service
- VisiConsult X-ray Systems and Solutions GmbH - Key offerings
- 11.12 VJ Group Inc.
- VJ Group Inc. - Overview
- VJ Group Inc. - Product / Service
- VJ Group Inc. - Key offerings
12 Appendix
- 12.1 Scope of the report
- 12.2 Inclusions and exclusions checklist
- Inclusions checklist
- Exclusions checklist
- 12.3 Currency conversion rates for US$
- Currency conversion rates for US$
- 12.4 Research methodology
- Research methodology
- 12.5 Data procurement
- Information sources
- 12.6 Data validation
- Data validation
- 12.7 Validation techniques employed for market sizing
- Validation techniques employed for market sizing
- 12.8 Data synthesis
- Data synthesis
- 12.9 360 degree market analysis
- 360 degree market analysis
- 12.10 List of abbreviations
- List of abbreviations

