|
|
市場調査レポート
商品コード
1603655
全身性乾癬治療薬の世界市場(2024年~2028年)Global Systemic Psoriasis Therapeutics Market 2024-2028 |
||||||

|
|||||||
カスタマイズ可能
|
|||||||

| 全身性乾癬治療薬の世界市場(2024年~2028年) |
|
出版日: 2024年10月31日
発行: TechNavio
ページ情報: 英文 213 Pages
納期: 即納可能
|

全表示
- 概要
- 図表
- 目次
全身性乾癬治療薬市場(2024年~2028年)
全身性乾癬治療薬市場は2023年~2028年に180億6,190万米ドル拡大し、予測期間中のCAGRは16.2%で成長すると予測されます。当レポートでは、全身性乾癬治療薬市場の全体的な分析、市場規模・予測、動向、成長促進要因、課題、約25のベンダーを網羅したベンダー分析などを掲載しています。
現在の市場シナリオ、最新動向と促進要因、市場環境全体に関する最新分析を提供しています。乾癬の罹患率の上昇、乾癬治療薬の新興国市場への開拓投資、パイプラインにある乾癬治療薬の存在が市場を牽引しています。
| 市場範囲 | |
|---|---|
| 基準年 | 2024年 |
| 終了年 | 2028年 |
| 予測期間 | 2024年~2028年 |
| 成長モメンタム | 加速 |
| 前年比2024年 | 14.1% |
| CAGR | 16.2% |
| 増分額 | 180億6,190万米ドル |
本調査では、今後数年間における全身性乾癬治療薬市場の成長を牽引する主な要因の1つとして、全身性乾癬の治療に光線療法が使用されることを挙げています。また、体系的な経口治療薬のイントロダクションやベンダー間の戦略的提携は、市場の大きな需要につながるであろう。
目次
第1章 エグゼクティブサマリー
- 市場概要
第2章 Technavioによる分析
- 価格・ライフサイクル・顧客購入バスケット・採用率・購入基準の分析
- インプットの重要性と差別化の要因
- 混乱の要因
- 促進要因と課題の影響
第3章 市場情勢
- 市場エコシステム
- 市場の特徴
- バリューチェーン分析
第4章 市場規模
- 市場の定義
- 市場セグメント分析
- 市場規模(2023年)
- 市場の見通し(2023年~2028年)
第5章 市場規模実績
- 全身性乾癬治療薬の世界市場(2018年~2022年)
- エンドユーザー別セグメント分析(2018年~2022年)
- 製品別セグメント分析(2018年~2022年)
- 投与経路別セグメント分析(2018年~2022年)
- 地域別セグメント分析(2018年~2022年)
- 国別セグメント分析(2018年~2022年)
第6章 定性分析
- AIの影響:全身性乾癬治療薬の世界市場
第7章 ファイブフォース分析
- ファイブフォースの要約
- 買い手の交渉力
- 供給企業の交渉力
- 新規参入業者の脅威
- 代替品の脅威
- 競争の脅威
- 市況
第8章 市場セグメンテーション:エンドユーザー別
- 市場セグメント
- 比較:エンドユーザー別
- 病院:市場規模と予測(2023年~2028年)
- 小売薬局:市場規模と予測(2023年~2028年)
- 市場機会:エンドユーザー別
第9章 市場セグメンテーション:製品別
- 市場セグメント
- 比較:製品別
- 生物学的製剤:市場規模と予測(2023年~2028年)
- 低分子:市場規模と予測(2023年~2028年)
- 市場機会:製品別
第10章 市場セグメンテーション:投与経路別
- 市場セグメント
- 比較:投与経路別
- 経口:市場規模と予測(2023年~2028年)
- 非経口:市場規模と予測(2023年~2028年)
- 市場機会:投与経路別
第11章 顧客情勢
- 顧客情勢の概要
第12章 地域別情勢
- 地域別セグメンテーション
- 地域別比較
- 北米:市場規模と予測(2023年~2028年)
- 欧州:市場規模と予測(2023年~2028年)
- アジア:市場規模と予測(2023年~2028年)
- 世界のその他の地域:市場規模と予測(2023年~2028年)
- 米国:市場規模と予測(2023年~2028年)
- ノルウェー:市場規模と予測(2023年~2028年)
- カザフスタン:市場規模と予測(2023年~2028年)
- 英国:市場規模と予測(2023年~2028年)
- ドイツ:市場規模と予測(2023年~2028年)
- フィリピン:市場規模と予測(2023年~2028年)
- インド:市場規模と予測(2023年~2028年)
- カナダ:市場規模と予測(2023年~2028年)
- ブラジル:市場規模と予測(2023年~2028年)
- スペイン:市場規模と予測(2023年~2028年)
- 市場機会:地域情勢別
第13章 促進要因・課題・機会・抑制要因
- 市場促進要因
- 市場の課題
- 促進要因と課題の影響
- 市場の機会・抑制要因
第14章 競合情勢
- 概要
- 競合情勢
- 混乱の状況
- 業界のリスク
第15章 競合分析
- 企業プロファイル
- 企業ランキング指数
- 企業の市場ポジショニング
- AbbVie Inc.
- Amgen Inc.
- AstraZeneca Plc
- Bausch Health Companies Inc.
- Boehringer Ingelheim International GmbH
- Bristol Myers Squibb Co.
- Eli Lilly and Co.
- Johnson and Johnson Services Inc.
- LEO Pharma AS
- Merck and Co. Inc.
- Novartis AG
- Pfizer Inc.
- Sun Pharmaceutical Industries Ltd.
- UCB SA
- Viatris Inc.
第16章 付録
Exhibits:
- Exhibits1: Executive Summary - Chart on Market Overview
- Exhibits2: Executive Summary - Data Table on Market Overview
- Exhibits3: Executive Summary - Chart on Global Market Characteristics
- Exhibits4: Executive Summary - Chart on Market By Geographical Landscape
- Exhibits5: Executive Summary - Chart on Market Segmentation by End-user
- Exhibits6: Executive Summary - Chart on Market Segmentation by Product
- Exhibits7: Executive Summary - Chart on Market Segmentation by Route of Administration
- Exhibits8: Executive Summary - Chart on Incremental Growth
- Exhibits9: Executive Summary - Data Table on Incremental Growth
- Exhibits10: Executive Summary - Chart on Company Market Positioning
- Exhibits11: Analysis of price sensitivity, lifecycle, customer purchase basket, adoption rates, and purchase criteria
- Exhibits12: Overview on criticality of inputs and factors of differentiation
- Exhibits13: Overview on factors of disruption
- Exhibits14: Impact of drivers and challenges in 2023 and 2028
- Exhibits15: Parent Market
- Exhibits16: Data Table on - Parent Market
- Exhibits17: Market characteristics analysis
- Exhibits18: Value Chain Analysis
- Exhibits19: Offerings of companies included in the market definition
- Exhibits20: Market segments
- Exhibits21: Chart on Global - Market size and forecast 2023-2028 ($ million)
- Exhibits22: Data Table on Global - Market size and forecast 2023-2028 ($ million)
- Exhibits23: Chart on Global Market: Year-over-year growth 2023-2028 (%)
- Exhibits24: Data Table on Global Market: Year-over-year growth 2023-2028 (%)
- Exhibits25: Historic Market Size - Data Table on Global Systemic Psoriasis Therapeutics Market 2018 - 2022 ($ million)
- Exhibits26: Historic Market Size - End-user Segment 2018 - 2022 ($ million)
- Exhibits27: Historic Market Size - Product Segment 2018 - 2022 ($ million)
- Exhibits28: Historic Market Size - Route of Administration Segment 2018 - 2022 ($ million)
- Exhibits29: Historic Market Size - Geography Segment 2018 - 2022 ($ million)
- Exhibits30: Historic Market Size - Country Segment 2018 - 2022 ($ million)
- Exhibits31: Five forces analysis - Comparison between 2023 and 2028
- Exhibits32: Bargaining power of buyers - Impact of key factors 2023 and 2028
- Exhibits33: Bargaining power of suppliers - Impact of key factors in 2023 and 2028
- Exhibits34: Threat of new entrants - Impact of key factors in 2023 and 2028
- Exhibits35: Threat of substitutes - Impact of key factors in 2023 and 2028
- Exhibits36: Threat of rivalry - Impact of key factors in 2023 and 2028
- Exhibits37: Chart on Market condition - Five forces 2023 and 2028
- Exhibits38: Chart on End-user - Market share 2023-2028 (%)
- Exhibits39: Data Table on End-user - Market share 2023-2028 (%)
- Exhibits40: Chart on Comparison by End-user
- Exhibits41: Data Table on Comparison by End-user
- Exhibits42: Chart on Hospitals - Market size and forecast 2023-2028 ($ million)
- Exhibits43: Data Table on Hospitals - Market size and forecast 2023-2028 ($ million)
- Exhibits44: Chart on Hospitals - Year-over-year growth 2023-2028 (%)
- Exhibits45: Data Table on Hospitals - Year-over-year growth 2023-2028 (%)
- Exhibits46: Chart on Retail pharmacies - Market size and forecast 2023-2028 ($ million)
- Exhibits47: Data Table on Retail pharmacies - Market size and forecast 2023-2028 ($ million)
- Exhibits48: Chart on Retail pharmacies - Year-over-year growth 2023-2028 (%)
- Exhibits49: Data Table on Retail pharmacies - Year-over-year growth 2023-2028 (%)
- Exhibits50: Market opportunity by End-user ($ million)
- Exhibits51: Data Table on Market opportunity by End-user ($ million)
- Exhibits52: Chart on Product - Market share 2023-2028 (%)
- Exhibits53: Data Table on Product - Market share 2023-2028 (%)
- Exhibits54: Chart on Comparison by Product
- Exhibits55: Data Table on Comparison by Product
- Exhibits56: Chart on Biologics - Market size and forecast 2023-2028 ($ million)
- Exhibits57: Data Table on Biologics - Market size and forecast 2023-2028 ($ million)
- Exhibits58: Chart on Biologics - Year-over-year growth 2023-2028 (%)
- Exhibits59: Data Table on Biologics - Year-over-year growth 2023-2028 (%)
- Exhibits60: Chart on Small molecules - Market size and forecast 2023-2028 ($ million)
- Exhibits61: Data Table on Small molecules - Market size and forecast 2023-2028 ($ million)
- Exhibits62: Chart on Small molecules - Year-over-year growth 2023-2028 (%)
- Exhibits63: Data Table on Small molecules - Year-over-year growth 2023-2028 (%)
- Exhibits64: Market opportunity by Product ($ million)
- Exhibits65: Data Table on Market opportunity by Product ($ million)
- Exhibits66: Chart on Route of Administration - Market share 2023-2028 (%)
- Exhibits67: Data Table on Route of Administration - Market share 2023-2028 (%)
- Exhibits68: Chart on Comparison by Route of Administration
- Exhibits69: Data Table on Comparison by Route of Administration
- Exhibits70: Chart on Oral - Market size and forecast 2023-2028 ($ million)
- Exhibits71: Data Table on Oral - Market size and forecast 2023-2028 ($ million)
- Exhibits72: Chart on Oral - Year-over-year growth 2023-2028 (%)
- Exhibits73: Data Table on Oral - Year-over-year growth 2023-2028 (%)
- Exhibits74: Chart on Parenteral - Market size and forecast 2023-2028 ($ million)
- Exhibits75: Data Table on Parenteral - Market size and forecast 2023-2028 ($ million)
- Exhibits76: Chart on Parenteral - Year-over-year growth 2023-2028 (%)
- Exhibits77: Data Table on Parenteral - Year-over-year growth 2023-2028 (%)
- Exhibits78: Market opportunity by Route of Administration ($ million)
- Exhibits79: Data Table on Market opportunity by Route of Administration ($ million)
- Exhibits80: Analysis of price sensitivity, lifecycle, customer purchase basket, adoption rates, and purchase criteria
- Exhibits81: Chart on Market share By Geographical Landscape 2023-2028 (%)
- Exhibits82: Data Table on Market share By Geographical Landscape 2023-2028 (%)
- Exhibits83: Chart on Geographic comparison
- Exhibits84: Data Table on Geographic comparison
- Exhibits85: Chart on North America - Market size and forecast 2023-2028 ($ million)
- Exhibits86: Data Table on North America - Market size and forecast 2023-2028 ($ million)
- Exhibits87: Chart on North America - Year-over-year growth 2023-2028 (%)
- Exhibits88: Data Table on North America - Year-over-year growth 2023-2028 (%)
- Exhibits89: Chart on Europe - Market size and forecast 2023-2028 ($ million)
- Exhibits90: Data Table on Europe - Market size and forecast 2023-2028 ($ million)
- Exhibits91: Chart on Europe - Year-over-year growth 2023-2028 (%)
- Exhibits92: Data Table on Europe - Year-over-year growth 2023-2028 (%)
- Exhibits93: Chart on Asia - Market size and forecast 2023-2028 ($ million)
- Exhibits94: Data Table on Asia - Market size and forecast 2023-2028 ($ million)
- Exhibits95: Chart on Asia - Year-over-year growth 2023-2028 (%)
- Exhibits96: Data Table on Asia - Year-over-year growth 2023-2028 (%)
- Exhibits97: Chart on Rest of World (ROW) - Market size and forecast 2023-2028 ($ million)
- Exhibits98: Data Table on Rest of World (ROW) - Market size and forecast 2023-2028 ($ million)
- Exhibits99: Chart on Rest of World (ROW) - Year-over-year growth 2023-2028 (%)
- Exhibits100: Data Table on Rest of World (ROW) - Year-over-year growth 2023-2028 (%)
- Exhibits101: Chart on US - Market size and forecast 2023-2028 ($ million)
- Exhibits102: Data Table on US - Market size and forecast 2023-2028 ($ million)
- Exhibits103: Chart on US - Year-over-year growth 2023-2028 (%)
- Exhibits104: Data Table on US - Year-over-year growth 2023-2028 (%)
- Exhibits105: Chart on Norway - Market size and forecast 2023-2028 ($ million)
- Exhibits106: Data Table on Norway - Market size and forecast 2023-2028 ($ million)
- Exhibits107: Chart on Norway - Year-over-year growth 2023-2028 (%)
- Exhibits108: Data Table on Norway - Year-over-year growth 2023-2028 (%)
- Exhibits109: Chart on Kazakhstan - Market size and forecast 2023-2028 ($ million)
- Exhibits110: Data Table on Kazakhstan - Market size and forecast 2023-2028 ($ million)
- Exhibits111: Chart on Kazakhstan - Year-over-year growth 2023-2028 (%)
- Exhibits112: Data Table on Kazakhstan - Year-over-year growth 2023-2028 (%)
- Exhibits113: Chart on UK - Market size and forecast 2023-2028 ($ million)
- Exhibits114: Data Table on UK - Market size and forecast 2023-2028 ($ million)
- Exhibits115: Chart on UK - Year-over-year growth 2023-2028 (%)
- Exhibits116: Data Table on UK - Year-over-year growth 2023-2028 (%)
- Exhibits117: Chart on Germany - Market size and forecast 2023-2028 ($ million)
- Exhibits118: Data Table on Germany - Market size and forecast 2023-2028 ($ million)
- Exhibits119: Chart on Germany - Year-over-year growth 2023-2028 (%)
- Exhibits120: Data Table on Germany - Year-over-year growth 2023-2028 (%)
- Exhibits121: Chart on Philippines - Market size and forecast 2023-2028 ($ million)
- Exhibits122: Data Table on Philippines - Market size and forecast 2023-2028 ($ million)
- Exhibits123: Chart on Philippines - Year-over-year growth 2023-2028 (%)
- Exhibits124: Data Table on Philippines - Year-over-year growth 2023-2028 (%)
- Exhibits125: Chart on India - Market size and forecast 2023-2028 ($ million)
- Exhibits126: Data Table on India - Market size and forecast 2023-2028 ($ million)
- Exhibits127: Chart on India - Year-over-year growth 2023-2028 (%)
- Exhibits128: Data Table on India - Year-over-year growth 2023-2028 (%)
- Exhibits129: Chart on Canada - Market size and forecast 2023-2028 ($ million)
- Exhibits130: Data Table on Canada - Market size and forecast 2023-2028 ($ million)
- Exhibits131: Chart on Canada - Year-over-year growth 2023-2028 (%)
- Exhibits132: Data Table on Canada - Year-over-year growth 2023-2028 (%)
- Exhibits133: Chart on Brazil - Market size and forecast 2023-2028 ($ million)
- Exhibits134: Data Table on Brazil - Market size and forecast 2023-2028 ($ million)
- Exhibits135: Chart on Brazil - Year-over-year growth 2023-2028 (%)
- Exhibits136: Data Table on Brazil - Year-over-year growth 2023-2028 (%)
- Exhibits137: Chart on Spain - Market size and forecast 2023-2028 ($ million)
- Exhibits138: Data Table on Spain - Market size and forecast 2023-2028 ($ million)
- Exhibits139: Chart on Spain - Year-over-year growth 2023-2028 (%)
- Exhibits140: Data Table on Spain - Year-over-year growth 2023-2028 (%)
- Exhibits141: Market opportunity By Geographical Landscape ($ million)
- Exhibits142: Data Tables on Market opportunity By Geographical Landscape ($ million)
- Exhibits143: Impact of drivers and challenges in 2023 and 2028
- Exhibits144: Overview on criticality of inputs and factors of differentiation
- Exhibits145: Overview on factors of disruption
- Exhibits146: Impact of key risks on business
- Exhibits147: Companies covered
- Exhibits148: Company ranking index
- Exhibits149: Matrix on companies position and classification
- Exhibits150: AbbVie Inc. - Overview
- Exhibits151: AbbVie Inc. - Product / Service
- Exhibits152: AbbVie Inc. - Key news
- Exhibits153: AbbVie Inc. - Key offerings
- Exhibits154: SWOT
- Exhibits155: Amgen Inc. - Overview
- Exhibits156: Amgen Inc. - Product / Service
- Exhibits157: Amgen Inc. - Key news
- Exhibits158: Amgen Inc. - Key offerings
- Exhibits159: SWOT
- Exhibits160: AstraZeneca Plc - Overview
- Exhibits161: AstraZeneca Plc - Product / Service
- Exhibits162: AstraZeneca Plc - Key news
- Exhibits163: AstraZeneca Plc - Key offerings
- Exhibits164: SWOT
- Exhibits165: Bausch Health Companies Inc. - Overview
- Exhibits166: Bausch Health Companies Inc. - Business segments
- Exhibits167: Bausch Health Companies Inc. - Key news
- Exhibits168: Bausch Health Companies Inc. - Key offerings
- Exhibits169: Bausch Health Companies Inc. - Segment focus
- Exhibits170: SWOT
- Exhibits171: Boehringer Ingelheim International GmbH - Overview
- Exhibits172: Boehringer Ingelheim International GmbH - Product / Service
- Exhibits173: Boehringer Ingelheim International GmbH - Key news
- Exhibits174: Boehringer Ingelheim International GmbH - Key offerings
- Exhibits175: SWOT
- Exhibits176: Bristol Myers Squibb Co. - Overview
- Exhibits177: Bristol Myers Squibb Co. - Product / Service
- Exhibits178: Bristol Myers Squibb Co. - Key news
- Exhibits179: Bristol Myers Squibb Co. - Key offerings
- Exhibits180: SWOT
- Exhibits181: Eli Lilly and Co. - Overview
- Exhibits182: Eli Lilly and Co. - Product / Service
- Exhibits183: Eli Lilly and Co. - Key offerings
- Exhibits184: SWOT
- Exhibits185: Johnson and Johnson Services Inc. - Overview
- Exhibits186: Johnson and Johnson Services Inc. - Business segments
- Exhibits187: Johnson and Johnson Services Inc. - Key news
- Exhibits188: Johnson and Johnson Services Inc. - Key offerings
- Exhibits189: Johnson and Johnson Services Inc. - Segment focus
- Exhibits190: SWOT
- Exhibits191: LEO Pharma AS - Overview
- Exhibits192: LEO Pharma AS - Business segments
- Exhibits193: LEO Pharma AS - Key offerings
- Exhibits194: LEO Pharma AS - Segment focus
- Exhibits195: SWOT
- Exhibits196: Merck and Co. Inc. - Overview
- Exhibits197: Merck and Co. Inc. - Business segments
- Exhibits198: Merck and Co. Inc. - Key news
- Exhibits199: Merck and Co. Inc. - Key offerings
- Exhibits200: Merck and Co. Inc. - Segment focus
- Exhibits201: SWOT
- Exhibits202: Novartis AG - Overview
- Exhibits203: Novartis AG - Business segments
- Exhibits204: Novartis AG - Key news
- Exhibits205: Novartis AG - Key offerings
- Exhibits206: Novartis AG - Segment focus
- Exhibits207: SWOT
- Exhibits208: Pfizer Inc. - Overview
- Exhibits209: Pfizer Inc. - Product / Service
- Exhibits210: Pfizer Inc. - Key news
- Exhibits211: Pfizer Inc. - Key offerings
- Exhibits212: SWOT
- Exhibits213: Sun Pharmaceutical Industries Ltd. - Overview
- Exhibits214: Sun Pharmaceutical Industries Ltd. - Product / Service
- Exhibits215: Sun Pharmaceutical Industries Ltd. - Key news
- Exhibits216: Sun Pharmaceutical Industries Ltd. - Key offerings
- Exhibits217: SWOT
- Exhibits218: UCB SA - Overview
- Exhibits219: UCB SA - Product / Service
- Exhibits220: UCB SA - Key offerings
- Exhibits221: SWOT
- Exhibits222: Viatris Inc. - Overview
- Exhibits223: Viatris Inc. - Business segments
- Exhibits224: Viatris Inc. - Key news
- Exhibits225: Viatris Inc. - Key offerings
- Exhibits226: Viatris Inc. - Segment focus
- Exhibits227: SWOT
- Exhibits228: Inclusions checklist
- Exhibits229: Exclusions checklist
- Exhibits230: Currency conversion rates for US$
- Exhibits231: Research methodology
- Exhibits232: Information sources
- Exhibits233: Data validation
- Exhibits234: Validation techniques employed for market sizing
- Exhibits235: Data synthesis
- Exhibits236: 360 degree market analysis
- Exhibits237: List of abbreviations
Systemic Psoriasis Therapeutics Market 2024-2028
The systemic psoriasis therapeutics market is forecasted to grow by USD 18061.9 mn during 2023-2028, accelerating at a CAGR of 16.2% during the forecast period. The report on the systemic psoriasis therapeutics market provides a holistic analysis, market size and forecast, trends, growth drivers, and challenges, as well as vendor analysis covering around 25 vendors.
The report offers an up-to-date analysis regarding the current market scenario, the latest trends and drivers, and the overall market environment. The market is driven by rising incidence of psoriasis, investments in development of psoriasis therapeutics, and presence of psoriasis therapeutics in pipeline.
| Market Scope | |
|---|---|
| Base Year | 2024 |
| End Year | 2028 |
| Series Year | 2024-2028 |
| Growth Momentum | Accelerate |
| YOY 2024 | 14.1% |
| CAGR | 16.2% |
| Incremental Value | $18061.9 mn |
Technavio's systemic psoriasis therapeutics market is segmented as below:
By End-user
- Hospitals
- Retail pharmacies
By Product
- Biologics
- Small molecules
By Route Of Administration
- Oral
- Parenteral
By Geographical Landscape
- North America
- Europe
- Asia
- Rest of World (ROW)
This study identifies the use of phototherapy to treat systemic psoriasis as one of the prime reasons driving the systemic psoriasis therapeutics market growth during the next few years. Also, introduction of systematic oral therapeutics and strategic partnerships among vendors will lead to sizable demand in the market.
The report on the systemic psoriasis therapeutics market covers the following areas:
- Systemic Psoriasis Therapeutics Market sizing
- Systemic Psoriasis Therapeutics Market forecast
- Systemic Psoriasis Therapeutics Market industry analysis
The robust vendor analysis is designed to help clients improve their market position, and in line with this, this report provides a detailed analysis of several leading systemic psoriasis therapeutics market vendors that include AbbVie Inc., Amgen Inc., AstraZeneca Plc, Bausch Health Companies Inc., Biogen Inc., Boehringer Ingelheim International GmbH, Bristol Myers Squibb Co., Eli Lilly and Co., GlaxoSmithKline Plc, Johnson and Johnson Services Inc., LEO Pharma AS, Merck and Co. Inc., Novartis AG, Pfizer Inc., Sun Pharmaceutical Industries Ltd., UCB SA, and Viatris Inc.. Also, the systemic psoriasis therapeutics market analysis report includes information on upcoming trends and challenges that will influence market growth. This is to help companies strategize and leverage all forthcoming growth opportunities.
The study was conducted using an objective combination of primary and secondary information including inputs from key participants in the industry. The report contains a comprehensive market and vendor landscape in addition to an analysis of the key vendors.
The publisher presents a detailed picture of the market by the way of study, synthesis, and summation of data from multiple sources by an analysis of key parameters such as profit, pricing, competition, and promotions. It presents various market facets by identifying the key industry influencers. The data presented is comprehensive, reliable, and a result of extensive primary and secondary research. The market research reports provide a complete competitive landscape and an in-depth vendor selection methodology and analysis using qualitative and quantitative research to forecast accurate market growth.
Table of Contents
1 Executive Summary
- 1.1 Market overview
- Executive Summary - Chart on Market Overview
- Executive Summary - Data Table on Market Overview
- Executive Summary - Chart on Global Market Characteristics
- Executive Summary - Chart on Market By Geographical Landscape
- Executive Summary - Chart on Market Segmentation by End-user
- Executive Summary - Chart on Market Segmentation by Product
- Executive Summary - Chart on Market Segmentation by Route of Administration
- Executive Summary - Chart on Incremental Growth
- Executive Summary - Data Table on Incremental Growth
- Executive Summary - Chart on Company Market Positioning
2 Technavio Analysis
- 2.1 Analysis of price sensitivity, lifecycle, customer purchase basket, adoption rates, and purchase criteria
- Analysis of price sensitivity, lifecycle, customer purchase basket, adoption rates, and purchase criteria
- 2.2 Criticality of inputs and Factors of differentiation
- Overview on criticality of inputs and factors of differentiation
- 2.3 Factors of disruption
- Overview on factors of disruption
- 2.4 Impact of drivers and challenges
- Impact of drivers and challenges in 2023 and 2028
3 Market Landscape
- 3.1 Market ecosystem
- Parent Market
- Data Table on - Parent Market
- 3.2 Market characteristics
- Market characteristics analysis
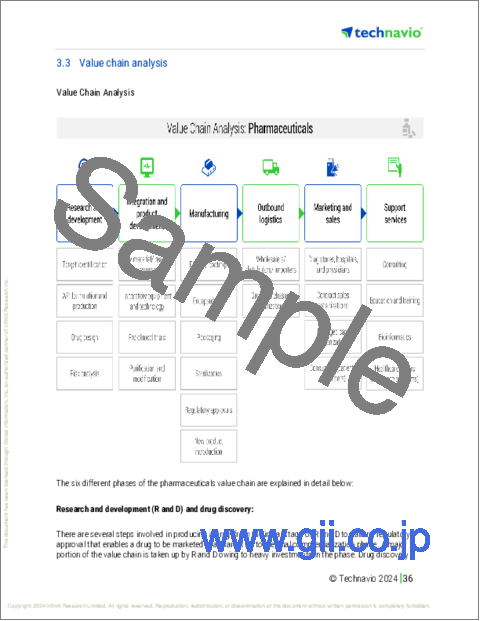
- 3.3 Value chain analysis
- Value Chain Analysis
4 Market Sizing
- 4.1 Market definition
- Offerings of companies included in the market definition
- 4.2 Market segment analysis
- Market segments
- 4.3 Market size 2023
- 4.4 Market outlook: Forecast for 2023-2028
- Chart on Global - Market size and forecast 2023-2028 ($ million)
- Data Table on Global - Market size and forecast 2023-2028 ($ million)
- Chart on Global Market: Year-over-year growth 2023-2028 (%)
- Data Table on Global Market: Year-over-year growth 2023-2028 (%)
5 Historic Market Size
- 5.1 Global Systemic Psoriasis Therapeutics Market 2018 - 2022
- Historic Market Size - Data Table on Global Systemic Psoriasis Therapeutics Market 2018 - 2022 ($ million)
- 5.2 End-user segment analysis 2018 - 2022
- Historic Market Size - End-user Segment 2018 - 2022 ($ million)
- 5.3 Product segment analysis 2018 - 2022
- Historic Market Size - Product Segment 2018 - 2022 ($ million)
- 5.4 Route of Administration segment analysis 2018 - 2022
- Historic Market Size - Route of Administration Segment 2018 - 2022 ($ million)
- 5.5 Geography segment analysis 2018 - 2022
- Historic Market Size - Geography Segment 2018 - 2022 ($ million)
- 5.6 Country segment analysis 2018 - 2022
- Historic Market Size - Country Segment 2018 - 2022 ($ million)
6 Qualitative Analysis
- 6.1 Impact of AI on the Global Systemic Psoriasis Therapeutics Market
7 Five Forces Analysis
- 7.1 Five forces summary
- Five forces analysis - Comparison between 2023 and 2028
- 7.2 Bargaining power of buyers
- Bargaining power of buyers - Impact of key factors 2023 and 2028
- 7.3 Bargaining power of suppliers
- Bargaining power of suppliers - Impact of key factors in 2023 and 2028
- 7.4 Threat of new entrants
- Threat of new entrants - Impact of key factors in 2023 and 2028
- 7.5 Threat of substitutes
- Threat of substitutes - Impact of key factors in 2023 and 2028
- 7.6 Threat of rivalry
- Threat of rivalry - Impact of key factors in 2023 and 2028
- 7.7 Market condition
- Chart on Market condition - Five forces 2023 and 2028
8 Market Segmentation by End-user
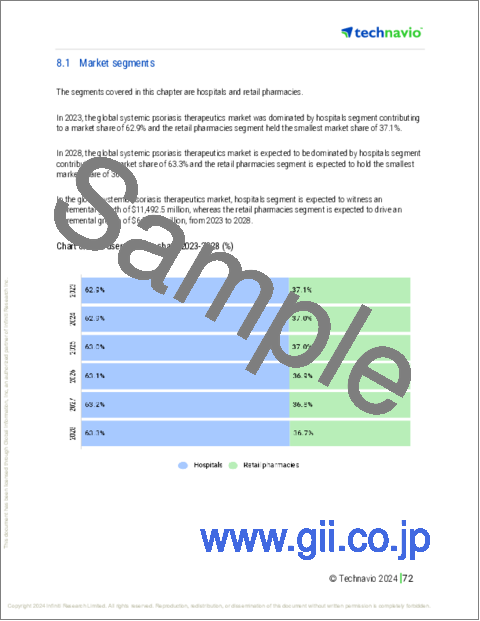
- 8.1 Market segments
- Chart on End-user - Market share 2023-2028 (%)
- Data Table on End-user - Market share 2023-2028 (%)
- 8.2 Comparison by End-user
- Chart on Comparison by End-user
- Data Table on Comparison by End-user
- 8.3 Hospitals - Market size and forecast 2023-2028
- Chart on Hospitals - Market size and forecast 2023-2028 ($ million)
- Data Table on Hospitals - Market size and forecast 2023-2028 ($ million)
- Chart on Hospitals - Year-over-year growth 2023-2028 (%)
- Data Table on Hospitals - Year-over-year growth 2023-2028 (%)
- 8.4 Retail pharmacies - Market size and forecast 2023-2028
- Chart on Retail pharmacies - Market size and forecast 2023-2028 ($ million)
- Data Table on Retail pharmacies - Market size and forecast 2023-2028 ($ million)
- Chart on Retail pharmacies - Year-over-year growth 2023-2028 (%)
- Data Table on Retail pharmacies - Year-over-year growth 2023-2028 (%)
- 8.5 Market opportunity by End-user
- Market opportunity by End-user ($ million)
- Data Table on Market opportunity by End-user ($ million)
9 Market Segmentation by Product
- 9.1 Market segments
- Chart on Product - Market share 2023-2028 (%)
- Data Table on Product - Market share 2023-2028 (%)
- 9.2 Comparison by Product
- Chart on Comparison by Product
- Data Table on Comparison by Product
- 9.3 Biologics - Market size and forecast 2023-2028
- Chart on Biologics - Market size and forecast 2023-2028 ($ million)
- Data Table on Biologics - Market size and forecast 2023-2028 ($ million)
- Chart on Biologics - Year-over-year growth 2023-2028 (%)
- Data Table on Biologics - Year-over-year growth 2023-2028 (%)
- 9.4 Small molecules - Market size and forecast 2023-2028
- Chart on Small molecules - Market size and forecast 2023-2028 ($ million)
- Data Table on Small molecules - Market size and forecast 2023-2028 ($ million)
- Chart on Small molecules - Year-over-year growth 2023-2028 (%)
- Data Table on Small molecules - Year-over-year growth 2023-2028 (%)
- 9.5 Market opportunity by Product
- Market opportunity by Product ($ million)
- Data Table on Market opportunity by Product ($ million)
10 Market Segmentation by Route of Administration
- 10.1 Market segments
- Chart on Route of Administration - Market share 2023-2028 (%)
- Data Table on Route of Administration - Market share 2023-2028 (%)
- 10.2 Comparison by Route of Administration
- Chart on Comparison by Route of Administration
- Data Table on Comparison by Route of Administration
- 10.3 Oral - Market size and forecast 2023-2028
- Chart on Oral - Market size and forecast 2023-2028 ($ million)
- Data Table on Oral - Market size and forecast 2023-2028 ($ million)
- Chart on Oral - Year-over-year growth 2023-2028 (%)
- Data Table on Oral - Year-over-year growth 2023-2028 (%)
- 10.4 Parenteral - Market size and forecast 2023-2028
- Chart on Parenteral - Market size and forecast 2023-2028 ($ million)
- Data Table on Parenteral - Market size and forecast 2023-2028 ($ million)
- Chart on Parenteral - Year-over-year growth 2023-2028 (%)
- Data Table on Parenteral - Year-over-year growth 2023-2028 (%)
- 10.5 Market opportunity by Route of Administration
- Market opportunity by Route of Administration ($ million)
- Data Table on Market opportunity by Route of Administration ($ million)
11 Customer Landscape
- 11.1 Customer landscape overview
- Analysis of price sensitivity, lifecycle, customer purchase basket, adoption rates, and purchase criteria
12 Geographic Landscape
- 12.1 Geographic segmentation
- Chart on Market share By Geographical Landscape 2023-2028 (%)
- Data Table on Market share By Geographical Landscape 2023-2028 (%)
- 12.2 Geographic comparison
- Chart on Geographic comparison
- Data Table on Geographic comparison
- 12.3 North America - Market size and forecast 2023-2028
- Chart on North America - Market size and forecast 2023-2028 ($ million)
- Data Table on North America - Market size and forecast 2023-2028 ($ million)
- Chart on North America - Year-over-year growth 2023-2028 (%)
- Data Table on North America - Year-over-year growth 2023-2028 (%)
- 12.4 Europe - Market size and forecast 2023-2028
- Chart on Europe - Market size and forecast 2023-2028 ($ million)
- Data Table on Europe - Market size and forecast 2023-2028 ($ million)
- Chart on Europe - Year-over-year growth 2023-2028 (%)
- Data Table on Europe - Year-over-year growth 2023-2028 (%)
- 12.5 Asia - Market size and forecast 2023-2028
- Chart on Asia - Market size and forecast 2023-2028 ($ million)
- Data Table on Asia - Market size and forecast 2023-2028 ($ million)
- Chart on Asia - Year-over-year growth 2023-2028 (%)
- Data Table on Asia - Year-over-year growth 2023-2028 (%)
- 12.6 Rest of World (ROW) - Market size and forecast 2023-2028
- Chart on Rest of World (ROW) - Market size and forecast 2023-2028 ($ million)
- Data Table on Rest of World (ROW) - Market size and forecast 2023-2028 ($ million)
- Chart on Rest of World (ROW) - Year-over-year growth 2023-2028 (%)
- Data Table on Rest of World (ROW) - Year-over-year growth 2023-2028 (%)
- 12.7 US - Market size and forecast 2023-2028
- Chart on US - Market size and forecast 2023-2028 ($ million)
- Data Table on US - Market size and forecast 2023-2028 ($ million)
- Chart on US - Year-over-year growth 2023-2028 (%)
- Data Table on US - Year-over-year growth 2023-2028 (%)
- 12.8 Norway - Market size and forecast 2023-2028
- Chart on Norway - Market size and forecast 2023-2028 ($ million)
- Data Table on Norway - Market size and forecast 2023-2028 ($ million)
- Chart on Norway - Year-over-year growth 2023-2028 (%)
- Data Table on Norway - Year-over-year growth 2023-2028 (%)
- 12.9 Kazakhstan - Market size and forecast 2023-2028
- Chart on Kazakhstan - Market size and forecast 2023-2028 ($ million)
- Data Table on Kazakhstan - Market size and forecast 2023-2028 ($ million)
- Chart on Kazakhstan - Year-over-year growth 2023-2028 (%)
- Data Table on Kazakhstan - Year-over-year growth 2023-2028 (%)
- 12.10 UK - Market size and forecast 2023-2028
- Chart on UK - Market size and forecast 2023-2028 ($ million)
- Data Table on UK - Market size and forecast 2023-2028 ($ million)
- Chart on UK - Year-over-year growth 2023-2028 (%)
- Data Table on UK - Year-over-year growth 2023-2028 (%)
- 12.11 Germany - Market size and forecast 2023-2028
- Chart on Germany - Market size and forecast 2023-2028 ($ million)
- Data Table on Germany - Market size and forecast 2023-2028 ($ million)
- Chart on Germany - Year-over-year growth 2023-2028 (%)
- Data Table on Germany - Year-over-year growth 2023-2028 (%)
- 12.12 Philippines - Market size and forecast 2023-2028
- Chart on Philippines - Market size and forecast 2023-2028 ($ million)
- Data Table on Philippines - Market size and forecast 2023-2028 ($ million)
- Chart on Philippines - Year-over-year growth 2023-2028 (%)
- Data Table on Philippines - Year-over-year growth 2023-2028 (%)
- 12.13 India - Market size and forecast 2023-2028
- Chart on India - Market size and forecast 2023-2028 ($ million)
- Data Table on India - Market size and forecast 2023-2028 ($ million)
- Chart on India - Year-over-year growth 2023-2028 (%)
- Data Table on India - Year-over-year growth 2023-2028 (%)
- 12.14 Canada - Market size and forecast 2023-2028
- Chart on Canada - Market size and forecast 2023-2028 ($ million)
- Data Table on Canada - Market size and forecast 2023-2028 ($ million)
- Chart on Canada - Year-over-year growth 2023-2028 (%)
- Data Table on Canada - Year-over-year growth 2023-2028 (%)
- 12.15 Brazil - Market size and forecast 2023-2028
- Chart on Brazil - Market size and forecast 2023-2028 ($ million)
- Data Table on Brazil - Market size and forecast 2023-2028 ($ million)
- Chart on Brazil - Year-over-year growth 2023-2028 (%)
- Data Table on Brazil - Year-over-year growth 2023-2028 (%)
- 12.16 Spain - Market size and forecast 2023-2028
- Chart on Spain - Market size and forecast 2023-2028 ($ million)
- Data Table on Spain - Market size and forecast 2023-2028 ($ million)
- Chart on Spain - Year-over-year growth 2023-2028 (%)
- Data Table on Spain - Year-over-year growth 2023-2028 (%)
- 12.17 Market opportunity By Geographical Landscape
- Market opportunity By Geographical Landscape ($ million)
- Data Tables on Market opportunity By Geographical Landscape ($ million)
13 Drivers, Challenges, and Opportunity/Restraints
- 13.1 Market drivers
- 13.2 Market challenges
- 13.3 Impact of drivers and challenges
- Impact of drivers and challenges in 2023 and 2028
- 13.4 Market opportunities/restraints
14 Competitive Landscape
- 14.1 Overview
- 14.2 Competitive Landscape
- Overview on criticality of inputs and factors of differentiation
- 14.3 Landscape disruption
- Overview on factors of disruption
- 14.4 Industry risks
- Impact of key risks on business
15 Competitive Analysis
- 15.1 Companies profiled
- Companies covered
- 15.2 Company ranking index
- Company ranking index
- 15.3 Market positioning of companies
- Matrix on companies position and classification
- 15.4 AbbVie Inc.
- AbbVie Inc. - Overview
- AbbVie Inc. - Product / Service
- AbbVie Inc. - Key news
- AbbVie Inc. - Key offerings
- SWOT
- 15.5 Amgen Inc.
- Amgen Inc. - Overview
- Amgen Inc. - Product / Service
- Amgen Inc. - Key news
- Amgen Inc. - Key offerings
- SWOT
- 15.6 AstraZeneca Plc
- AstraZeneca Plc - Overview
- AstraZeneca Plc - Product / Service
- AstraZeneca Plc - Key news
- AstraZeneca Plc - Key offerings
- SWOT
- 15.7 Bausch Health Companies Inc.
- Bausch Health Companies Inc. - Overview
- Bausch Health Companies Inc. - Business segments
- Bausch Health Companies Inc. - Key news
- Bausch Health Companies Inc. - Key offerings
- Bausch Health Companies Inc. - Segment focus
- SWOT
- 15.8 Boehringer Ingelheim International GmbH
- Boehringer Ingelheim International GmbH - Overview
- Boehringer Ingelheim International GmbH - Product / Service
- Boehringer Ingelheim International GmbH - Key news
- Boehringer Ingelheim International GmbH - Key offerings
- SWOT
- 15.9 Bristol Myers Squibb Co.
- Bristol Myers Squibb Co. - Overview
- Bristol Myers Squibb Co. - Product / Service
- Bristol Myers Squibb Co. - Key news
- Bristol Myers Squibb Co. - Key offerings
- SWOT
- 15.10 Eli Lilly and Co.
- Eli Lilly and Co. - Overview
- Eli Lilly and Co. - Product / Service
- Eli Lilly and Co. - Key offerings
- SWOT
- 15.11 Johnson and Johnson Services Inc.
- Johnson and Johnson Services Inc. - Overview
- Johnson and Johnson Services Inc. - Business segments
- Johnson and Johnson Services Inc. - Key news
- Johnson and Johnson Services Inc. - Key offerings
- Johnson and Johnson Services Inc. - Segment focus
- SWOT
- 15.12 LEO Pharma AS
- LEO Pharma AS - Overview
- LEO Pharma AS - Business segments
- LEO Pharma AS - Key offerings
- LEO Pharma AS - Segment focus
- SWOT
- 15.13 Merck and Co. Inc.
- Merck and Co. Inc. - Overview
- Merck and Co. Inc. - Business segments
- Merck and Co. Inc. - Key news
- Merck and Co. Inc. - Key offerings
- Merck and Co. Inc. - Segment focus
- SWOT
- 15.14 Novartis AG
- Novartis AG - Overview
- Novartis AG - Business segments
- Novartis AG - Key news
- Novartis AG - Key offerings
- Novartis AG - Segment focus
- SWOT
- 15.15 Pfizer Inc.
- Pfizer Inc. - Overview
- Pfizer Inc. - Product / Service
- Pfizer Inc. - Key news
- Pfizer Inc. - Key offerings
- SWOT
- 15.16 Sun Pharmaceutical Industries Ltd.
- Sun Pharmaceutical Industries Ltd. - Overview
- Sun Pharmaceutical Industries Ltd. - Product / Service
- Sun Pharmaceutical Industries Ltd. - Key news
- Sun Pharmaceutical Industries Ltd. - Key offerings
- SWOT
- 15.17 UCB SA
- UCB SA - Overview
- UCB SA - Product / Service
- UCB SA - Key offerings
- SWOT
- 15.18 Viatris Inc.
- Viatris Inc. - Overview
- Viatris Inc. - Business segments
- Viatris Inc. - Key news
- Viatris Inc. - Key offerings
- Viatris Inc. - Segment focus
- SWOT
16 Appendix
- 16.1 Scope of the report
- 16.2 Inclusions and exclusions checklist
- Inclusions checklist
- Exclusions checklist
- 16.3 Currency conversion rates for US$
- Currency conversion rates for US$
- 16.4 Research methodology
- Research methodology
- 16.5 Data procurement
- Information sources
- 16.6 Data validation
- Data validation
- 16.7 Validation techniques employed for market sizing
- Validation techniques employed for market sizing
- 16.8 Data synthesis
- Data synthesis
- 16.9 360 degree market analysis
- 360 degree market analysis
- 16.10 List of abbreviations
- List of abbreviations

