|
|
市場調査レポート
商品コード
1602067
敗血症診断の世界市場 (2024~2028年)Global Sepsis Diagnostics Market 2024-2028 |
||||||

|
|||||||
カスタマイズ可能
|
|||||||

| 敗血症診断の世界市場 (2024~2028年) |
|
出版日: 2024年11月06日
発行: TechNavio
ページ情報: 英文 208 Pages
納期: 即納可能
|

全表示
- 概要
- 図表
- 目次
敗血症診断市場 (2024~2028年)
敗血症診断市場は2023-2028年に5億1,000万米ドル分拡大し、予測期間中に8.9%のCAGRで成長すると予測されます。当レポートでは、敗血症診断市場の全体的な分析、市場規模・予測、動向、成長促進要因、課題、約25のベンダーを網羅したベンダー分析などを掲載しています。
当レポートでは、現在の市場シナリオ、最新動向と促進要因、市場環境全体に関する最新分析を提供しています。敗血症患者の増加、ベンダーによる投資、政府機関による啓発活動などが市場を牽引しています。
| 市場範囲 | |
|---|---|
| 基準年 | 2024年 |
| 終了年 | 2028年 |
| 予測期間 | 2024~2028年 |
| 成長モメンタム | 加速 |
| 前年比 (2024年) | 7.5% |
| CAGR | 8.9% |
| 増分額 | 5億1,000万米ドル |
当レポートでは、今後数年間における敗血症診断市場の成長を促進する主な要因の1つとして、事業提携・協力を挙げています。また、敗血症診断への高額な資金提供や技術進歩も、市場の大きな需要につながると思われます。
目次
第1章 エグゼクティブサマリー
- 市場概要
第2章 Technavioによる分析
- 価格感応度・ライフサイクル・顧客購入バスケット・採用率・購入基準の分析
- インプットの重要性と差別化の要因
- 混乱の要因
- 促進要因と課題の影響
第3章 市場情勢
- 市場エコシステム
- 市場の特徴
- バリューチェーン分析
第4章 市場規模
- 市場の定義
- 市場セグメント分析
- 市場規模 (2023年)
- 市場の見通し (2023~2028年)
第5章 市場規模実績
- 敗血症診断の世界市場 (2018~2022年)
- 種類別分析 (2018~2022年)
- 方法別分析 (2018~2022年)
- 地域別分析 (2018~2022年)
- 国別分析 (2018~2022年)
第6章 定性分析
- 人工知能 (AI) の影響:敗血症診断の世界市場
第7章 ファイブフォース分析
- ファイブフォースの要約
- 買い手の交渉力
- 供給企業の交渉力
- 新規参入業者の脅威
- 代替品の脅威
- 競争の脅威
- 市況
第8章 市場セグメンテーション:種類別
- 市場セグメント
- 比較:種類別
- 血液培養検査:市場規模と予測 (2023~2028年)
- 分子診断:市場規模と予測 (2023~2028年)
- 免疫測定:市場規模と予測 (2023~2028年)
- その他の診断検査:市場規模と予測 (2023~2028年)
- 市場機会:種類別
第9章 市場セグメンテーション:方法別
- 市場セグメント
- 比較:方法別
- 従来型診断:市場規模と予測 (2023~2028年)
- 検査室検査:市場規模と予測 (2023~2028年)
- ポイントオブケア検査 (POCT):市場規模と予測 (2023~2028年)
- 市場機会:方法別
第10章 顧客情勢
- 顧客情勢の概要
第11章 地域別情勢
- 地域別セグメンテーション
- 地域別比較
- 北米:市場規模と予測 (2023~2028年)
- 欧州:市場規模と予測 (2023~2028年)
- アジア:市場規模と予測 (2023~2028年)
- 世界のその他の地域:市場規模と予測 (2023~2028年)
- 米国:市場規模と予測 (2023~2028年)
- ドイツ:市場規模と予測 (2023~2028年)
- 英国:市場規模と予測 (2023~2028年)
- 日本:市場規模と予測 (2023~2028年)
- カナダ:市場規模と予測 (2023~2028年)
- 中国:市場規模と予測 (2023~2028年)
- フランス:市場規模と予測 (2023~2028年)
- イタリア:市場規模と予測 (2023~2028年)
- インド:市場規模と予測 (2023~2028年)
- スペイン:市場規模と予測 (2023~2028年)
- 市場機会:地域別
第12章 促進要因・課題・機会・抑制要因
- 市場促進要因
- 市場の課題
- 促進要因と課題の影響
- 市場の機会・抑制要因
第13章 競合情勢
- 概要
- 競合情勢
- 混乱の状況
- 業界のリスク
第14章 競合分析
- 企業プロファイル
- 企業ランキング指数
- 企業の市場ポジショニング
- Ad Astra Diagnostics Inc.
- ALIFAX Srl
- Becton Dickinson and Co.
- Biocartis NV
- BioMerieux SA
- Bruker Corp.
- Cytovale Inc
- Danaher Corp.
- F. Hoffmann La Roche Ltd.
- OCEAN Dx
- QuidelOrtho Corp.
- Siemens Healthineers AG
- T2 Biosystems Inc.
- Thermo Fisher Scientific Inc.
- Trinity Biotech Plc
第15章 付録
Exhibits:
- Exhibits1: Executive Summary - Chart on Market Overview
- Exhibits2: Executive Summary - Data Table on Market Overview
- Exhibits3: Executive Summary - Chart on Global Market Characteristics
- Exhibits4: Executive Summary - Chart on Market By Geographical Landscape
- Exhibits5: Executive Summary - Chart on Market Segmentation by Type
- Exhibits6: Executive Summary - Chart on Market Segmentation by Method
- Exhibits7: Executive Summary - Chart on Incremental Growth
- Exhibits8: Executive Summary - Data Table on Incremental Growth
- Exhibits9: Executive Summary - Chart on Company Market Positioning
- Exhibits10: Analysis of price sensitivity, lifecycle, customer purchase basket, adoption rates, and purchase criteria
- Exhibits11: Overview on criticality of inputs and factors of differentiation
- Exhibits12: Overview on factors of disruption
- Exhibits13: Impact of drivers and challenges in 2023 and 2028
- Exhibits14: Parent Market
- Exhibits15: Data Table on - Parent Market
- Exhibits16: Market characteristics analysis
- Exhibits17: Value Chain Analysis
- Exhibits18: Offerings of companies included in the market definition
- Exhibits19: Market segments
- Exhibits20: Chart on Global - Market size and forecast 2023-2028 ($ million)
- Exhibits21: Data Table on Global - Market size and forecast 2023-2028 ($ million)
- Exhibits22: Chart on Global Market: Year-over-year growth 2023-2028 (%)
- Exhibits23: Data Table on Global Market: Year-over-year growth 2023-2028 (%)
- Exhibits24: Historic Market Size - Data Table on Global Sepsis Diagnostics Market 2018 - 2022 ($ million)
- Exhibits25: Historic Market Size - Type Segment 2018 - 2022 ($ million)
- Exhibits26: Historic Market Size - Method Segment 2018 - 2022 ($ million)
- Exhibits27: Historic Market Size - Geography Segment 2018 - 2022 ($ million)
- Exhibits28: Historic Market Size - Country Segment 2018 - 2022 ($ million)
- Exhibits29: Five forces analysis - Comparison between 2023 and 2028
- Exhibits30: Bargaining power of buyers - Impact of key factors 2023 and 2028
- Exhibits31: Bargaining power of suppliers - Impact of key factors in 2023 and 2028
- Exhibits32: Threat of new entrants - Impact of key factors in 2023 and 2028
- Exhibits33: Threat of substitutes - Impact of key factors in 2023 and 2028
- Exhibits34: Threat of rivalry - Impact of key factors in 2023 and 2028
- Exhibits35: Chart on Market condition - Five forces 2023 and 2028
- Exhibits36: Chart on Type - Market share 2023-2028 (%)
- Exhibits37: Data Table on Type - Market share 2023-2028 (%)
- Exhibits38: Chart on Comparison by Type
- Exhibits39: Data Table on Comparison by Type
- Exhibits40: Chart on Blood culture tests - Market size and forecast 2023-2028 ($ million)
- Exhibits41: Data Table on Blood culture tests - Market size and forecast 2023-2028 ($ million)
- Exhibits42: Chart on Blood culture tests - Year-over-year growth 2023-2028 (%)
- Exhibits43: Data Table on Blood culture tests - Year-over-year growth 2023-2028 (%)
- Exhibits44: Chart on Molecular diagnostics - Market size and forecast 2023-2028 ($ million)
- Exhibits45: Data Table on Molecular diagnostics - Market size and forecast 2023-2028 ($ million)
- Exhibits46: Chart on Molecular diagnostics - Year-over-year growth 2023-2028 (%)
- Exhibits47: Data Table on Molecular diagnostics - Year-over-year growth 2023-2028 (%)
- Exhibits48: Chart on Immunoassays - Market size and forecast 2023-2028 ($ million)
- Exhibits49: Data Table on Immunoassays - Market size and forecast 2023-2028 ($ million)
- Exhibits50: Chart on Immunoassays - Year-over-year growth 2023-2028 (%)
- Exhibits51: Data Table on Immunoassays - Year-over-year growth 2023-2028 (%)
- Exhibits52: Chart on Other diagnostic tests - Market size and forecast 2023-2028 ($ million)
- Exhibits53: Data Table on Other diagnostic tests - Market size and forecast 2023-2028 ($ million)
- Exhibits54: Chart on Other diagnostic tests - Year-over-year growth 2023-2028 (%)
- Exhibits55: Data Table on Other diagnostic tests - Year-over-year growth 2023-2028 (%)
- Exhibits56: Market opportunity by Type ($ million)
- Exhibits57: Data Table on Market opportunity by Type ($ million)
- Exhibits58: Chart on Method - Market share 2023-2028 (%)
- Exhibits59: Data Table on Method - Market share 2023-2028 (%)
- Exhibits60: Chart on Comparison by Method
- Exhibits61: Data Table on Comparison by Method
- Exhibits62: Chart on Conventional diagnostics - Market size and forecast 2023-2028 ($ million)
- Exhibits63: Data Table on Conventional diagnostics - Market size and forecast 2023-2028 ($ million)
- Exhibits64: Chart on Conventional diagnostics - Year-over-year growth 2023-2028 (%)
- Exhibits65: Data Table on Conventional diagnostics - Year-over-year growth 2023-2028 (%)
- Exhibits66: Chart on Laboratory-based testing - Market size and forecast 2023-2028 ($ million)
- Exhibits67: Data Table on Laboratory-based testing - Market size and forecast 2023-2028 ($ million)
- Exhibits68: Chart on Laboratory-based testing - Year-over-year growth 2023-2028 (%)
- Exhibits69: Data Table on Laboratory-based testing - Year-over-year growth 2023-2028 (%)
- Exhibits70: Chart on Point-of-care testing (POCT) - Market size and forecast 2023-2028 ($ million)
- Exhibits71: Data Table on Point-of-care testing (POCT) - Market size and forecast 2023-2028 ($ million)
- Exhibits72: Chart on Point-of-care testing (POCT) - Year-over-year growth 2023-2028 (%)
- Exhibits73: Data Table on Point-of-care testing (POCT) - Year-over-year growth 2023-2028 (%)
- Exhibits74: Market opportunity by Method ($ million)
- Exhibits75: Data Table on Market opportunity by Method ($ million)
- Exhibits76: Analysis of price sensitivity, lifecycle, customer purchase basket, adoption rates, and purchase criteria
- Exhibits77: Chart on Market share By Geographical Landscape 2023-2028 (%)
- Exhibits78: Data Table on Market share By Geographical Landscape 2023-2028 (%)
- Exhibits79: Chart on Geographic comparison
- Exhibits80: Data Table on Geographic comparison
- Exhibits81: Chart on North America - Market size and forecast 2023-2028 ($ million)
- Exhibits82: Data Table on North America - Market size and forecast 2023-2028 ($ million)
- Exhibits83: Chart on North America - Year-over-year growth 2023-2028 (%)
- Exhibits84: Data Table on North America - Year-over-year growth 2023-2028 (%)
- Exhibits85: Chart on Europe - Market size and forecast 2023-2028 ($ million)
- Exhibits86: Data Table on Europe - Market size and forecast 2023-2028 ($ million)
- Exhibits87: Chart on Europe - Year-over-year growth 2023-2028 (%)
- Exhibits88: Data Table on Europe - Year-over-year growth 2023-2028 (%)
- Exhibits89: Chart on Asia - Market size and forecast 2023-2028 ($ million)
- Exhibits90: Data Table on Asia - Market size and forecast 2023-2028 ($ million)
- Exhibits91: Chart on Asia - Year-over-year growth 2023-2028 (%)
- Exhibits92: Data Table on Asia - Year-over-year growth 2023-2028 (%)
- Exhibits93: Chart on Rest of World (ROW) - Market size and forecast 2023-2028 ($ million)
- Exhibits94: Data Table on Rest of World (ROW) - Market size and forecast 2023-2028 ($ million)
- Exhibits95: Chart on Rest of World (ROW) - Year-over-year growth 2023-2028 (%)
- Exhibits96: Data Table on Rest of World (ROW) - Year-over-year growth 2023-2028 (%)
- Exhibits97: Chart on US - Market size and forecast 2023-2028 ($ million)
- Exhibits98: Data Table on US - Market size and forecast 2023-2028 ($ million)
- Exhibits99: Chart on US - Year-over-year growth 2023-2028 (%)
- Exhibits100: Data Table on US - Year-over-year growth 2023-2028 (%)
- Exhibits101: Chart on Germany - Market size and forecast 2023-2028 ($ million)
- Exhibits102: Data Table on Germany - Market size and forecast 2023-2028 ($ million)
- Exhibits103: Chart on Germany - Year-over-year growth 2023-2028 (%)
- Exhibits104: Data Table on Germany - Year-over-year growth 2023-2028 (%)
- Exhibits105: Chart on UK - Market size and forecast 2023-2028 ($ million)
- Exhibits106: Data Table on UK - Market size and forecast 2023-2028 ($ million)
- Exhibits107: Chart on UK - Year-over-year growth 2023-2028 (%)
- Exhibits108: Data Table on UK - Year-over-year growth 2023-2028 (%)
- Exhibits109: Chart on Japan - Market size and forecast 2023-2028 ($ million)
- Exhibits110: Data Table on Japan - Market size and forecast 2023-2028 ($ million)
- Exhibits111: Chart on Japan - Year-over-year growth 2023-2028 (%)
- Exhibits112: Data Table on Japan - Year-over-year growth 2023-2028 (%)
- Exhibits113: Chart on Canada - Market size and forecast 2023-2028 ($ million)
- Exhibits114: Data Table on Canada - Market size and forecast 2023-2028 ($ million)
- Exhibits115: Chart on Canada - Year-over-year growth 2023-2028 (%)
- Exhibits116: Data Table on Canada - Year-over-year growth 2023-2028 (%)
- Exhibits117: Chart on China - Market size and forecast 2023-2028 ($ million)
- Exhibits118: Data Table on China - Market size and forecast 2023-2028 ($ million)
- Exhibits119: Chart on China - Year-over-year growth 2023-2028 (%)
- Exhibits120: Data Table on China - Year-over-year growth 2023-2028 (%)
- Exhibits121: Chart on France - Market size and forecast 2023-2028 ($ million)
- Exhibits122: Data Table on France - Market size and forecast 2023-2028 ($ million)
- Exhibits123: Chart on France - Year-over-year growth 2023-2028 (%)
- Exhibits124: Data Table on France - Year-over-year growth 2023-2028 (%)
- Exhibits125: Chart on Italy - Market size and forecast 2023-2028 ($ million)
- Exhibits126: Data Table on Italy - Market size and forecast 2023-2028 ($ million)
- Exhibits127: Chart on Italy - Year-over-year growth 2023-2028 (%)
- Exhibits128: Data Table on Italy - Year-over-year growth 2023-2028 (%)
- Exhibits129: Chart on India - Market size and forecast 2023-2028 ($ million)
- Exhibits130: Data Table on India - Market size and forecast 2023-2028 ($ million)
- Exhibits131: Chart on India - Year-over-year growth 2023-2028 (%)
- Exhibits132: Data Table on India - Year-over-year growth 2023-2028 (%)
- Exhibits133: Chart on Spain - Market size and forecast 2023-2028 ($ million)
- Exhibits134: Data Table on Spain - Market size and forecast 2023-2028 ($ million)
- Exhibits135: Chart on Spain - Year-over-year growth 2023-2028 (%)
- Exhibits136: Data Table on Spain - Year-over-year growth 2023-2028 (%)
- Exhibits137: Market opportunity By Geographical Landscape ($ million)
- Exhibits138: Data Tables on Market opportunity By Geographical Landscape ($ million)
- Exhibits139: Impact of drivers and challenges in 2023 and 2028
- Exhibits140: Overview on criticality of inputs and factors of differentiation
- Exhibits141: Overview on factors of disruption
- Exhibits142: Impact of key risks on business
- Exhibits143: Companies covered
- Exhibits144: Company ranking index
- Exhibits145: Matrix on companies position and classification
- Exhibits146: Ad Astra Diagnostics Inc. - Overview
- Exhibits147: Ad Astra Diagnostics Inc. - Product / Service
- Exhibits148: Ad Astra Diagnostics Inc. - Key offerings
- Exhibits149: SWOT
- Exhibits150: ALIFAX Srl - Overview
- Exhibits151: ALIFAX Srl - Product / Service
- Exhibits152: ALIFAX Srl - Key offerings
- Exhibits153: SWOT
- Exhibits154: Becton Dickinson and Co. - Overview
- Exhibits155: Becton Dickinson and Co. - Business segments
- Exhibits156: Becton Dickinson and Co. - Key news
- Exhibits157: Becton Dickinson and Co. - Key offerings
- Exhibits158: Becton Dickinson and Co. - Segment focus
- Exhibits159: SWOT
- Exhibits160: Biocartis NV - Overview
- Exhibits161: Biocartis NV - Product / Service
- Exhibits162: Biocartis NV - Key news
- Exhibits163: Biocartis NV - Key offerings
- Exhibits164: SWOT
- Exhibits165: BioMerieux SA - Overview
- Exhibits166: BioMerieux SA - Business segments
- Exhibits167: BioMerieux SA - Key news
- Exhibits168: BioMerieux SA - Key offerings
- Exhibits169: BioMerieux SA - Segment focus
- Exhibits170: SWOT
- Exhibits171: Bruker Corp. - Overview
- Exhibits172: Bruker Corp. - Business segments
- Exhibits173: Bruker Corp. - Key news
- Exhibits174: Bruker Corp. - Key offerings
- Exhibits175: Bruker Corp. - Segment focus
- Exhibits176: SWOT
- Exhibits177: Cytovale Inc - Overview
- Exhibits178: Cytovale Inc - Product / Service
- Exhibits179: Cytovale Inc - Key offerings
- Exhibits180: SWOT
- Exhibits181: Danaher Corp. - Overview
- Exhibits182: Danaher Corp. - Business segments
- Exhibits183: Danaher Corp. - Key news
- Exhibits184: Danaher Corp. - Key offerings
- Exhibits185: Danaher Corp. - Segment focus
- Exhibits186: SWOT
- Exhibits187: F. Hoffmann La Roche Ltd. - Overview
- Exhibits188: F. Hoffmann La Roche Ltd. - Business segments
- Exhibits189: F. Hoffmann La Roche Ltd. - Key news
- Exhibits190: F. Hoffmann La Roche Ltd. - Key offerings
- Exhibits191: F. Hoffmann La Roche Ltd. - Segment focus
- Exhibits192: SWOT
- Exhibits193: OCEAN Dx - Overview
- Exhibits194: OCEAN Dx - Product / Service
- Exhibits195: OCEAN Dx - Key offerings
- Exhibits196: SWOT
- Exhibits197: QuidelOrtho Corp. - Overview
- Exhibits198: QuidelOrtho Corp. - Product / Service
- Exhibits199: QuidelOrtho Corp. - Key offerings
- Exhibits200: SWOT
- Exhibits201: Siemens Healthineers AG - Overview
- Exhibits202: Siemens Healthineers AG - Business segments
- Exhibits203: Siemens Healthineers AG - Key news
- Exhibits204: Siemens Healthineers AG - Key offerings
- Exhibits205: Siemens Healthineers AG - Segment focus
- Exhibits206: SWOT
- Exhibits207: T2 Biosystems Inc. - Overview
- Exhibits208: T2 Biosystems Inc. - Product / Service
- Exhibits209: T2 Biosystems Inc. - Key offerings
- Exhibits210: SWOT
- Exhibits211: Thermo Fisher Scientific Inc. - Overview
- Exhibits212: Thermo Fisher Scientific Inc. - Business segments
- Exhibits213: Thermo Fisher Scientific Inc. - Key news
- Exhibits214: Thermo Fisher Scientific Inc. - Key offerings
- Exhibits215: Thermo Fisher Scientific Inc. - Segment focus
- Exhibits216: SWOT
- Exhibits217: Trinity Biotech Plc - Overview
- Exhibits218: Trinity Biotech Plc - Product / Service
- Exhibits219: Trinity Biotech Plc - Key offerings
- Exhibits220: SWOT
- Exhibits221: Inclusions checklist
- Exhibits222: Exclusions checklist
- Exhibits223: Currency conversion rates for US$
- Exhibits224: Research methodology
- Exhibits225: Information sources
- Exhibits226: Data validation
- Exhibits227: Validation techniques employed for market sizing
- Exhibits228: Data synthesis
- Exhibits229: 360 degree market analysis
- Exhibits230: List of abbreviations
Sepsis Diagnostics Market 2024-2028
The sepsis diagnostics market is forecasted to grow by USD 510 mn during 2023-2028, accelerating at a CAGR of 8.9% during the forecast period. The report on the sepsis diagnostics market provides a holistic analysis, market size and forecast, trends, growth drivers, and challenges, as well as vendor analysis covering around 25 vendors.
The report offers an up-to-date analysis regarding the current market scenario, the latest trends and drivers, and the overall market environment. The market is driven by increasing number of sepsis cases, investment by vendors, and awareness initiatives by government bodies.
| Market Scope | |
|---|---|
| Base Year | 2024 |
| End Year | 2028 |
| Series Year | 2024-2028 |
| Growth Momentum | Accelerate |
| YOY 2024 | 7.5% |
| CAGR | 8.9% |
| Incremental Value | $510 mn |
Technavio's sepsis diagnostics market is segmented as below:
By Type
- Blood culture tests
- Molecular diagnostics
- Immunoassays
- Other diagnostic tests
By Method
- Conventional diagnostics
- Laboratory-based testing
- Point-of-care testing (POCT)
By Geographical Landscape
- North America
- Europe
- Asia
- Rest of World (ROW)
This study identifies the partnerships and collaborations as one of the prime reasons driving the sepsis diagnostics market growth during the next few years. Also, high funding for sepsis diagnostics and advancements in technology will lead to sizable demand in the market.
The report on the sepsis diagnostics market covers the following areas:
- Sepsis Diagnostics Market sizing
- Sepsis Diagnostics Market forecast
- Sepsis Diagnostics Market industry analysis
The robust vendor analysis is designed to help clients improve their market position, and in line with this, this report provides a detailed analysis of several leading sepsis diagnostics market vendors that include Ad Astra Diagnostics Inc., ALIFAX Srl, Becton Dickinson and Co., Biocartis NV, BioMerieux SA, Bruker Corp., Cytovale Inc, Danaher Corp., F. Hoffmann La Roche Ltd., Loop Diagnostics, OCEAN Dx, QuantaMatrix Inc, QuidelOrtho Corp., Siemens Healthineers AG, T2 Biosystems Inc., Thermo Fisher Scientific Inc., and Trinity Biotech Plc. Also, the sepsis diagnostics market analysis report includes information on upcoming trends and challenges that will influence market growth. This is to help companies strategize and leverage all forthcoming growth opportunities.
The study was conducted using an objective combination of primary and secondary information including inputs from key participants in the industry. The report contains a comprehensive market and vendor landscape in addition to an analysis of the key vendors.
The publisher presents a detailed picture of the market by the way of study, synthesis, and summation of data from multiple sources by an analysis of key parameters such as profit, pricing, competition, and promotions. It presents various market facets by identifying the key industry influencers. The data presented is comprehensive, reliable, and a result of extensive primary and secondary research. The market research reports provide a complete competitive landscape and an in-depth vendor selection methodology and analysis using qualitative and quantitative research to forecast accurate market growth.
Table of Contents
1 Executive Summary
- 1.1 Market overview
- Executive Summary - Chart on Market Overview
- Executive Summary - Data Table on Market Overview
- Executive Summary - Chart on Global Market Characteristics
- Executive Summary - Chart on Market By Geographical Landscape
- Executive Summary - Chart on Market Segmentation by Type
- Executive Summary - Chart on Market Segmentation by Method
- Executive Summary - Chart on Incremental Growth
- Executive Summary - Data Table on Incremental Growth
- Executive Summary - Chart on Company Market Positioning
2 Technavio Analysis
- 2.1 Analysis of price sensitivity, lifecycle, customer purchase basket, adoption rates, and purchase criteria
- Analysis of price sensitivity, lifecycle, customer purchase basket, adoption rates, and purchase criteria
- 2.2 Criticality of inputs and Factors of differentiation
- Overview on criticality of inputs and factors of differentiation
- 2.3 Factors of disruption
- Overview on factors of disruption
- 2.4 Impact of drivers and challenges
- Impact of drivers and challenges in 2023 and 2028
3 Market Landscape
- 3.1 Market ecosystem
- Parent Market
- Data Table on - Parent Market
- 3.2 Market characteristics
- Market characteristics analysis
- 3.3 Value chain analysis
- Value Chain Analysis
4 Market Sizing
- 4.1 Market definition
- Offerings of companies included in the market definition
- 4.2 Market segment analysis
- Market segments
- 4.3 Market size 2023
- 4.4 Market outlook: Forecast for 2023-2028
- Chart on Global - Market size and forecast 2023-2028 ($ million)
- Data Table on Global - Market size and forecast 2023-2028 ($ million)
- Chart on Global Market: Year-over-year growth 2023-2028 (%)
- Data Table on Global Market: Year-over-year growth 2023-2028 (%)
5 Historic Market Size
- 5.1 Global Sepsis Diagnostics Market 2018 - 2022
- Historic Market Size - Data Table on Global Sepsis Diagnostics Market 2018 - 2022 ($ million)
- 5.2 Type segment analysis 2018 - 2022
- Historic Market Size - Type Segment 2018 - 2022 ($ million)
- 5.3 Method segment analysis 2018 - 2022
- Historic Market Size - Method Segment 2018 - 2022 ($ million)
- 5.4 Geography segment analysis 2018 - 2022
- Historic Market Size - Geography Segment 2018 - 2022 ($ million)
- 5.5 Country segment analysis 2018 - 2022
- Historic Market Size - Country Segment 2018 - 2022 ($ million)
6 Qualitative Analysis
- 6.1 Impact of Artificial intelligence (AI) on global sepsis diagnostics market
7 Five Forces Analysis
- 7.1 Five forces summary
- Five forces analysis - Comparison between 2023 and 2028
- 7.2 Bargaining power of buyers
- Bargaining power of buyers - Impact of key factors 2023 and 2028
- 7.3 Bargaining power of suppliers
- Bargaining power of suppliers - Impact of key factors in 2023 and 2028
- 7.4 Threat of new entrants
- Threat of new entrants - Impact of key factors in 2023 and 2028
- 7.5 Threat of substitutes
- Threat of substitutes - Impact of key factors in 2023 and 2028
- 7.6 Threat of rivalry
- Threat of rivalry - Impact of key factors in 2023 and 2028
- 7.7 Market condition
- Chart on Market condition - Five forces 2023 and 2028
8 Market Segmentation by Type
- 8.1 Market segments
- Chart on Type - Market share 2023-2028 (%)
- Data Table on Type - Market share 2023-2028 (%)
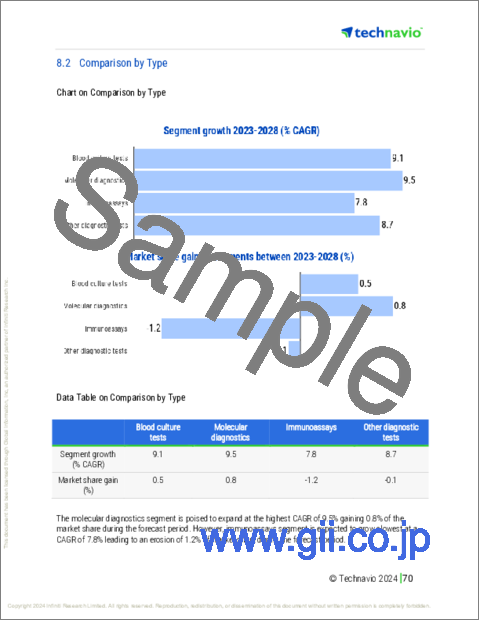
- 8.2 Comparison by Type
- Chart on Comparison by Type
- Data Table on Comparison by Type
- 8.3 Blood culture tests - Market size and forecast 2023-2028
- Chart on Blood culture tests - Market size and forecast 2023-2028 ($ million)
- Data Table on Blood culture tests - Market size and forecast 2023-2028 ($ million)
- Chart on Blood culture tests - Year-over-year growth 2023-2028 (%)
- Data Table on Blood culture tests - Year-over-year growth 2023-2028 (%)
- 8.4 Molecular diagnostics - Market size and forecast 2023-2028
- Chart on Molecular diagnostics - Market size and forecast 2023-2028 ($ million)
- Data Table on Molecular diagnostics - Market size and forecast 2023-2028 ($ million)
- Chart on Molecular diagnostics - Year-over-year growth 2023-2028 (%)
- Data Table on Molecular diagnostics - Year-over-year growth 2023-2028 (%)
- 8.5 Immunoassays - Market size and forecast 2023-2028
- Chart on Immunoassays - Market size and forecast 2023-2028 ($ million)
- Data Table on Immunoassays - Market size and forecast 2023-2028 ($ million)
- Chart on Immunoassays - Year-over-year growth 2023-2028 (%)
- Data Table on Immunoassays - Year-over-year growth 2023-2028 (%)
- 8.6 Other diagnostic tests - Market size and forecast 2023-2028
- Chart on Other diagnostic tests - Market size and forecast 2023-2028 ($ million)
- Data Table on Other diagnostic tests - Market size and forecast 2023-2028 ($ million)
- Chart on Other diagnostic tests - Year-over-year growth 2023-2028 (%)
- Data Table on Other diagnostic tests - Year-over-year growth 2023-2028 (%)
- 8.7 Market opportunity by Type
- Market opportunity by Type ($ million)
- Data Table on Market opportunity by Type ($ million)
9 Market Segmentation by Method
- 9.1 Market segments
- Chart on Method - Market share 2023-2028 (%)
- Data Table on Method - Market share 2023-2028 (%)
- 9.2 Comparison by Method
- Chart on Comparison by Method
- Data Table on Comparison by Method
- 9.3 Conventional diagnostics - Market size and forecast 2023-2028
- Chart on Conventional diagnostics - Market size and forecast 2023-2028 ($ million)
- Data Table on Conventional diagnostics - Market size and forecast 2023-2028 ($ million)
- Chart on Conventional diagnostics - Year-over-year growth 2023-2028 (%)
- Data Table on Conventional diagnostics - Year-over-year growth 2023-2028 (%)
- 9.4 Laboratory-based testing - Market size and forecast 2023-2028
- Chart on Laboratory-based testing - Market size and forecast 2023-2028 ($ million)
- Data Table on Laboratory-based testing - Market size and forecast 2023-2028 ($ million)
- Chart on Laboratory-based testing - Year-over-year growth 2023-2028 (%)
- Data Table on Laboratory-based testing - Year-over-year growth 2023-2028 (%)
- 9.5 Point-of-care testing (POCT) - Market size and forecast 2023-2028
- Chart on Point-of-care testing (POCT) - Market size and forecast 2023-2028 ($ million)
- Data Table on Point-of-care testing (POCT) - Market size and forecast 2023-2028 ($ million)
- Chart on Point-of-care testing (POCT) - Year-over-year growth 2023-2028 (%)
- Data Table on Point-of-care testing (POCT) - Year-over-year growth 2023-2028 (%)
- 9.6 Market opportunity by Method
- Market opportunity by Method ($ million)
- Data Table on Market opportunity by Method ($ million)
10 Customer Landscape
- 10.1 Customer landscape overview
- Analysis of price sensitivity, lifecycle, customer purchase basket, adoption rates, and purchase criteria
11 Geographic Landscape
- 11.1 Geographic segmentation
- Chart on Market share By Geographical Landscape 2023-2028 (%)
- Data Table on Market share By Geographical Landscape 2023-2028 (%)
- 11.2 Geographic comparison
- Chart on Geographic comparison
- Data Table on Geographic comparison
- 11.3 North America - Market size and forecast 2023-2028
- Chart on North America - Market size and forecast 2023-2028 ($ million)
- Data Table on North America - Market size and forecast 2023-2028 ($ million)
- Chart on North America - Year-over-year growth 2023-2028 (%)
- Data Table on North America - Year-over-year growth 2023-2028 (%)
- 11.4 Europe - Market size and forecast 2023-2028
- Chart on Europe - Market size and forecast 2023-2028 ($ million)
- Data Table on Europe - Market size and forecast 2023-2028 ($ million)
- Chart on Europe - Year-over-year growth 2023-2028 (%)
- Data Table on Europe - Year-over-year growth 2023-2028 (%)
- 11.5 Asia - Market size and forecast 2023-2028
- Chart on Asia - Market size and forecast 2023-2028 ($ million)
- Data Table on Asia - Market size and forecast 2023-2028 ($ million)
- Chart on Asia - Year-over-year growth 2023-2028 (%)
- Data Table on Asia - Year-over-year growth 2023-2028 (%)
- 11.6 Rest of World (ROW) - Market size and forecast 2023-2028
- Chart on Rest of World (ROW) - Market size and forecast 2023-2028 ($ million)
- Data Table on Rest of World (ROW) - Market size and forecast 2023-2028 ($ million)
- Chart on Rest of World (ROW) - Year-over-year growth 2023-2028 (%)
- Data Table on Rest of World (ROW) - Year-over-year growth 2023-2028 (%)
- 11.7 US - Market size and forecast 2023-2028
- Chart on US - Market size and forecast 2023-2028 ($ million)
- Data Table on US - Market size and forecast 2023-2028 ($ million)
- Chart on US - Year-over-year growth 2023-2028 (%)
- Data Table on US - Year-over-year growth 2023-2028 (%)
- 11.8 Germany - Market size and forecast 2023-2028
- Chart on Germany - Market size and forecast 2023-2028 ($ million)
- Data Table on Germany - Market size and forecast 2023-2028 ($ million)
- Chart on Germany - Year-over-year growth 2023-2028 (%)
- Data Table on Germany - Year-over-year growth 2023-2028 (%)
- 11.9 UK - Market size and forecast 2023-2028
- Chart on UK - Market size and forecast 2023-2028 ($ million)
- Data Table on UK - Market size and forecast 2023-2028 ($ million)
- Chart on UK - Year-over-year growth 2023-2028 (%)
- Data Table on UK - Year-over-year growth 2023-2028 (%)
- 11.10 Japan - Market size and forecast 2023-2028
- Chart on Japan - Market size and forecast 2023-2028 ($ million)
- Data Table on Japan - Market size and forecast 2023-2028 ($ million)
- Chart on Japan - Year-over-year growth 2023-2028 (%)
- Data Table on Japan - Year-over-year growth 2023-2028 (%)
- 11.11 Canada - Market size and forecast 2023-2028
- Chart on Canada - Market size and forecast 2023-2028 ($ million)
- Data Table on Canada - Market size and forecast 2023-2028 ($ million)
- Chart on Canada - Year-over-year growth 2023-2028 (%)
- Data Table on Canada - Year-over-year growth 2023-2028 (%)
- 11.12 China - Market size and forecast 2023-2028
- Chart on China - Market size and forecast 2023-2028 ($ million)
- Data Table on China - Market size and forecast 2023-2028 ($ million)
- Chart on China - Year-over-year growth 2023-2028 (%)
- Data Table on China - Year-over-year growth 2023-2028 (%)
- 11.13 France - Market size and forecast 2023-2028
- Chart on France - Market size and forecast 2023-2028 ($ million)
- Data Table on France - Market size and forecast 2023-2028 ($ million)
- Chart on France - Year-over-year growth 2023-2028 (%)
- Data Table on France - Year-over-year growth 2023-2028 (%)
- 11.14 Italy - Market size and forecast 2023-2028
- Chart on Italy - Market size and forecast 2023-2028 ($ million)
- Data Table on Italy - Market size and forecast 2023-2028 ($ million)
- Chart on Italy - Year-over-year growth 2023-2028 (%)
- Data Table on Italy - Year-over-year growth 2023-2028 (%)
- 11.15 India - Market size and forecast 2023-2028
- Chart on India - Market size and forecast 2023-2028 ($ million)
- Data Table on India - Market size and forecast 2023-2028 ($ million)
- Chart on India - Year-over-year growth 2023-2028 (%)
- Data Table on India - Year-over-year growth 2023-2028 (%)
- 11.16 Spain - Market size and forecast 2023-2028
- Chart on Spain - Market size and forecast 2023-2028 ($ million)
- Data Table on Spain - Market size and forecast 2023-2028 ($ million)
- Chart on Spain - Year-over-year growth 2023-2028 (%)
- Data Table on Spain - Year-over-year growth 2023-2028 (%)
- 11.17 Market opportunity By Geographical Landscape
- Market opportunity By Geographical Landscape ($ million)
- Data Tables on Market opportunity By Geographical Landscape ($ million)
12 Drivers, Challenges, and Opportunity/Restraints
- 12.1 Market drivers
- 12.2 Market challenges
- 12.3 Impact of drivers and challenges
- Impact of drivers and challenges in 2023 and 2028
- 12.4 Market opportunities/restraints
13 Competitive Landscape
- 13.1 Overview
- 13.2 Competitive Landscape
- Overview on criticality of inputs and factors of differentiation
- 13.3 Landscape disruption
- Overview on factors of disruption
- 13.4 Industry risks
- Impact of key risks on business
14 Competitive Analysis
- 14.1 Companies profiled
- Companies covered
- 14.2 Company ranking index
- Company ranking index
- 14.3 Market positioning of companies
- Matrix on companies position and classification
- 14.4 Ad Astra Diagnostics Inc.
- Ad Astra Diagnostics Inc. - Overview
- Ad Astra Diagnostics Inc. - Product / Service
- Ad Astra Diagnostics Inc. - Key offerings
- SWOT
- 14.5 ALIFAX Srl
- ALIFAX Srl - Overview
- ALIFAX Srl - Product / Service
- ALIFAX Srl - Key offerings
- SWOT
- 14.6 Becton Dickinson and Co.
- Becton Dickinson and Co. - Overview
- Becton Dickinson and Co. - Business segments
- Becton Dickinson and Co. - Key news
- Becton Dickinson and Co. - Key offerings
- Becton Dickinson and Co. - Segment focus
- SWOT
- 14.7 Biocartis NV
- Biocartis NV - Overview
- Biocartis NV - Product / Service
- Biocartis NV - Key news
- Biocartis NV - Key offerings
- SWOT
- 14.8 BioMerieux SA
- BioMerieux SA - Overview
- BioMerieux SA - Business segments
- BioMerieux SA - Key news
- BioMerieux SA - Key offerings
- BioMerieux SA - Segment focus
- SWOT
- 14.9 Bruker Corp.
- Bruker Corp. - Overview
- Bruker Corp. - Business segments
- Bruker Corp. - Key news
- Bruker Corp. - Key offerings
- Bruker Corp. - Segment focus
- SWOT
- 14.10 Cytovale Inc
- Cytovale Inc - Overview
- Cytovale Inc - Product / Service
- Cytovale Inc - Key offerings
- SWOT
- 14.11 Danaher Corp.
- Danaher Corp. - Overview
- Danaher Corp. - Business segments
- Danaher Corp. - Key news
- Danaher Corp. - Key offerings
- Danaher Corp. - Segment focus
- SWOT
- 14.12 F. Hoffmann La Roche Ltd.
- F. Hoffmann La Roche Ltd. - Overview
- F. Hoffmann La Roche Ltd. - Business segments
- F. Hoffmann La Roche Ltd. - Key news
- F. Hoffmann La Roche Ltd. - Key offerings
- F. Hoffmann La Roche Ltd. - Segment focus
- SWOT
- 14.13 OCEAN Dx
- OCEAN Dx - Overview
- OCEAN Dx - Product / Service
- OCEAN Dx - Key offerings
- SWOT
- 14.14 QuidelOrtho Corp.
- QuidelOrtho Corp. - Overview
- QuidelOrtho Corp. - Product / Service
- QuidelOrtho Corp. - Key offerings
- SWOT
- 14.15 Siemens Healthineers AG
- Siemens Healthineers AG - Overview
- Siemens Healthineers AG - Business segments
- Siemens Healthineers AG - Key news
- Siemens Healthineers AG - Key offerings
- Siemens Healthineers AG - Segment focus
- SWOT
- 14.16 T2 Biosystems Inc.
- T2 Biosystems Inc. - Overview
- T2 Biosystems Inc. - Product / Service
- T2 Biosystems Inc. - Key offerings
- SWOT
- 14.17 Thermo Fisher Scientific Inc.
- Thermo Fisher Scientific Inc. - Overview
- Thermo Fisher Scientific Inc. - Business segments
- Thermo Fisher Scientific Inc. - Key news
- Thermo Fisher Scientific Inc. - Key offerings
- Thermo Fisher Scientific Inc. - Segment focus
- SWOT
- 14.18 Trinity Biotech Plc
- Trinity Biotech Plc - Overview
- Trinity Biotech Plc - Product / Service
- Trinity Biotech Plc - Key offerings
- SWOT
15 Appendix
- 15.1 Scope of the report
- 15.2 Inclusions and exclusions checklist
- Inclusions checklist
- Exclusions checklist
- 15.3 Currency conversion rates for US$
- Currency conversion rates for US$
- 15.4 Research methodology
- Research methodology
- 15.5 Data procurement
- Information sources
- 15.6 Data validation
- Data validation
- 15.7 Validation techniques employed for market sizing
- Validation techniques employed for market sizing
- 15.8 Data synthesis
- Data synthesis
- 15.9 360 degree market analysis
- 360 degree market analysis
- 15.10 List of abbreviations
- List of abbreviations
- Cutting-edge diagnostic platforms and innovative technologies
- Expansion of point-of-care testing solutions and biomarker-based diagnostic tools
- Company is known for specialized diagnostic solutions in areas like immunoassays and microbial diagnostics
- Comprehensive diagnostic portfolio
- Increasing global focus on early detection of sepsis
- Increasingly investing in molecular diagnostics and biomarker-based testing
- Global leader in microbial diagnostics
- Growing demand for rapid diagnostics in sepsis detection
- Strong focus on research and development
- Cutting-edge diagnostic platforms and innovative technologies
- Comprehensive diagnostic portfolio
- Strong focus on research and development
- Cutting-edge diagnostic platforms and innovative technologies
- Strong focus on innovation, including AI-driven diagnostics and automation
- Strong focus on research and development
- Cutting-edge diagnostic platforms and innovative technologies
- Strong focus on research and development

