|
|
市場調査レポート
商品コード
1602065
LNGインフラの世界市場(2024年~2028年)Global LNG Infrastructure Market 2024-2028 |
||||||

|
|||||||
カスタマイズ可能
|
|||||||

| LNGインフラの世界市場(2024年~2028年) |
|
出版日: 2024年11月06日
発行: TechNavio
ページ情報: 英文 162 Pages
納期: 即納可能
|

全表示
- 概要
- 図表
- 目次
LNGインフラ市場(2024年~2028年)
LNGインフラ市場は2023年~2028年に46億6,850万米ドル拡大し、予測期間中のCAGRは6%で成長すると予測されます。当レポートでは、LNGインフラ市場の全体的な分析、市場規模・予測、動向、成長促進要因、課題、約25のベンダーを網羅したベンダー分析などを掲載しています。
現在の市場シナリオ、最新動向と促進要因、市場環境全体に関する最新分析を提供しています。市場は、よりクリーンな燃料への需要の増加、LNG液化能力の増加、政府の有利な取り組みによって牽引されています。
| 市場範囲 | |
|---|---|
| 基準年 | 2024年 |
| 終了年 | 2028年 |
| 予測期間 | 2024年~2028年 |
| 成長モメンタム | 加速 |
| 前年比2024年 | 5.6% |
| CAGR | 6% |
| 増分額 | 46億6,850万米ドル |
本調査では、今後数年間のLNGインフラ市場の成長を促進する主な理由の1つとして、LNGバンカリング需要の増加を挙げています。また、浮体式LNG技術の採用が増加し、内陸部での給油インフラが拡大することで、同市場は大きな需要が見込まれます。
目次
第1章 エグゼクティブサマリー
- 市場概要
第2章 Technavioによる分析
- 価格・ライフサイクル・顧客購入バスケット・採用率・購入基準の分析
- インプットの重要性と差別化の要因
- 混乱の要因
- 促進要因と課題の影響
第3章 市場情勢
- 市場エコシステム
- 市場の特徴
- バリューチェーン分析
第4章 市場規模
- 市場の定義
- 市場セグメント分析
- 市場規模(2023年)
- 市場の見通し(2023年~2028年)
第5章 市場規模実績
- 世界のLNGインフラ市場(2018年~2022年)
- タイプ別セグメント分析(2018年~2022年)
- 地域別セグメント分析(2018年~2022年)
- 国別セグメント分析(2018年~2022年)
第6章 ファイブフォース分析
- ファイブフォースの要約
- 買い手の交渉力
- 供給企業の交渉力
- 新規参入業者の脅威
- 代替品の脅威
- 競争の脅威
- 市況
第7章 市場セグメンテーション:タイプ別
- 市場セグメント
- 比較:タイプ別
- 液化ターミナル:市場規模と予測(2023年~2028年)
- 再ガス化ターミナル:市場規模と予測(2023年~2028年)
- 市場機会:タイプ別
第8章 顧客情勢
- 顧客情勢の概要
第9章 地域別情勢
- 地域別セグメンテーション
- 地域別比較
- 北米:市場規模と予測(2023年~2028年)
- アジア太平洋:市場規模と予測(2023年~2028年)
- 欧州:市場規模と予測(2023年~2028年)
- 中東・アフリカ:市場規模と予測(2023年~2028年)
- 南米:市場規模と予測(2023年~2028年)
- 米国:市場規模と予測(2023年~2028年)
- 中国:市場規模と予測(2023年~2028年)
- 日本:市場規模と予測(2023年~2028年)
- インド:市場規模と予測(2023年~2028年)
- ロシア:市場規模と予測(2023年~2028年)
- カナダ:市場規模と予測(2023年~2028年)
- ドイツ:市場規模と予測(2023年~2028年)
- アラブ首長国連邦:市場規模と予測(2023年~2028年)
- サウジアラビア:市場規模と予測(2023年~2028年)
- ブラジル:市場規模と予測(2023年~2028年)
- 市場機会:地域情勢別
第10章 促進要因・課題・機会・抑制要因
- 市場促進要因
- 市場の課題
- 促進要因と課題の影響
- 市場の機会・抑制要因
第11章 競合情勢
- 概要
- 競合情勢
- 混乱の状況
- 業界のリスク
第12章 競合分析
- 企業プロファイル
- 企業ランキング指数
- 企業の市場ポジショニング
- Bechtel Corp.
- Chiyoda Corp.
- Exxon Mobil Corp.
- Fluor Corp.
- JGC Holdings Corp.
- John Wood Group PLC
- McDermott International Ltd.
- Shell plc
- Saipem S.p.A.
- Sempra Energy
第13章 付録
Exhibits:
- Exhibits1: Executive Summary - Chart on Market Overview
- Exhibits2: Executive Summary - Data Table on Market Overview
- Exhibits3: Executive Summary - Chart on Global Market Characteristics
- Exhibits4: Executive Summary - Chart on Market By Geographical Landscape
- Exhibits5: Executive Summary - Chart on Market Segmentation by Type
- Exhibits6: Executive Summary - Chart on Incremental Growth
- Exhibits7: Executive Summary - Data Table on Incremental Growth
- Exhibits8: Executive Summary - Chart on Company Market Positioning
- Exhibits9: Analysis of price sensitivity, lifecycle, customer purchase basket, adoption rates, and purchase criteria
- Exhibits10: Overview on criticality of inputs and factors of differentiation
- Exhibits11: Overview on factors of disruption
- Exhibits12: Impact of drivers and challenges in 2023 and 2028
- Exhibits13: Parent Market
- Exhibits14: Data Table on - Parent Market
- Exhibits15: Market characteristics analysis
- Exhibits16: Value Chain Analysis
- Exhibits17: Offerings of companies included in the market definition
- Exhibits18: Market segments
- Exhibits19: Chart on Global - Market size and forecast 2023-2028 ($ million)
- Exhibits20: Data Table on Global - Market size and forecast 2023-2028 ($ million)
- Exhibits21: Chart on Global Market: Year-over-year growth 2023-2028 (%)
- Exhibits22: Data Table on Global Market: Year-over-year growth 2023-2028 (%)
- Exhibits23: Historic Market Size - Data Table on Global LNG Infrastructure Market 2018 - 2022 ($ million)
- Exhibits24: Historic Market Size - Type Segment 2018 - 2022 ($ million)
- Exhibits25: Historic Market Size - Geography Segment 2018 - 2022 ($ million)
- Exhibits26: Historic Market Size - Country Segment 2018 - 2022 ($ million)
- Exhibits27: Five forces analysis - Comparison between 2023 and 2028
- Exhibits28: Bargaining power of buyers - Impact of key factors 2023 and 2028
- Exhibits29: Bargaining power of suppliers - Impact of key factors in 2023 and 2028
- Exhibits30: Threat of new entrants - Impact of key factors in 2023 and 2028
- Exhibits31: Threat of substitutes - Impact of key factors in 2023 and 2028
- Exhibits32: Threat of rivalry - Impact of key factors in 2023 and 2028
- Exhibits33: Chart on Market condition - Five forces 2023 and 2028
- Exhibits34: Chart on Type - Market share 2023-2028 (%)
- Exhibits35: Data Table on Type - Market share 2023-2028 (%)
- Exhibits36: Chart on Comparison by Type
- Exhibits37: Data Table on Comparison by Type
- Exhibits38: Chart on Liquefaction terminal - Market size and forecast 2023-2028 ($ million)
- Exhibits39: Data Table on Liquefaction terminal - Market size and forecast 2023-2028 ($ million)
- Exhibits40: Chart on Liquefaction terminal - Year-over-year growth 2023-2028 (%)
- Exhibits41: Data Table on Liquefaction terminal - Year-over-year growth 2023-2028 (%)
- Exhibits42: Chart on Regasification terminal - Market size and forecast 2023-2028 ($ million)
- Exhibits43: Data Table on Regasification terminal - Market size and forecast 2023-2028 ($ million)
- Exhibits44: Chart on Regasification terminal - Year-over-year growth 2023-2028 (%)
- Exhibits45: Data Table on Regasification terminal - Year-over-year growth 2023-2028 (%)
- Exhibits46: Market opportunity by Type ($ million)
- Exhibits47: Data Table on Market opportunity by Type ($ million)
- Exhibits48: Analysis of price sensitivity, lifecycle, customer purchase basket, adoption rates, and purchase criteria
- Exhibits49: Chart on Market share By Geographical Landscape 2023-2028 (%)
- Exhibits50: Data Table on Market share By Geographical Landscape 2023-2028 (%)
- Exhibits51: Chart on Geographic comparison
- Exhibits52: Data Table on Geographic comparison
- Exhibits53: Chart on North America - Market size and forecast 2023-2028 ($ million)
- Exhibits54: Data Table on North America - Market size and forecast 2023-2028 ($ million)
- Exhibits55: Chart on North America - Year-over-year growth 2023-2028 (%)
- Exhibits56: Data Table on North America - Year-over-year growth 2023-2028 (%)
- Exhibits57: Chart on APAC - Market size and forecast 2023-2028 ($ million)
- Exhibits58: Data Table on APAC - Market size and forecast 2023-2028 ($ million)
- Exhibits59: Chart on APAC - Year-over-year growth 2023-2028 (%)
- Exhibits60: Data Table on APAC - Year-over-year growth 2023-2028 (%)
- Exhibits61: Chart on Europe - Market size and forecast 2023-2028 ($ million)
- Exhibits62: Data Table on Europe - Market size and forecast 2023-2028 ($ million)
- Exhibits63: Chart on Europe - Year-over-year growth 2023-2028 (%)
- Exhibits64: Data Table on Europe - Year-over-year growth 2023-2028 (%)
- Exhibits65: Chart on Middle East and Africa - Market size and forecast 2023-2028 ($ million)
- Exhibits66: Data Table on Middle East and Africa - Market size and forecast 2023-2028 ($ million)
- Exhibits67: Chart on Middle East and Africa - Year-over-year growth 2023-2028 (%)
- Exhibits68: Data Table on Middle East and Africa - Year-over-year growth 2023-2028 (%)
- Exhibits69: Chart on South America - Market size and forecast 2023-2028 ($ million)
- Exhibits70: Data Table on South America - Market size and forecast 2023-2028 ($ million)
- Exhibits71: Chart on South America - Year-over-year growth 2023-2028 (%)
- Exhibits72: Data Table on South America - Year-over-year growth 2023-2028 (%)
- Exhibits73: Chart on US - Market size and forecast 2023-2028 ($ million)
- Exhibits74: Data Table on US - Market size and forecast 2023-2028 ($ million)
- Exhibits75: Chart on US - Year-over-year growth 2023-2028 (%)
- Exhibits76: Data Table on US - Year-over-year growth 2023-2028 (%)
- Exhibits77: Chart on China - Market size and forecast 2023-2028 ($ million)
- Exhibits78: Data Table on China - Market size and forecast 2023-2028 ($ million)
- Exhibits79: Chart on China - Year-over-year growth 2023-2028 (%)
- Exhibits80: Data Table on China - Year-over-year growth 2023-2028 (%)
- Exhibits81: Chart on Japan - Market size and forecast 2023-2028 ($ million)
- Exhibits82: Data Table on Japan - Market size and forecast 2023-2028 ($ million)
- Exhibits83: Chart on Japan - Year-over-year growth 2023-2028 (%)
- Exhibits84: Data Table on Japan - Year-over-year growth 2023-2028 (%)
- Exhibits85: Chart on India - Market size and forecast 2023-2028 ($ million)
- Exhibits86: Data Table on India - Market size and forecast 2023-2028 ($ million)
- Exhibits87: Chart on India - Year-over-year growth 2023-2028 (%)
- Exhibits88: Data Table on India - Year-over-year growth 2023-2028 (%)
- Exhibits89: Chart on Russia - Market size and forecast 2023-2028 ($ million)
- Exhibits90: Data Table on Russia - Market size and forecast 2023-2028 ($ million)
- Exhibits91: Chart on Russia - Year-over-year growth 2023-2028 (%)
- Exhibits92: Data Table on Russia - Year-over-year growth 2023-2028 (%)
- Exhibits93: Chart on Canada - Market size and forecast 2023-2028 ($ million)
- Exhibits94: Data Table on Canada - Market size and forecast 2023-2028 ($ million)
- Exhibits95: Chart on Canada - Year-over-year growth 2023-2028 (%)
- Exhibits96: Data Table on Canada - Year-over-year growth 2023-2028 (%)
- Exhibits97: Chart on Germany - Market size and forecast 2023-2028 ($ million)
- Exhibits98: Data Table on Germany - Market size and forecast 2023-2028 ($ million)
- Exhibits99: Chart on Germany - Year-over-year growth 2023-2028 (%)
- Exhibits100: Data Table on Germany - Year-over-year growth 2023-2028 (%)
- Exhibits101: Chart on United Arab Emirates - Market size and forecast 2023-2028 ($ million)
- Exhibits102: Data Table on United Arab Emirates - Market size and forecast 2023-2028 ($ million)
- Exhibits103: Chart on United Arab Emirates - Year-over-year growth 2023-2028 (%)
- Exhibits104: Data Table on United Arab Emirates - Year-over-year growth 2023-2028 (%)
- Exhibits105: Chart on Saudi Arabia - Market size and forecast 2023-2028 ($ million)
- Exhibits106: Data Table on Saudi Arabia - Market size and forecast 2023-2028 ($ million)
- Exhibits107: Chart on Saudi Arabia - Year-over-year growth 2023-2028 (%)
- Exhibits108: Data Table on Saudi Arabia - Year-over-year growth 2023-2028 (%)
- Exhibits109: Chart on Brazil - Market size and forecast 2023-2028 ($ million)
- Exhibits110: Data Table on Brazil - Market size and forecast 2023-2028 ($ million)
- Exhibits111: Chart on Brazil - Year-over-year growth 2023-2028 (%)
- Exhibits112: Data Table on Brazil - Year-over-year growth 2023-2028 (%)
- Exhibits113: Market opportunity By Geographical Landscape ($ million)
- Exhibits114: Data Tables on Market opportunity By Geographical Landscape ($ million)
- Exhibits115: Impact of drivers and challenges in 2023 and 2028
- Exhibits116: Overview on criticality of inputs and factors of differentiation
- Exhibits117: Overview on factors of disruption
- Exhibits118: Impact of key risks on business
- Exhibits119: Companies covered
- Exhibits120: Company ranking index
- Exhibits121: Matrix on companies position and classification
- Exhibits122: Bechtel Corp. - Overview
- Exhibits123: Bechtel Corp. - Product / Service
- Exhibits124: Bechtel Corp. - Key news
- Exhibits125: Bechtel Corp. - Key offerings
- Exhibits126: SWOT
- Exhibits127: Chiyoda Corp. - Overview
- Exhibits128: Chiyoda Corp. - Business segments
- Exhibits129: Chiyoda Corp. - Key news
- Exhibits130: Chiyoda Corp. - Key offerings
- Exhibits131: Chiyoda Corp. - Segment focus
- Exhibits132: SWOT
- Exhibits133: Exxon Mobil Corp. - Overview
- Exhibits134: Exxon Mobil Corp. - Business segments
- Exhibits135: Exxon Mobil Corp. - Key news
- Exhibits136: Exxon Mobil Corp. - Key offerings
- Exhibits137: Exxon Mobil Corp. - Segment focus
- Exhibits138: SWOT
- Exhibits139: Fluor Corp. - Overview
- Exhibits140: Fluor Corp. - Business segments
- Exhibits141: Fluor Corp. - Key news
- Exhibits142: Fluor Corp. - Key offerings
- Exhibits143: Fluor Corp. - Segment focus
- Exhibits144: SWOT
- Exhibits145: JGC Holdings Corp. - Overview
- Exhibits146: JGC Holdings Corp. - Business segments
- Exhibits147: JGC Holdings Corp. - Key offerings
- Exhibits148: JGC Holdings Corp. - Segment focus
- Exhibits149: SWOT
- Exhibits150: John Wood Group PLC - Overview
- Exhibits151: John Wood Group PLC - Business segments
- Exhibits152: John Wood Group PLC - Key offerings
- Exhibits153: John Wood Group PLC - Segment focus
- Exhibits154: SWOT
- Exhibits155: McDermott International Ltd. - Overview
- Exhibits156: McDermott International Ltd. - Product / Service
- Exhibits157: McDermott International Ltd. - Key news
- Exhibits158: McDermott International Ltd. - Key offerings
- Exhibits159: SWOT
- Exhibits160: Shell plc - Overview
- Exhibits161: Shell plc - Business segments
- Exhibits162: Shell plc - Key news
- Exhibits163: Shell plc - Key offerings
- Exhibits164: Shell plc - Segment focus
- Exhibits165: SWOT
- Exhibits166: Saipem S.p.A. - Overview
- Exhibits167: Saipem S.p.A. - Business segments
- Exhibits168: Saipem S.p.A. - Key offerings
- Exhibits169: Saipem S.p.A. - Segment focus
- Exhibits170: SWOT
- Exhibits171: Sempra Energy - Overview
- Exhibits172: Sempra Energy - Product / Service
- Exhibits173: Sempra Energy - Key offerings
- Exhibits174: SWOT
- Exhibits175: Inclusions checklist
- Exhibits176: Exclusions checklist
- Exhibits177: Currency conversion rates for US$
- Exhibits178: Research methodology
- Exhibits179: Information sources
- Exhibits180: Data validation
- Exhibits181: Validation techniques employed for market sizing
- Exhibits182: Data synthesis
- Exhibits183: 360 degree market analysis
- Exhibits184: List of abbreviations
LNG Infrastructure Market 2024-2028
The lng infrastructure market is forecasted to grow by USD 4668.5 mn during 2023-2028, accelerating at a CAGR of 6% during the forecast period. The report on the lng infrastructure market provides a holistic analysis, market size and forecast, trends, growth drivers, and challenges, as well as vendor analysis covering around 25 vendors.
The report offers an up-to-date analysis regarding the current market scenario, the latest trends and drivers, and the overall market environment. The market is driven by rise in demand for cleaner fuels, growth in lng liquefaction capacity, and favorable government initiatives.
| Market Scope | |
|---|---|
| Base Year | 2024 |
| End Year | 2028 |
| Series Year | 2024-2028 |
| Growth Momentum | Accelerate |
| YOY 2024 | 5.6% |
| CAGR | 6% |
| Incremental Value | $4668.5 mn |
Technavio's lng infrastructure market is segmented as below:
By Type
- Liquefaction terminal
- Regasification terminal
By Geographical Landscape
- North America
- APAC
- Europe
- Middle East and Africa
- South America
This study identifies the growing demand for lng bunkering as one of the prime reasons driving the lng infrastructure market growth during the next few years. Also, increasing adoption of floating lng technology and inland fueling infrastructure expands will lead to sizable demand in the market.
The report on the lng infrastructure market covers the following areas:
- LNG Infrastructure Market sizing
- LNG Infrastructure Market forecast
- LNG Infrastructure Market industry analysis
The robust vendor analysis is designed to help clients improve their market position, and in line with this, this report provides a detailed analysis of several leading lng infrastructure market vendors that include Bechtel Corp., Cheniere Energy Inc., Chevron Corp., Chiyoda Corp., Exxon Mobil Corp., Fluor Corp., Gazprom Nedra LLC, INPEX Corp., JGC Holdings Corp., John Wood Group PLC, McDermott International Ltd., NextDecade Corp., Occidental Petroleum Corp., PAO NOVATEK, PETRONAS Chemicals Group Berhad, Shell plc, Saipem S.p.A., Sempra Energy, and Steelhead LNG Corp.. Also, the lng infrastructure market analysis report includes information on upcoming trends and challenges that will influence market growth. This is to help companies strategize and leverage all forthcoming growth opportunities.
The study was conducted using an objective combination of primary and secondary information including inputs from key participants in the industry. The report contains a comprehensive market and vendor landscape in addition to an analysis of the key vendors.
The publisher presents a detailed picture of the market by the way of study, synthesis, and summation of data from multiple sources by an analysis of key parameters such as profit, pricing, competition, and promotions. It presents various market facets by identifying the key industry influencers. The data presented is comprehensive, reliable, and a result of extensive primary and secondary research. The market research reports provide a complete competitive landscape and an in-depth vendor selection methodology and analysis using qualitative and quantitative research to forecast accurate market growth.
Table of Contents
1 Executive Summary
- 1.1 Market overview
- Executive Summary - Chart on Market Overview
- Executive Summary - Data Table on Market Overview
- Executive Summary - Chart on Global Market Characteristics
- Executive Summary - Chart on Market By Geographical Landscape
- Executive Summary - Chart on Market Segmentation by Type
- Executive Summary - Chart on Incremental Growth
- Executive Summary - Data Table on Incremental Growth
- Executive Summary - Chart on Company Market Positioning
2 Technavio Analysis
- 2.1 Analysis of price sensitivity, lifecycle, customer purchase basket, adoption rates, and purchase criteria
- Analysis of price sensitivity, lifecycle, customer purchase basket, adoption rates, and purchase criteria
- 2.2 Criticality of inputs and Factors of differentiation
- Overview on criticality of inputs and factors of differentiation
- 2.3 Factors of disruption
- Overview on factors of disruption
- 2.4 Impact of drivers and challenges
- Impact of drivers and challenges in 2023 and 2028
3 Market Landscape
- 3.1 Market ecosystem
- Parent Market
- Data Table on - Parent Market
- 3.2 Market characteristics
- Market characteristics analysis
- 3.3 Value chain analysis
- Value Chain Analysis
4 Market Sizing
- 4.1 Market definition
- Offerings of companies included in the market definition
- 4.2 Market segment analysis
- Market segments
- 4.3 Market size 2023
- 4.4 Market outlook: Forecast for 2023-2028
- Chart on Global - Market size and forecast 2023-2028 ($ million)
- Data Table on Global - Market size and forecast 2023-2028 ($ million)
- Chart on Global Market: Year-over-year growth 2023-2028 (%)
- Data Table on Global Market: Year-over-year growth 2023-2028 (%)
5 Historic Market Size
- 5.1 Global LNG Infrastructure Market 2018 - 2022
- Historic Market Size - Data Table on Global LNG Infrastructure Market 2018 - 2022 ($ million)
- 5.2 Type segment analysis 2018 - 2022
- Historic Market Size - Type Segment 2018 - 2022 ($ million)
- 5.3 Geography segment analysis 2018 - 2022
- Historic Market Size - Geography Segment 2018 - 2022 ($ million)
- 5.4 Country segment analysis 2018 - 2022
- Historic Market Size - Country Segment 2018 - 2022 ($ million)
6 Five Forces Analysis
- 6.1 Five forces summary
- Five forces analysis - Comparison between 2023 and 2028
- 6.2 Bargaining power of buyers
- Bargaining power of buyers - Impact of key factors 2023 and 2028
- 6.3 Bargaining power of suppliers
- Bargaining power of suppliers - Impact of key factors in 2023 and 2028
- 6.4 Threat of new entrants
- Threat of new entrants - Impact of key factors in 2023 and 2028
- 6.5 Threat of substitutes
- Threat of substitutes - Impact of key factors in 2023 and 2028
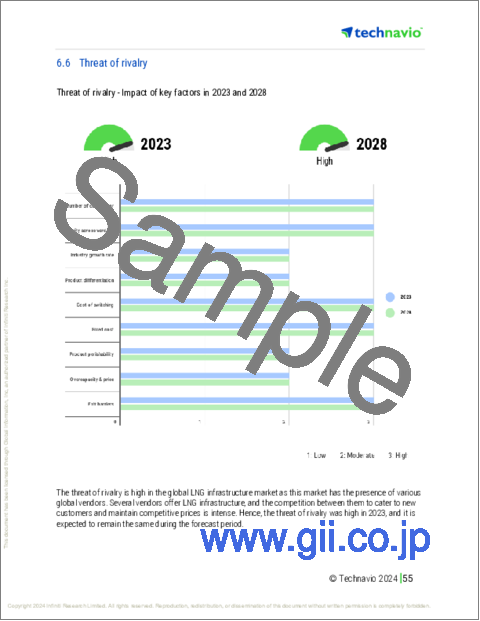
- 6.6 Threat of rivalry
- Threat of rivalry - Impact of key factors in 2023 and 2028
- 6.7 Market condition
- Chart on Market condition - Five forces 2023 and 2028
7 Market Segmentation by Type
- 7.1 Market segments
- Chart on Type - Market share 2023-2028 (%)
- Data Table on Type - Market share 2023-2028 (%)
- 7.2 Comparison by Type
- Chart on Comparison by Type
- Data Table on Comparison by Type
- 7.3 Liquefaction terminal - Market size and forecast 2023-2028
- Chart on Liquefaction terminal - Market size and forecast 2023-2028 ($ million)
- Data Table on Liquefaction terminal - Market size and forecast 2023-2028 ($ million)
- Chart on Liquefaction terminal - Year-over-year growth 2023-2028 (%)
- Data Table on Liquefaction terminal - Year-over-year growth 2023-2028 (%)
- 7.4 Regasification terminal - Market size and forecast 2023-2028
- Chart on Regasification terminal - Market size and forecast 2023-2028 ($ million)
- Data Table on Regasification terminal - Market size and forecast 2023-2028 ($ million)
- Chart on Regasification terminal - Year-over-year growth 2023-2028 (%)
- Data Table on Regasification terminal - Year-over-year growth 2023-2028 (%)
- 7.5 Market opportunity by Type
- Market opportunity by Type ($ million)
- Data Table on Market opportunity by Type ($ million)
8 Customer Landscape
- 8.1 Customer landscape overview
- Analysis of price sensitivity, lifecycle, customer purchase basket, adoption rates, and purchase criteria
9 Geographic Landscape
- 9.1 Geographic segmentation
- Chart on Market share By Geographical Landscape 2023-2028 (%)
- Data Table on Market share By Geographical Landscape 2023-2028 (%)
- 9.2 Geographic comparison
- Chart on Geographic comparison
- Data Table on Geographic comparison
- 9.3 North America - Market size and forecast 2023-2028
- Chart on North America - Market size and forecast 2023-2028 ($ million)
- Data Table on North America - Market size and forecast 2023-2028 ($ million)
- Chart on North America - Year-over-year growth 2023-2028 (%)
- Data Table on North America - Year-over-year growth 2023-2028 (%)
- 9.4 APAC - Market size and forecast 2023-2028
- Chart on APAC - Market size and forecast 2023-2028 ($ million)
- Data Table on APAC - Market size and forecast 2023-2028 ($ million)
- Chart on APAC - Year-over-year growth 2023-2028 (%)
- Data Table on APAC - Year-over-year growth 2023-2028 (%)
- 9.5 Europe - Market size and forecast 2023-2028
- Chart on Europe - Market size and forecast 2023-2028 ($ million)
- Data Table on Europe - Market size and forecast 2023-2028 ($ million)
- Chart on Europe - Year-over-year growth 2023-2028 (%)
- Data Table on Europe - Year-over-year growth 2023-2028 (%)
- 9.6 Middle East and Africa - Market size and forecast 2023-2028
- Chart on Middle East and Africa - Market size and forecast 2023-2028 ($ million)
- Data Table on Middle East and Africa - Market size and forecast 2023-2028 ($ million)
- Chart on Middle East and Africa - Year-over-year growth 2023-2028 (%)
- Data Table on Middle East and Africa - Year-over-year growth 2023-2028 (%)
- 9.7 South America - Market size and forecast 2023-2028
- Chart on South America - Market size and forecast 2023-2028 ($ million)
- Data Table on South America - Market size and forecast 2023-2028 ($ million)
- Chart on South America - Year-over-year growth 2023-2028 (%)
- Data Table on South America - Year-over-year growth 2023-2028 (%)
- 9.8 US - Market size and forecast 2023-2028
- Chart on US - Market size and forecast 2023-2028 ($ million)
- Data Table on US - Market size and forecast 2023-2028 ($ million)
- Chart on US - Year-over-year growth 2023-2028 (%)
- Data Table on US - Year-over-year growth 2023-2028 (%)
- 9.9 China - Market size and forecast 2023-2028
- Chart on China - Market size and forecast 2023-2028 ($ million)
- Data Table on China - Market size and forecast 2023-2028 ($ million)
- Chart on China - Year-over-year growth 2023-2028 (%)
- Data Table on China - Year-over-year growth 2023-2028 (%)
- 9.10 Japan - Market size and forecast 2023-2028
- Chart on Japan - Market size and forecast 2023-2028 ($ million)
- Data Table on Japan - Market size and forecast 2023-2028 ($ million)
- Chart on Japan - Year-over-year growth 2023-2028 (%)
- Data Table on Japan - Year-over-year growth 2023-2028 (%)
- 9.11 India - Market size and forecast 2023-2028
- Chart on India - Market size and forecast 2023-2028 ($ million)
- Data Table on India - Market size and forecast 2023-2028 ($ million)
- Chart on India - Year-over-year growth 2023-2028 (%)
- Data Table on India - Year-over-year growth 2023-2028 (%)
- 9.12 Russia - Market size and forecast 2023-2028
- Chart on Russia - Market size and forecast 2023-2028 ($ million)
- Data Table on Russia - Market size and forecast 2023-2028 ($ million)
- Chart on Russia - Year-over-year growth 2023-2028 (%)
- Data Table on Russia - Year-over-year growth 2023-2028 (%)
- 9.13 Canada - Market size and forecast 2023-2028
- Chart on Canada - Market size and forecast 2023-2028 ($ million)
- Data Table on Canada - Market size and forecast 2023-2028 ($ million)
- Chart on Canada - Year-over-year growth 2023-2028 (%)
- Data Table on Canada - Year-over-year growth 2023-2028 (%)
- 9.14 Germany - Market size and forecast 2023-2028
- Chart on Germany - Market size and forecast 2023-2028 ($ million)
- Data Table on Germany - Market size and forecast 2023-2028 ($ million)
- Chart on Germany - Year-over-year growth 2023-2028 (%)
- Data Table on Germany - Year-over-year growth 2023-2028 (%)
- 9.15 United Arab Emirates - Market size and forecast 2023-2028
- Chart on United Arab Emirates - Market size and forecast 2023-2028 ($ million)
- Data Table on United Arab Emirates - Market size and forecast 2023-2028 ($ million)
- Chart on United Arab Emirates - Year-over-year growth 2023-2028 (%)
- Data Table on United Arab Emirates - Year-over-year growth 2023-2028 (%)
- 9.16 Saudi Arabia - Market size and forecast 2023-2028
- Chart on Saudi Arabia - Market size and forecast 2023-2028 ($ million)
- Data Table on Saudi Arabia - Market size and forecast 2023-2028 ($ million)
- Chart on Saudi Arabia - Year-over-year growth 2023-2028 (%)
- Data Table on Saudi Arabia - Year-over-year growth 2023-2028 (%)
- 9.17 Brazil - Market size and forecast 2023-2028
- Chart on Brazil - Market size and forecast 2023-2028 ($ million)
- Data Table on Brazil - Market size and forecast 2023-2028 ($ million)
- Chart on Brazil - Year-over-year growth 2023-2028 (%)
- Data Table on Brazil - Year-over-year growth 2023-2028 (%)
- 9.18 Market opportunity By Geographical Landscape
- Market opportunity By Geographical Landscape ($ million)
- Data Tables on Market opportunity By Geographical Landscape ($ million)
10 Drivers, Challenges, and Opportunity/Restraints
- 10.1 Market drivers
- 10.2 Market challenges
- 10.3 Impact of drivers and challenges
- Impact of drivers and challenges in 2023 and 2028
- 10.4 Market opportunities/restraints
11 Competitive Landscape
- 11.1 Overview
- 11.2 Competitive Landscape
- Overview on criticality of inputs and factors of differentiation
- 11.3 Landscape disruption
- Overview on factors of disruption
- 11.4 Industry risks
- Impact of key risks on business
12 Competitive Analysis
- 12.1 Companies profiled
- Companies covered
- 12.2 Company ranking index
- Company ranking index
- 12.3 Market positioning of companies
- Matrix on companies position and classification
- 12.4 Bechtel Corp.
- Bechtel Corp. - Overview
- Bechtel Corp. - Product / Service
- Bechtel Corp. - Key news
- Bechtel Corp. - Key offerings
- SWOT
- 12.5 Chiyoda Corp.
- Chiyoda Corp. - Overview
- Chiyoda Corp. - Business segments
- Chiyoda Corp. - Key news
- Chiyoda Corp. - Key offerings
- Chiyoda Corp. - Segment focus
- SWOT
- 12.6 Exxon Mobil Corp.
- Exxon Mobil Corp. - Overview
- Exxon Mobil Corp. - Business segments
- Exxon Mobil Corp. - Key news
- Exxon Mobil Corp. - Key offerings
- Exxon Mobil Corp. - Segment focus
- SWOT
- 12.7 Fluor Corp.
- Fluor Corp. - Overview
- Fluor Corp. - Business segments
- Fluor Corp. - Key news
- Fluor Corp. - Key offerings
- Fluor Corp. - Segment focus
- SWOT
- 12.8 JGC Holdings Corp.
- JGC Holdings Corp. - Overview
- JGC Holdings Corp. - Business segments
- JGC Holdings Corp. - Key offerings
- JGC Holdings Corp. - Segment focus
- SWOT
- 12.9 John Wood Group PLC
- John Wood Group PLC - Overview
- John Wood Group PLC - Business segments
- John Wood Group PLC - Key offerings
- John Wood Group PLC - Segment focus
- SWOT
- 12.10 McDermott International Ltd.
- McDermott International Ltd. - Overview
- McDermott International Ltd. - Product / Service
- McDermott International Ltd. - Key news
- McDermott International Ltd. - Key offerings
- SWOT
- 12.11 Shell plc
- Shell plc - Overview
- Shell plc - Business segments
- Shell plc - Key news
- Shell plc - Key offerings
- Shell plc - Segment focus
- SWOT
- 12.12 Saipem S.p.A.
- Saipem S.p.A. - Overview
- Saipem S.p.A. - Business segments
- Saipem S.p.A. - Key offerings
- Saipem S.p.A. - Segment focus
- SWOT
- 12.13 Sempra Energy
- Sempra Energy - Overview
- Sempra Energy - Product / Service
- Sempra Energy - Key offerings
- SWOT
13 Appendix
- 13.1 Scope of the report
- 13.2 Inclusions and exclusions checklist
- Inclusions checklist
- Exclusions checklist
- 13.3 Currency conversion rates for US$
- Currency conversion rates for US$
- 13.4 Research methodology
- Research methodology
- 13.5 Data procurement
- Information sources
- 13.6 Data validation
- Data validation
- 13.7 Validation techniques employed for market sizing
- Validation techniques employed for market sizing
- 13.8 Data synthesis
- Data synthesis
- 13.9 360 degree market analysis
- 360 degree market analysis
- 13.10 List of abbreviations
- List of abbreviations
