|
|
市場調査レポート
商品コード
1602050
低分子APIの世界市場 (2024~2028年)Global Small Molecule API Market 2024-2028 |
||||||

|
|||||||
カスタマイズ可能
|
|||||||

| 低分子APIの世界市場 (2024~2028年) |
|
出版日: 2024年11月06日
発行: TechNavio
ページ情報: 英文 159 Pages
納期: 即納可能
|

全表示
- 概要
- 図表
- 目次
低分子API市場 (2024~2028年)
低分子API (医薬品原薬) 市場は2023-2028年に673億米ドル分拡大し、予測期間中に7.5%のCAGRで成長すると予測されます。当レポートでは、低分子API市場の全体的な分析、市場規模・予測、動向、成長促進要因、課題、約25のベンダーを網羅したベンダー分析などを掲載しています。
当レポートでは、現在の市場シナリオ、最新動向と促進要因、市場環境全体に関する最新分析を提供しています。新興国における低分子医薬品の製造シナリオの進展、タイプIIのDMF (ドラッグマスターファイル) の増加、コアコンピタンスに集中するニーズの高まりなどが市場を牽引しています。
| 市場範囲 | |
|---|---|
| 基準年 | 2024年 |
| 終了年 | 2028年 |
| 予測期間 | 2024~2028年 |
| 成長モメンタム | 加速 |
| 前年比 (2024年) | 6.8% |
| CAGR | 7.5% |
| 増分額 | 673億米ドル |
当レポートでは、今後数年間の低分子API市場成長を牽引する主な要因の一つとして、高齢者人口の増加を挙げています。また、特許満了の件数増加やAPI製造のパラダイムシフトも、市場の大きな需要につながると思われます。
目次
第1章 エグゼクティブサマリー
- 市場概要
第2章 Technavioによる分析
- 価格感応度・ライフサイクル・顧客購入バスケット・採用率・購入基準の分析
- インプットの重要性と差別化の要因
- 混乱の要因
- 促進要因と課題の影響
第3章 市場情勢
- 市場エコシステム
- 市場の特徴
- バリューチェーン分析
第4章 市場規模
- 市場の定義
- 市場セグメント分析
- 市場規模 (2023年)
- 市場の見通し (2023~2028年)
第5章 市場規模実績
- 低分子APIの世界市場 (2018~2022年)
- 展開方式別分析 (2018~2022年)
- 地域別分析 (2018~2022年)
- 国別分析 (2018~2022年)
第6章 ファイブフォース分析
- ファイブフォースの要約
- 買い手の交渉力
- 供給企業の交渉力
- 新規参入業者の脅威
- 代替品の脅威
- 競争の脅威
- 市況
第7章 市場セグメンテーション:展開方式別
- 市場セグメント
- 比較:展開方式別
- 社内API:市場規模と予測 (2023~2028年)
- 受託API:市場規模と予測 (2023~2028年)
- 市場機会:展開方式別
第8章 顧客情勢
- 顧客情勢の概要
第9章 地域別情勢
- 地域別セグメンテーション
- 地域別比較
- 北米:市場規模と予測 (2023~2028年)
- アジア:市場規模と予測 (2023~2028年)
- 欧州:市場規模と予測 (2023~2028年)
- 世界のその他の地域:市場規模と予測 (2023~2028年)
- 米国:市場規模と予測 (2023~2028年)
- カナダ:市場規模と予測 (2023~2028年)
- 中国:市場規模と予測 (2023~2028年)
- 日本:市場規模と予測 (2023~2028年)
- インド:市場規模と予測 (2023~2028年)
- 英国:市場規模と予測 (2023~2028年)
- 韓国:市場規模と予測 (2023~2028年)
- ドイツ:市場規模と予測 (2023~2028年)
- イタリア:市場規模と予測 (2023~2028年)
- フランス:市場規模と予測 (2023~2028年)
- 市場機会:地域別
第10章 促進要因・課題・機会・抑制要因
- 市場促進要因
- 市場の課題
- 促進要因と課題の影響
- 市場の機会・抑制要因
第11章 競合情勢
- 概要
- 競合情勢
- 混乱の状況
- 業界のリスク
第12章 競合分析
- 企業プロファイル
- 企業ランキング指数
- 企業の市場ポジショニング
- Aurobindo Pharma Ltd.
- Cambrex Corp.
- Cipla Inc.
- Dr Reddys Laboratories Ltd.
- GlaxoSmithKline Plc
- Merck KGaA
- Novartis AG
- Pfizer Inc.
- Teva Pharmaceutical Industries Ltd.
- Viatris Inc.
第13章 付録
Exhibits:
- Exhibits1: Executive Summary - Chart on Market Overview
- Exhibits2: Executive Summary - Data Table on Market Overview
- Exhibits3: Executive Summary - Chart on Global Market Characteristics
- Exhibits4: Executive Summary - Chart on Market By Geographical Landscape
- Exhibits5: Executive Summary - Chart on Market Segmentation by Deployment
- Exhibits6: Executive Summary - Chart on Incremental Growth
- Exhibits7: Executive Summary - Data Table on Incremental Growth
- Exhibits8: Executive Summary - Chart on Company Market Positioning
- Exhibits9: Analysis of price sensitivity, lifecycle, customer purchase basket, adoption rates, and purchase criteria
- Exhibits10: Overview on criticality of inputs and factors of differentiation
- Exhibits11: Overview on factors of disruption
- Exhibits12: Impact of drivers and challenges in 2023 and 2028
- Exhibits13: Parent Market
- Exhibits14: Data Table on - Parent Market
- Exhibits15: Market characteristics analysis
- Exhibits16: Value Chain Analysis
- Exhibits17: Offerings of companies included in the market definition
- Exhibits18: Market segments
- Exhibits19: Chart on Global - Market size and forecast 2023-2028 ($ billion)
- Exhibits20: Data Table on Global - Market size and forecast 2023-2028 ($ billion)
- Exhibits21: Chart on Global Market: Year-over-year growth 2023-2028 (%)
- Exhibits22: Data Table on Global Market: Year-over-year growth 2023-2028 (%)
- Exhibits23: Historic Market Size - Data Table on Global Small Molecule API Market 2018 - 2022 ($ billion)
- Exhibits24: Historic Market Size - Deployment Segment 2018 - 2022 ($ billion)
- Exhibits25: Historic Market Size - Geography Segment 2018 - 2022 ($ billion)
- Exhibits26: Historic Market Size - Country Segment 2018 - 2022 ($ billion)
- Exhibits27: Five forces analysis - Comparison between 2023 and 2028
- Exhibits28: Bargaining power of buyers - Impact of key factors 2023 and 2028
- Exhibits29: Bargaining power of suppliers - Impact of key factors in 2023 and 2028
- Exhibits30: Threat of new entrants - Impact of key factors in 2023 and 2028
- Exhibits31: Threat of substitutes - Impact of key factors in 2023 and 2028
- Exhibits32: Threat of rivalry - Impact of key factors in 2023 and 2028
- Exhibits33: Chart on Market condition - Five forces 2023 and 2028
- Exhibits34: Chart on Deployment - Market share 2023-2028 (%)
- Exhibits35: Data Table on Deployment - Market share 2023-2028 (%)
- Exhibits36: Chart on Comparison by Deployment
- Exhibits37: Data Table on Comparison by Deployment
- Exhibits38: Chart on Captive APIs - Market size and forecast 2023-2028 ($ billion)
- Exhibits39: Data Table on Captive APIs - Market size and forecast 2023-2028 ($ billion)
- Exhibits40: Chart on Captive APIs - Year-over-year growth 2023-2028 (%)
- Exhibits41: Data Table on Captive APIs - Year-over-year growth 2023-2028 (%)
- Exhibits42: Chart on Contract APIs - Market size and forecast 2023-2028 ($ billion)
- Exhibits43: Data Table on Contract APIs - Market size and forecast 2023-2028 ($ billion)
- Exhibits44: Chart on Contract APIs - Year-over-year growth 2023-2028 (%)
- Exhibits45: Data Table on Contract APIs - Year-over-year growth 2023-2028 (%)
- Exhibits46: Market opportunity by Deployment ($ billion)
- Exhibits47: Data Table on Market opportunity by Deployment ($ billion)
- Exhibits48: Analysis of price sensitivity, lifecycle, customer purchase basket, adoption rates, and purchase criteria
- Exhibits49: Chart on Market share By Geographical Landscape 2023-2028 (%)
- Exhibits50: Data Table on Market share By Geographical Landscape 2023-2028 (%)
- Exhibits51: Chart on Geographic comparison
- Exhibits52: Data Table on Geographic comparison
- Exhibits53: Chart on North America - Market size and forecast 2023-2028 ($ billion)
- Exhibits54: Data Table on North America - Market size and forecast 2023-2028 ($ billion)
- Exhibits55: Chart on North America - Year-over-year growth 2023-2028 (%)
- Exhibits56: Data Table on North America - Year-over-year growth 2023-2028 (%)
- Exhibits57: Chart on Asia - Market size and forecast 2023-2028 ($ billion)
- Exhibits58: Data Table on Asia - Market size and forecast 2023-2028 ($ billion)
- Exhibits59: Chart on Asia - Year-over-year growth 2023-2028 (%)
- Exhibits60: Data Table on Asia - Year-over-year growth 2023-2028 (%)
- Exhibits61: Chart on Europe - Market size and forecast 2023-2028 ($ billion)
- Exhibits62: Data Table on Europe - Market size and forecast 2023-2028 ($ billion)
- Exhibits63: Chart on Europe - Year-over-year growth 2023-2028 (%)
- Exhibits64: Data Table on Europe - Year-over-year growth 2023-2028 (%)
- Exhibits65: Chart on Rest of World (ROW) - Market size and forecast 2023-2028 ($ billion)
- Exhibits66: Data Table on Rest of World (ROW) - Market size and forecast 2023-2028 ($ billion)
- Exhibits67: Chart on Rest of World (ROW) - Year-over-year growth 2023-2028 (%)
- Exhibits68: Data Table on Rest of World (ROW) - Year-over-year growth 2023-2028 (%)
- Exhibits69: Chart on US - Market size and forecast 2023-2028 ($ billion)
- Exhibits70: Data Table on US - Market size and forecast 2023-2028 ($ billion)
- Exhibits71: Chart on US - Year-over-year growth 2023-2028 (%)
- Exhibits72: Data Table on US - Year-over-year growth 2023-2028 (%)
- Exhibits73: Chart on Canada - Market size and forecast 2023-2028 ($ billion)
- Exhibits74: Data Table on Canada - Market size and forecast 2023-2028 ($ billion)
- Exhibits75: Chart on Canada - Year-over-year growth 2023-2028 (%)
- Exhibits76: Data Table on Canada - Year-over-year growth 2023-2028 (%)
- Exhibits77: Chart on China - Market size and forecast 2023-2028 ($ billion)
- Exhibits78: Data Table on China - Market size and forecast 2023-2028 ($ billion)
- Exhibits79: Chart on China - Year-over-year growth 2023-2028 (%)
- Exhibits80: Data Table on China - Year-over-year growth 2023-2028 (%)
- Exhibits81: Chart on Japan - Market size and forecast 2023-2028 ($ billion)
- Exhibits82: Data Table on Japan - Market size and forecast 2023-2028 ($ billion)
- Exhibits83: Chart on Japan - Year-over-year growth 2023-2028 (%)
- Exhibits84: Data Table on Japan - Year-over-year growth 2023-2028 (%)
- Exhibits85: Chart on India - Market size and forecast 2023-2028 ($ billion)
- Exhibits86: Data Table on India - Market size and forecast 2023-2028 ($ billion)
- Exhibits87: Chart on India - Year-over-year growth 2023-2028 (%)
- Exhibits88: Data Table on India - Year-over-year growth 2023-2028 (%)
- Exhibits89: Chart on UK - Market size and forecast 2023-2028 ($ billion)
- Exhibits90: Data Table on UK - Market size and forecast 2023-2028 ($ billion)
- Exhibits91: Chart on UK - Year-over-year growth 2023-2028 (%)
- Exhibits92: Data Table on UK - Year-over-year growth 2023-2028 (%)
- Exhibits93: Chart on South Korea - Market size and forecast 2023-2028 ($ billion)
- Exhibits94: Data Table on South Korea - Market size and forecast 2023-2028 ($ billion)
- Exhibits95: Chart on South Korea - Year-over-year growth 2023-2028 (%)
- Exhibits96: Data Table on South Korea - Year-over-year growth 2023-2028 (%)
- Exhibits97: Chart on Germany - Market size and forecast 2023-2028 ($ billion)
- Exhibits98: Data Table on Germany - Market size and forecast 2023-2028 ($ billion)
- Exhibits99: Chart on Germany - Year-over-year growth 2023-2028 (%)
- Exhibits100: Data Table on Germany - Year-over-year growth 2023-2028 (%)
- Exhibits101: Chart on Italy - Market size and forecast 2023-2028 ($ billion)
- Exhibits102: Data Table on Italy - Market size and forecast 2023-2028 ($ billion)
- Exhibits103: Chart on Italy - Year-over-year growth 2023-2028 (%)
- Exhibits104: Data Table on Italy - Year-over-year growth 2023-2028 (%)
- Exhibits105: Chart on France - Market size and forecast 2023-2028 ($ billion)
- Exhibits106: Data Table on France - Market size and forecast 2023-2028 ($ billion)
- Exhibits107: Chart on France - Year-over-year growth 2023-2028 (%)
- Exhibits108: Data Table on France - Year-over-year growth 2023-2028 (%)
- Exhibits109: Market opportunity By Geographical Landscape ($ billion)
- Exhibits110: Data Tables on Market opportunity By Geographical Landscape ($ billion)
- Exhibits111: Impact of drivers and challenges in 2023 and 2028
- Exhibits112: Overview on criticality of inputs and factors of differentiation
- Exhibits113: Overview on factors of disruption
- Exhibits114: Impact of key risks on business
- Exhibits115: Companies covered
- Exhibits116: Company ranking index
- Exhibits117: Matrix on companies position and classification
- Exhibits118: Aurobindo Pharma Ltd. - Overview
- Exhibits119: Aurobindo Pharma Ltd. - Product / Service
- Exhibits120: Aurobindo Pharma Ltd. - Key offerings
- Exhibits121: SWOT
- Exhibits122: Cambrex Corp. - Overview
- Exhibits123: Cambrex Corp. - Product / Service
- Exhibits124: Cambrex Corp. - Key news
- Exhibits125: Cambrex Corp. - Key offerings
- Exhibits126: SWOT
- Exhibits127: Cipla Inc. - Overview
- Exhibits128: Cipla Inc. - Business segments
- Exhibits129: Cipla Inc. - Key news
- Exhibits130: Cipla Inc. - Key offerings
- Exhibits131: Cipla Inc. - Segment focus
- Exhibits132: SWOT
- Exhibits133: Dr Reddys Laboratories Ltd. - Overview
- Exhibits134: Dr Reddys Laboratories Ltd. - Business segments
- Exhibits135: Dr Reddys Laboratories Ltd. - Key news
- Exhibits136: Dr Reddys Laboratories Ltd. - Key offerings
- Exhibits137: Dr Reddys Laboratories Ltd. - Segment focus
- Exhibits138: SWOT
- Exhibits139: GlaxoSmithKline Plc - Overview
- Exhibits140: GlaxoSmithKline Plc - Business segments
- Exhibits141: GlaxoSmithKline Plc - Key news
- Exhibits142: GlaxoSmithKline Plc - Key offerings
- Exhibits143: GlaxoSmithKline Plc - Segment focus
- Exhibits144: SWOT
- Exhibits145: Merck KGaA - Overview
- Exhibits146: Merck KGaA - Business segments
- Exhibits147: Merck KGaA - Key news
- Exhibits148: Merck KGaA - Key offerings
- Exhibits149: Merck KGaA - Segment focus
- Exhibits150: SWOT
- Exhibits151: Novartis AG - Overview
- Exhibits152: Novartis AG - Business segments
- Exhibits153: Novartis AG - Key news
- Exhibits154: Novartis AG - Key offerings
- Exhibits155: Novartis AG - Segment focus
- Exhibits156: SWOT
- Exhibits157: Pfizer Inc. - Overview
- Exhibits158: Pfizer Inc. - Product / Service
- Exhibits159: Pfizer Inc. - Key news
- Exhibits160: Pfizer Inc. - Key offerings
- Exhibits161: SWOT
- Exhibits162: Teva Pharmaceutical Industries Ltd. - Overview
- Exhibits163: Teva Pharmaceutical Industries Ltd. - Business segments
- Exhibits164: Teva Pharmaceutical Industries Ltd. - Key news
- Exhibits165: Teva Pharmaceutical Industries Ltd. - Key offerings
- Exhibits166: Teva Pharmaceutical Industries Ltd. - Segment focus
- Exhibits167: SWOT
- Exhibits168: Viatris Inc. - Overview
- Exhibits169: Viatris Inc. - Business segments
- Exhibits170: Viatris Inc. - Key news
- Exhibits171: Viatris Inc. - Key offerings
- Exhibits172: Viatris Inc. - Segment focus
- Exhibits173: SWOT
- Exhibits174: Inclusions checklist
- Exhibits175: Exclusions checklist
- Exhibits176: Currency conversion rates for US$
- Exhibits177: Research methodology
- Exhibits178: Information sources
- Exhibits179: Data validation
- Exhibits180: Validation techniques employed for market sizing
- Exhibits181: Data synthesis
- Exhibits182: 360 degree market analysis
- Exhibits183: List of abbreviations
Small Molecule API Market 2024-2028
The small molecule api market is forecasted to grow by USD 67.3 bn during 2023-2028, accelerating at a CAGR of 7.5% during the forecast period. The report on the small molecule api market provides a holistic analysis, market size and forecast, trends, growth drivers, and challenges, as well as vendor analysis covering around 25 vendors.
The report offers an up-to-date analysis regarding the current market scenario, the latest trends and drivers, and the overall market environment. The market is driven by evolving small-molecule api manufacturing scenario in developing countries, increasing number of type ii drug master files (DMFs), and growing need to focus on core competencies.
| Market Scope | |
|---|---|
| Base Year | 2024 |
| End Year | 2028 |
| Series Year | 2024-2028 |
| Growth Momentum | Accelerate |
| YOY 2024 | 6.8% |
| CAGR | 7.5% |
| Incremental Value | $67.3 bn |
Technavio's small molecule api market is segmented as below:
By Deployment
- Captive APIs
- Contract APIs
By Geographical Landscape
- North America
- Asia
- Europe
- Rest of World (ROW)
This study identifies the increasing geriatric population as one of the prime reasons driving the small molecule api market growth during the next few years. Also, increasing patent expiries and paradigm shift in api manufacturing will lead to sizable demand in the market.
The report on the small molecule api market covers the following areas:
- Small Molecule API Market sizing
- Small Molecule API Market forecast
- Small Molecule API Market industry analysis
The robust vendor analysis is designed to help clients improve their market position, and in line with this, this report provides a detailed analysis of several leading small molecule api market vendors that include Amneal Pharmaceuticals Inc., Aurobindo Pharma Ltd., Cambrex Corp., Cipla Inc., Corden Pharma International GmbH, Dishman Carbogen Amcis Ltd., Dr Reddys Laboratories Ltd., Gilead Sciences Inc., GlaxoSmithKline Plc, Johnson Matthey Plc, Lonza Group Ltd., Merck KGaA, Novartis AG, Novasep Holding SAS, Pfizer Inc., Sun Pharmaceutical Industries Ltd., Teva Pharmaceutical Industries Ltd., Thermo Fisher Scientific Inc., Viatris Inc., and WuXi AppTec Co. Ltd.. Also, the small molecule api market analysis report includes information on upcoming trends and challenges that will influence market growth. This is to help companies strategize and leverage all forthcoming growth opportunities.
The study was conducted using an objective combination of primary and secondary information including inputs from key participants in the industry. The report contains a comprehensive market and vendor landscape in addition to an analysis of the key vendors.
The publisher presents a detailed picture of the market by the way of study, synthesis, and summation of data from multiple sources by an analysis of key parameters such as profit, pricing, competition, and promotions. It presents various market facets by identifying the key industry influencers. The data presented is comprehensive, reliable, and a result of extensive primary and secondary research. The market research reports provide a complete competitive landscape and an in-depth vendor selection methodology and analysis using qualitative and quantitative research to forecast accurate market growth.
Table of Contents
1 Executive Summary
- 1.1 Market overview
- Executive Summary - Chart on Market Overview
- Executive Summary - Data Table on Market Overview
- Executive Summary - Chart on Global Market Characteristics
- Executive Summary - Chart on Market By Geographical Landscape
- Executive Summary - Chart on Market Segmentation by Deployment
- Executive Summary - Chart on Incremental Growth
- Executive Summary - Data Table on Incremental Growth
- Executive Summary - Chart on Company Market Positioning
2 Technavio Analysis
- 2.1 Analysis of price sensitivity, lifecycle, customer purchase basket, adoption rates, and purchase criteria
- Analysis of price sensitivity, lifecycle, customer purchase basket, adoption rates, and purchase criteria
- 2.2 Criticality of inputs and Factors of differentiation
- Overview on criticality of inputs and factors of differentiation
- 2.3 Factors of disruption
- Overview on factors of disruption
- 2.4 Impact of drivers and challenges
- Impact of drivers and challenges in 2023 and 2028
3 Market Landscape
- 3.1 Market ecosystem
- Parent Market
- Data Table on - Parent Market
- 3.2 Market characteristics
- Market characteristics analysis
- 3.3 Value chain analysis
- Value Chain Analysis
4 Market Sizing
- 4.1 Market definition
- Offerings of companies included in the market definition
- 4.2 Market segment analysis
- Market segments
- 4.3 Market size 2023
- 4.4 Market outlook: Forecast for 2023-2028
- Chart on Global - Market size and forecast 2023-2028 ($ billion)
- Data Table on Global - Market size and forecast 2023-2028 ($ billion)
- Chart on Global Market: Year-over-year growth 2023-2028 (%)
- Data Table on Global Market: Year-over-year growth 2023-2028 (%)
5 Historic Market Size
- 5.1 Global Small Molecule API Market 2018 - 2022
- Historic Market Size - Data Table on Global Small Molecule API Market 2018 - 2022 ($ billion)
- 5.2 Deployment segment analysis 2018 - 2022
- Historic Market Size - Deployment Segment 2018 - 2022 ($ billion)
- 5.3 Geography segment analysis 2018 - 2022
- Historic Market Size - Geography Segment 2018 - 2022 ($ billion)
- 5.4 Country segment analysis 2018 - 2022
- Historic Market Size - Country Segment 2018 - 2022 ($ billion)
6 Five Forces Analysis
- 6.1 Five forces summary
- Five forces analysis - Comparison between 2023 and 2028
- 6.2 Bargaining power of buyers
- Bargaining power of buyers - Impact of key factors 2023 and 2028
- 6.3 Bargaining power of suppliers
- Bargaining power of suppliers - Impact of key factors in 2023 and 2028
- 6.4 Threat of new entrants
- Threat of new entrants - Impact of key factors in 2023 and 2028
- 6.5 Threat of substitutes
- Threat of substitutes - Impact of key factors in 2023 and 2028
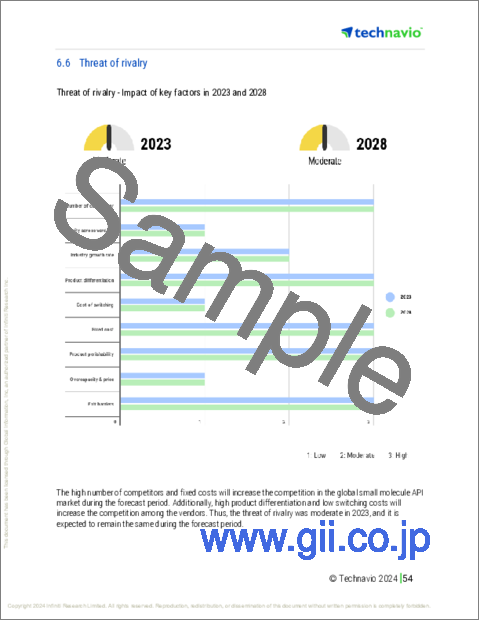
- 6.6 Threat of rivalry
- Threat of rivalry - Impact of key factors in 2023 and 2028
- 6.7 Market condition
- Chart on Market condition - Five forces 2023 and 2028
7 Market Segmentation by Deployment
- 7.1 Market segments
- Chart on Deployment - Market share 2023-2028 (%)
- Data Table on Deployment - Market share 2023-2028 (%)
- 7.2 Comparison by Deployment
- Chart on Comparison by Deployment
- Data Table on Comparison by Deployment
- 7.3 Captive APIs - Market size and forecast 2023-2028
- Chart on Captive APIs - Market size and forecast 2023-2028 ($ billion)
- Data Table on Captive APIs - Market size and forecast 2023-2028 ($ billion)
- Chart on Captive APIs - Year-over-year growth 2023-2028 (%)
- Data Table on Captive APIs - Year-over-year growth 2023-2028 (%)
- 7.4 Contract APIs - Market size and forecast 2023-2028
- Chart on Contract APIs - Market size and forecast 2023-2028 ($ billion)
- Data Table on Contract APIs - Market size and forecast 2023-2028 ($ billion)
- Chart on Contract APIs - Year-over-year growth 2023-2028 (%)
- Data Table on Contract APIs - Year-over-year growth 2023-2028 (%)
- 7.5 Market opportunity by Deployment
- Market opportunity by Deployment ($ billion)
- Data Table on Market opportunity by Deployment ($ billion)
8 Customer Landscape
- 8.1 Customer landscape overview
- Analysis of price sensitivity, lifecycle, customer purchase basket, adoption rates, and purchase criteria
9 Geographic Landscape
- 9.1 Geographic segmentation
- Chart on Market share By Geographical Landscape 2023-2028 (%)
- Data Table on Market share By Geographical Landscape 2023-2028 (%)
- 9.2 Geographic comparison
- Chart on Geographic comparison
- Data Table on Geographic comparison
- 9.3 North America - Market size and forecast 2023-2028
- Chart on North America - Market size and forecast 2023-2028 ($ billion)
- Data Table on North America - Market size and forecast 2023-2028 ($ billion)
- Chart on North America - Year-over-year growth 2023-2028 (%)
- Data Table on North America - Year-over-year growth 2023-2028 (%)
- 9.4 Asia - Market size and forecast 2023-2028
- Chart on Asia - Market size and forecast 2023-2028 ($ billion)
- Data Table on Asia - Market size and forecast 2023-2028 ($ billion)
- Chart on Asia - Year-over-year growth 2023-2028 (%)
- Data Table on Asia - Year-over-year growth 2023-2028 (%)
- 9.5 Europe - Market size and forecast 2023-2028
- Chart on Europe - Market size and forecast 2023-2028 ($ billion)
- Data Table on Europe - Market size and forecast 2023-2028 ($ billion)
- Chart on Europe - Year-over-year growth 2023-2028 (%)
- Data Table on Europe - Year-over-year growth 2023-2028 (%)
- 9.6 Rest of World (ROW) - Market size and forecast 2023-2028
- Chart on Rest of World (ROW) - Market size and forecast 2023-2028 ($ billion)
- Data Table on Rest of World (ROW) - Market size and forecast 2023-2028 ($ billion)
- Chart on Rest of World (ROW) - Year-over-year growth 2023-2028 (%)
- Data Table on Rest of World (ROW) - Year-over-year growth 2023-2028 (%)
- 9.7 US - Market size and forecast 2023-2028
- Chart on US - Market size and forecast 2023-2028 ($ billion)
- Data Table on US - Market size and forecast 2023-2028 ($ billion)
- Chart on US - Year-over-year growth 2023-2028 (%)
- Data Table on US - Year-over-year growth 2023-2028 (%)
- 9.8 Canada - Market size and forecast 2023-2028
- Chart on Canada - Market size and forecast 2023-2028 ($ billion)
- Data Table on Canada - Market size and forecast 2023-2028 ($ billion)
- Chart on Canada - Year-over-year growth 2023-2028 (%)
- Data Table on Canada - Year-over-year growth 2023-2028 (%)
- 9.9 China - Market size and forecast 2023-2028
- Chart on China - Market size and forecast 2023-2028 ($ billion)
- Data Table on China - Market size and forecast 2023-2028 ($ billion)
- Chart on China - Year-over-year growth 2023-2028 (%)
- Data Table on China - Year-over-year growth 2023-2028 (%)
- 9.10 Japan - Market size and forecast 2023-2028
- Chart on Japan - Market size and forecast 2023-2028 ($ billion)
- Data Table on Japan - Market size and forecast 2023-2028 ($ billion)
- Chart on Japan - Year-over-year growth 2023-2028 (%)
- Data Table on Japan - Year-over-year growth 2023-2028 (%)
- 9.11 India - Market size and forecast 2023-2028
- Chart on India - Market size and forecast 2023-2028 ($ billion)
- Data Table on India - Market size and forecast 2023-2028 ($ billion)
- Chart on India - Year-over-year growth 2023-2028 (%)
- Data Table on India - Year-over-year growth 2023-2028 (%)
- 9.12 UK - Market size and forecast 2023-2028
- Chart on UK - Market size and forecast 2023-2028 ($ billion)
- Data Table on UK - Market size and forecast 2023-2028 ($ billion)
- Chart on UK - Year-over-year growth 2023-2028 (%)
- Data Table on UK - Year-over-year growth 2023-2028 (%)
- 9.13 South Korea - Market size and forecast 2023-2028
- Chart on South Korea - Market size and forecast 2023-2028 ($ billion)
- Data Table on South Korea - Market size and forecast 2023-2028 ($ billion)
- Chart on South Korea - Year-over-year growth 2023-2028 (%)
- Data Table on South Korea - Year-over-year growth 2023-2028 (%)
- 9.14 Germany - Market size and forecast 2023-2028
- Chart on Germany - Market size and forecast 2023-2028 ($ billion)
- Data Table on Germany - Market size and forecast 2023-2028 ($ billion)
- Chart on Germany - Year-over-year growth 2023-2028 (%)
- Data Table on Germany - Year-over-year growth 2023-2028 (%)
- 9.15 Italy - Market size and forecast 2023-2028
- Chart on Italy - Market size and forecast 2023-2028 ($ billion)
- Data Table on Italy - Market size and forecast 2023-2028 ($ billion)
- Chart on Italy - Year-over-year growth 2023-2028 (%)
- Data Table on Italy - Year-over-year growth 2023-2028 (%)
- 9.16 France - Market size and forecast 2023-2028
- Chart on France - Market size and forecast 2023-2028 ($ billion)
- Data Table on France - Market size and forecast 2023-2028 ($ billion)
- Chart on France - Year-over-year growth 2023-2028 (%)
- Data Table on France - Year-over-year growth 2023-2028 (%)
- 9.17 Market opportunity By Geographical Landscape
- Market opportunity By Geographical Landscape ($ billion)
- Data Tables on Market opportunity By Geographical Landscape ($ billion)
10 Drivers, Challenges, and Opportunity/Restraints
- 10.1 Market drivers
- 10.2 Market challenges
- 10.3 Impact of drivers and challenges
- Impact of drivers and challenges in 2023 and 2028
- 10.4 Market opportunities/restraints
11 Competitive Landscape
- 11.1 Overview
- 11.2 Competitive Landscape
- Overview on criticality of inputs and factors of differentiation
- 11.3 Landscape disruption
- Overview on factors of disruption
- 11.4 Industry risks
- Impact of key risks on business
12 Competitive Analysis
- 12.1 Companies profiled
- Companies covered
- 12.2 Company ranking index
- Company ranking index
- 12.3 Market positioning of companies
- Matrix on companies position and classification
- 12.4 Aurobindo Pharma Ltd.
- Aurobindo Pharma Ltd. - Overview
- Aurobindo Pharma Ltd. - Product / Service
- Aurobindo Pharma Ltd. - Key offerings
- SWOT
- 12.5 Cambrex Corp.
- Cambrex Corp. - Overview
- Cambrex Corp. - Product / Service
- Cambrex Corp. - Key news
- Cambrex Corp. - Key offerings
- SWOT
- 12.6 Cipla Inc.
- Cipla Inc. - Overview
- Cipla Inc. - Business segments
- Cipla Inc. - Key news
- Cipla Inc. - Key offerings
- Cipla Inc. - Segment focus
- SWOT
- 12.7 Dr Reddys Laboratories Ltd.
- Dr Reddys Laboratories Ltd. - Overview
- Dr Reddys Laboratories Ltd. - Business segments
- Dr Reddys Laboratories Ltd. - Key news
- Dr Reddys Laboratories Ltd. - Key offerings
- Dr Reddys Laboratories Ltd. - Segment focus
- SWOT
- 12.8 GlaxoSmithKline Plc
- GlaxoSmithKline Plc - Overview
- GlaxoSmithKline Plc - Business segments
- GlaxoSmithKline Plc - Key news
- GlaxoSmithKline Plc - Key offerings
- GlaxoSmithKline Plc - Segment focus
- SWOT
- 12.9 Merck KGaA
- Merck KGaA - Overview
- Merck KGaA - Business segments
- Merck KGaA - Key news
- Merck KGaA - Key offerings
- Merck KGaA - Segment focus
- SWOT
- 12.10 Novartis AG
- Novartis AG - Overview
- Novartis AG - Business segments
- Novartis AG - Key news
- Novartis AG - Key offerings
- Novartis AG - Segment focus
- SWOT
- 12.11 Pfizer Inc.
- Pfizer Inc. - Overview
- Pfizer Inc. - Product / Service
- Pfizer Inc. - Key news
- Pfizer Inc. - Key offerings
- SWOT
- 12.12 Teva Pharmaceutical Industries Ltd.
- Teva Pharmaceutical Industries Ltd. - Overview
- Teva Pharmaceutical Industries Ltd. - Business segments
- Teva Pharmaceutical Industries Ltd. - Key news
- Teva Pharmaceutical Industries Ltd. - Key offerings
- Teva Pharmaceutical Industries Ltd. - Segment focus
- SWOT
- 12.13 Viatris Inc.
- Viatris Inc. - Overview
- Viatris Inc. - Business segments
- Viatris Inc. - Key news
- Viatris Inc. - Key offerings
- Viatris Inc. - Segment focus
- SWOT
13 Appendix
- 13.1 Scope of the report
- 13.2 Inclusions and exclusions checklist
- Inclusions checklist
- Exclusions checklist
- 13.3 Currency conversion rates for US$
- Currency conversion rates for US$
- 13.4 Research methodology
- Research methodology
- 13.5 Data procurement
- Information sources
- 13.6 Data validation
- Data validation
- 13.7 Validation techniques employed for market sizing
- Validation techniques employed for market sizing
- 13.8 Data synthesis
- Data synthesis
- 13.9 360 degree market analysis
- 360 degree market analysis
- 13.10 List of abbreviations
- List of abbreviations
