|
|
市場調査レポート
商品コード
1602027
プリルスの世界市場 (2024~2028年)Global Prils Market 2024-2028 |
||||||

|
|||||||
カスタマイズ可能
|
|||||||


| プリルスの世界市場 (2024~2028年) |
|
出版日: 2024年11月07日
発行: TechNavio
ページ情報: 英文 158 Pages
納期: 即納可能
|

全表示
- 概要
- 図表
- 目次
プリルス市場 (2024~2028年)
プリルス市場は2023-2028年に5億9,630万米ドル分拡大し、予測期間中に4.2%のCAGRで成長すると予測されます。当レポートでは、プリルス市場の全体的な分析、市場規模・予測、動向、成長促進要因、課題、約25のベンダーを網羅したベンダー分析などを掲載しています。
当レポートでは、現在の市場シナリオ、最新動向と促進要因、市場環境全体に関する最新分析を提供しています。高齢者人口の増加、慢性疾患の増加、座りがちなライフスタイルなどが市場を牽引しています。
| 市場範囲 | |
|---|---|
| 基準年 | 2024年 |
| 終了年 | 2028年 |
| 予測期間 | 2024~2028年 |
| 成長モメンタム | 加速 |
| 前年比 (2024年) | 4% |
| CAGR | 4.2% |
| 増分額 | 5億9,630万米ドル |
当レポートでは、新薬開発が今後数年間のプリルス市場成長を牽引する主要因の1つであるとしています。また、戦略的開発の増加や医療分野への投資の増加は、市場の大きな需要につながります。
目次
第1章 エグゼクティブサマリー
- 市場概要
第2章 Technavio別分析
- 価格・ライフサイクル・顧客購入バスケット・採用率・購入基準の分析
- インプットの重要性と差別化の要因
- 混乱の要因
- 促進要因と課題の影響
第3章 市場情勢
- 市場エコシステム
- 市場の特徴
- バリューチェーン分析
第4章 市場規模
- 市場の定義
- 市場セグメント分析
- 市場規模 (2023年)
- 市場の見通し (2023~2028年)
第5章 市場規模実績
- プリルスの世界市場 (2018~2022年)
- 用途別分析 (2018~2022年)
- 地域別分析 (2018~2022年)
- 国別分析 (2018~2022年)
第6章 ファイブフォース分析
- ファイブフォースの要約
- 買い手の交渉力
- 供給企業の交渉力
- 新規参入業者の脅威
- 代替品の脅威
- 競争の脅威
- 市況
第7章 市場セグメンテーション:用途別
- 市場セグメント
- 比較:用途別
- 高血圧:市場規模と予測 (2023~2028年)
- 心不全:市場規模と予測 (2023~2028年)
- 慢性腎臓疾患:市場規模と予測 (2023~2028年)
- 市場機会:用途別
第8章 顧客情勢
- 顧客情勢の概要
第9章 地域別情勢
- 地域別セグメンテーション
- 地域別比較
- 北米:市場規模と予測 (2023~2028年)
- 欧州:市場規模と予測 (2023~2028年)
- アジア:市場規模と予測 (2023~2028年)
- 世界のその他の地域:市場規模と予測 (2023~2028年)
- 中国:市場規模と予測 (2023~2028年)
- 米国:市場規模と予測 (2023~2028年)
- インド:市場規模と予測 (2023~2028年)
- ドイツ:市場規模と予測 (2023~2028年)
- カナダ:市場規模と予測 (2023~2028年)
- 日本:市場規模と予測 (2023~2028年)
- 英国:市場規模と予測 (2023~2028年)
- フランス:市場規模と予測 (2023~2028年)
- メキシコ:市場規模と予測 (2023~2028年)
- イタリア:市場規模と予測 (2023~2028年)
- 市場機会:地域別
第10章 促進要因・課題・機会・抑制要因
- 市場促進要因
- 市場の課題
- 促進要因と課題の影響
- 市場の機会・抑制要因
第11章 競合情勢
- 概要
- 競合情勢
- 混乱の状況
- 業界のリスク
第12章 競合分析
- 企業プロファイル
- 企業ランキング指数
- 企業の市場ポジショニング
- Aurobindo Pharma Ltd.
- Dr Reddys Laboratories Ltd.
- Fazio Group of Companies
- Lupin Ltd.
- Manus Aktteva Biopharma LLP
- Merck KGaA
- Novartis AG
- Pfizer Inc.
- Sun Pharmaceutical Industries Ltd.
- Viatris Inc.
第13章 付録
Exhibits:
- Exhibits1: Executive Summary - Chart on Market Overview
- Exhibits2: Executive Summary - Data Table on Market Overview
- Exhibits3: Executive Summary - Chart on Global Market Characteristics
- Exhibits4: Executive Summary - Chart on Market By Geographical Landscape
- Exhibits5: Executive Summary - Chart on Market Segmentation by Application
- Exhibits6: Executive Summary - Chart on Incremental Growth
- Exhibits7: Executive Summary - Data Table on Incremental Growth
- Exhibits8: Executive Summary - Chart on Company Market Positioning
- Exhibits9: Analysis of price sensitivity, lifecycle, customer purchase basket, adoption rates, and purchase criteria
- Exhibits10: Overview on criticality of inputs and factors of differentiation
- Exhibits11: Overview on factors of disruption
- Exhibits12: Impact of drivers and challenges in 2023 and 2028
- Exhibits13: Parent Market
- Exhibits14: Data Table on - Parent Market
- Exhibits15: Market characteristics analysis
- Exhibits16: Value Chain Analysis
- Exhibits17: Offerings of companies included in the market definition
- Exhibits18: Market segments
- Exhibits19: Chart on Global - Market size and forecast 2023-2028 ($ million)
- Exhibits20: Data Table on Global - Market size and forecast 2023-2028 ($ million)
- Exhibits21: Chart on Global Market: Year-over-year growth 2023-2028 (%)
- Exhibits22: Data Table on Global Market: Year-over-year growth 2023-2028 (%)
- Exhibits23: Historic Market Size - Data Table on Global Prils Market 2018 - 2022 ($ million)
- Exhibits24: Historic Market Size - Application Segment 2018 - 2022 ($ million)
- Exhibits25: Historic Market Size - Geography Segment 2018 - 2022 ($ million)
- Exhibits26: Historic Market Size - Country Segment 2018 - 2022 ($ million)
- Exhibits27: Five forces analysis - Comparison between 2023 and 2028
- Exhibits28: Bargaining power of buyers - Impact of key factors 2023 and 2028
- Exhibits29: Bargaining power of suppliers - Impact of key factors in 2023 and 2028
- Exhibits30: Threat of new entrants - Impact of key factors in 2023 and 2028
- Exhibits31: Threat of substitutes - Impact of key factors in 2023 and 2028
- Exhibits32: Threat of rivalry - Impact of key factors in 2023 and 2028
- Exhibits33: Chart on Market condition - Five forces 2023 and 2028
- Exhibits34: Chart on Application - Market share 2023-2028 (%)
- Exhibits35: Data Table on Application - Market share 2023-2028 (%)
- Exhibits36: Chart on Comparison by Application
- Exhibits37: Data Table on Comparison by Application
- Exhibits38: Chart on Hypertension - Market size and forecast 2023-2028 ($ million)
- Exhibits39: Data Table on Hypertension - Market size and forecast 2023-2028 ($ million)
- Exhibits40: Chart on Hypertension - Year-over-year growth 2023-2028 (%)
- Exhibits41: Data Table on Hypertension - Year-over-year growth 2023-2028 (%)
- Exhibits42: Chart on Heart failure - Market size and forecast 2023-2028 ($ million)
- Exhibits43: Data Table on Heart failure - Market size and forecast 2023-2028 ($ million)
- Exhibits44: Chart on Heart failure - Year-over-year growth 2023-2028 (%)
- Exhibits45: Data Table on Heart failure - Year-over-year growth 2023-2028 (%)
- Exhibits46: Chart on Chronic kidney disorders - Market size and forecast 2023-2028 ($ million)
- Exhibits47: Data Table on Chronic kidney disorders - Market size and forecast 2023-2028 ($ million)
- Exhibits48: Chart on Chronic kidney disorders - Year-over-year growth 2023-2028 (%)
- Exhibits49: Data Table on Chronic kidney disorders - Year-over-year growth 2023-2028 (%)
- Exhibits50: Market opportunity by Application ($ million)
- Exhibits51: Data Table on Market opportunity by Application ($ million)
- Exhibits52: Analysis of price sensitivity, lifecycle, customer purchase basket, adoption rates, and purchase criteria
- Exhibits53: Chart on Market share By Geographical Landscape 2023-2028 (%)
- Exhibits54: Data Table on Market share By Geographical Landscape 2023-2028 (%)
- Exhibits55: Chart on Geographic comparison
- Exhibits56: Data Table on Geographic comparison
- Exhibits57: Chart on North America - Market size and forecast 2023-2028 ($ million)
- Exhibits58: Data Table on North America - Market size and forecast 2023-2028 ($ million)
- Exhibits59: Chart on North America - Year-over-year growth 2023-2028 (%)
- Exhibits60: Data Table on North America - Year-over-year growth 2023-2028 (%)
- Exhibits61: Chart on Europe - Market size and forecast 2023-2028 ($ million)
- Exhibits62: Data Table on Europe - Market size and forecast 2023-2028 ($ million)
- Exhibits63: Chart on Europe - Year-over-year growth 2023-2028 (%)
- Exhibits64: Data Table on Europe - Year-over-year growth 2023-2028 (%)
- Exhibits65: Chart on Asia - Market size and forecast 2023-2028 ($ million)
- Exhibits66: Data Table on Asia - Market size and forecast 2023-2028 ($ million)
- Exhibits67: Chart on Asia - Year-over-year growth 2023-2028 (%)
- Exhibits68: Data Table on Asia - Year-over-year growth 2023-2028 (%)
- Exhibits69: Chart on Rest of World (ROW) - Market size and forecast 2023-2028 ($ million)
- Exhibits70: Data Table on Rest of World (ROW) - Market size and forecast 2023-2028 ($ million)
- Exhibits71: Chart on Rest of World (ROW) - Year-over-year growth 2023-2028 (%)
- Exhibits72: Data Table on Rest of World (ROW) - Year-over-year growth 2023-2028 (%)
- Exhibits73: Chart on China - Market size and forecast 2023-2028 ($ million)
- Exhibits74: Data Table on China - Market size and forecast 2023-2028 ($ million)
- Exhibits75: Chart on China - Year-over-year growth 2023-2028 (%)
- Exhibits76: Data Table on China - Year-over-year growth 2023-2028 (%)
- Exhibits77: Chart on US - Market size and forecast 2023-2028 ($ million)
- Exhibits78: Data Table on US - Market size and forecast 2023-2028 ($ million)
- Exhibits79: Chart on US - Year-over-year growth 2023-2028 (%)
- Exhibits80: Data Table on US - Year-over-year growth 2023-2028 (%)
- Exhibits81: Chart on India - Market size and forecast 2023-2028 ($ million)
- Exhibits82: Data Table on India - Market size and forecast 2023-2028 ($ million)
- Exhibits83: Chart on India - Year-over-year growth 2023-2028 (%)
- Exhibits84: Data Table on India - Year-over-year growth 2023-2028 (%)
- Exhibits85: Chart on Germany - Market size and forecast 2023-2028 ($ million)
- Exhibits86: Data Table on Germany - Market size and forecast 2023-2028 ($ million)
- Exhibits87: Chart on Germany - Year-over-year growth 2023-2028 (%)
- Exhibits88: Data Table on Germany - Year-over-year growth 2023-2028 (%)
- Exhibits89: Chart on Canada - Market size and forecast 2023-2028 ($ million)
- Exhibits90: Data Table on Canada - Market size and forecast 2023-2028 ($ million)
- Exhibits91: Chart on Canada - Year-over-year growth 2023-2028 (%)
- Exhibits92: Data Table on Canada - Year-over-year growth 2023-2028 (%)
- Exhibits93: Chart on Japan - Market size and forecast 2023-2028 ($ million)
- Exhibits94: Data Table on Japan - Market size and forecast 2023-2028 ($ million)
- Exhibits95: Chart on Japan - Year-over-year growth 2023-2028 (%)
- Exhibits96: Data Table on Japan - Year-over-year growth 2023-2028 (%)
- Exhibits97: Chart on UK - Market size and forecast 2023-2028 ($ million)
- Exhibits98: Data Table on UK - Market size and forecast 2023-2028 ($ million)
- Exhibits99: Chart on UK - Year-over-year growth 2023-2028 (%)
- Exhibits100: Data Table on UK - Year-over-year growth 2023-2028 (%)
- Exhibits101: Chart on France - Market size and forecast 2023-2028 ($ million)
- Exhibits102: Data Table on France - Market size and forecast 2023-2028 ($ million)
- Exhibits103: Chart on France - Year-over-year growth 2023-2028 (%)
- Exhibits104: Data Table on France - Year-over-year growth 2023-2028 (%)
- Exhibits105: Chart on Mexico - Market size and forecast 2023-2028 ($ million)
- Exhibits106: Data Table on Mexico - Market size and forecast 2023-2028 ($ million)
- Exhibits107: Chart on Mexico - Year-over-year growth 2023-2028 (%)
- Exhibits108: Data Table on Mexico - Year-over-year growth 2023-2028 (%)
- Exhibits109: Chart on Italy - Market size and forecast 2023-2028 ($ million)
- Exhibits110: Data Table on Italy - Market size and forecast 2023-2028 ($ million)
- Exhibits111: Chart on Italy - Year-over-year growth 2023-2028 (%)
- Exhibits112: Data Table on Italy - Year-over-year growth 2023-2028 (%)
- Exhibits113: Market opportunity By Geographical Landscape ($ million)
- Exhibits114: Data Tables on Market opportunity By Geographical Landscape ($ million)
- Exhibits115: Impact of drivers and challenges in 2023 and 2028
- Exhibits116: Overview on criticality of inputs and factors of differentiation
- Exhibits117: Overview on factors of disruption
- Exhibits118: Impact of key risks on business
- Exhibits119: Companies covered
- Exhibits120: Company ranking index
- Exhibits121: Matrix on companies position and classification
- Exhibits122: Aurobindo Pharma Ltd. - Overview
- Exhibits123: Aurobindo Pharma Ltd. - Product / Service
- Exhibits124: Aurobindo Pharma Ltd. - Key offerings
- Exhibits125: SWOT
- Exhibits126: Dr Reddys Laboratories Ltd. - Overview
- Exhibits127: Dr Reddys Laboratories Ltd. - Business segments
- Exhibits128: Dr Reddys Laboratories Ltd. - Key news
- Exhibits129: Dr Reddys Laboratories Ltd. - Key offerings
- Exhibits130: Dr Reddys Laboratories Ltd. - Segment focus
- Exhibits131: SWOT
- Exhibits132: Fazio Group of Companies - Overview
- Exhibits133: Fazio Group of Companies - Product / Service
- Exhibits134: Fazio Group of Companies - Key offerings
- Exhibits135: SWOT
- Exhibits136: Lupin Ltd. - Overview
- Exhibits137: Lupin Ltd. - Business segments
- Exhibits138: Lupin Ltd. - Key news
- Exhibits139: Lupin Ltd. - Key offerings
- Exhibits140: Lupin Ltd. - Segment focus
- Exhibits141: SWOT
- Exhibits142: Manus Aktteva Biopharma LLP - Overview
- Exhibits143: Manus Aktteva Biopharma LLP - Product / Service
- Exhibits144: Manus Aktteva Biopharma LLP - Key offerings
- Exhibits145: SWOT
- Exhibits146: Merck KGaA - Overview
- Exhibits147: Merck KGaA - Business segments
- Exhibits148: Merck KGaA - Key news
- Exhibits149: Merck KGaA - Key offerings
- Exhibits150: Merck KGaA - Segment focus
- Exhibits151: SWOT
- Exhibits152: Novartis AG - Overview
- Exhibits153: Novartis AG - Business segments
- Exhibits154: Novartis AG - Key news
- Exhibits155: Novartis AG - Key offerings
- Exhibits156: Novartis AG - Segment focus
- Exhibits157: SWOT
- Exhibits158: Pfizer Inc. - Overview
- Exhibits159: Pfizer Inc. - Product / Service
- Exhibits160: Pfizer Inc. - Key news
- Exhibits161: Pfizer Inc. - Key offerings
- Exhibits162: SWOT
- Exhibits163: Sun Pharmaceutical Industries Ltd. - Overview
- Exhibits164: Sun Pharmaceutical Industries Ltd. - Product / Service
- Exhibits165: Sun Pharmaceutical Industries Ltd. - Key news
- Exhibits166: Sun Pharmaceutical Industries Ltd. - Key offerings
- Exhibits167: SWOT
- Exhibits168: Viatris Inc. - Overview
- Exhibits169: Viatris Inc. - Business segments
- Exhibits170: Viatris Inc. - Key news
- Exhibits171: Viatris Inc. - Key offerings
- Exhibits172: Viatris Inc. - Segment focus
- Exhibits173: SWOT
- Exhibits174: Inclusions checklist
- Exhibits175: Exclusions checklist
- Exhibits176: Currency conversion rates for US$
- Exhibits177: Research methodology
- Exhibits178: Information sources
- Exhibits179: Data validation
- Exhibits180: Validation techniques employed for market sizing
- Exhibits181: Data synthesis
- Exhibits182: 360 degree market analysis
- Exhibits183: List of abbreviations
Prils Market 2024-2028
The prils market is forecasted to grow by USD 596.3 mn during 2023-2028, accelerating at a CAGR of 4.2% during the forecast period. The report on the prils market provides a holistic analysis, market size and forecast, trends, growth drivers, and challenges, as well as vendor analysis covering around 25 vendors.
The report offers an up-to-date analysis regarding the current market scenario, the latest trends and drivers, and the overall market environment. The market is driven by rising geriatric population, increase in chronic diseases, and sedentary lifestyle.
| Market Scope | |
|---|---|
| Base Year | 2024 |
| End Year | 2028 |
| Series Year | 2024-2028 |
| Growth Momentum | Accelerate |
| YOY 2024 | 4% |
| CAGR | 4.2% |
| Incremental Value | $596.3 mn |
Technavio's prils market is segmented as below:
By Application
- Hypertension
- Heart failure
- Chronic kidney disorders
By Geographical Landscape
- North America
- Europe
- Asia
- Rest of World (ROW)
This study identifies the development of new drugs as one of the prime reasons driving the prils market growth during the next few years. Also, growing number of strategic developments and rising investment in medical sector will lead to sizable demand in the market.
The report on the prils market covers the following areas:
- Prils Market sizing
- Prils Market forecast
- Prils Market industry analysis
The robust vendor analysis is designed to help clients improve their market position, and in line with this, this report provides a detailed analysis of several leading prils market vendors that include Aurobindo Pharma Ltd., Cipla Inc., Deafarma Srl, Dr Reddys Laboratories Ltd., Farmhispania Group, Fazio Group of Companies, Glenmark Pharmaceuticals Ltd., Hiral Labs Ltd., Lupin Ltd., Manus Aktteva Biopharma LLP, Melody Healthcare, Merck KGaA, Neuland Laboratories, Novartis AG, Pfizer Inc., Prinston Pharmaceutical Inc., Sun Pharmaceutical Industries Ltd., Viatris Inc., and Zhejiang Changming Pharmaceutical Co. Ltd.. Also, the prils market analysis report includes information on upcoming trends and challenges that will influence market growth. This is to help companies strategize and leverage all forthcoming growth opportunities.
The study was conducted using an objective combination of primary and secondary information including inputs from key participants in the industry. The report contains a comprehensive market and vendor landscape in addition to an analysis of the key vendors.
The publisher presents a detailed picture of the market by the way of study, synthesis, and summation of data from multiple sources by an analysis of key parameters such as profit, pricing, competition, and promotions. It presents various market facets by identifying the key industry influencers. The data presented is comprehensive, reliable, and a result of extensive primary and secondary research. The market research reports provide a complete competitive landscape and an in-depth vendor selection methodology and analysis using qualitative and quantitative research to forecast accurate market growth.
Table of Contents
1 Executive Summary
- 1.1 Market overview
- Executive Summary - Chart on Market Overview
- Executive Summary - Data Table on Market Overview
- Executive Summary - Chart on Global Market Characteristics
- Executive Summary - Chart on Market By Geographical Landscape
- Executive Summary - Chart on Market Segmentation by Application
- Executive Summary - Chart on Incremental Growth
- Executive Summary - Data Table on Incremental Growth
- Executive Summary - Chart on Company Market Positioning
2 Technavio Analysis
- 2.1 Analysis of price sensitivity, lifecycle, customer purchase basket, adoption rates, and purchase criteria
- Analysis of price sensitivity, lifecycle, customer purchase basket, adoption rates, and purchase criteria
- 2.2 Criticality of inputs and Factors of differentiation
- Overview on criticality of inputs and factors of differentiation
- 2.3 Factors of disruption
- Overview on factors of disruption
- 2.4 Impact of drivers and challenges
- Impact of drivers and challenges in 2023 and 2028
3 Market Landscape
- 3.1 Market ecosystem
- Parent Market
- Data Table on - Parent Market
- 3.2 Market characteristics
- Market characteristics analysis
- 3.3 Value chain analysis
- Value Chain Analysis
4 Market Sizing
- 4.1 Market definition
- Offerings of companies included in the market definition
- 4.2 Market segment analysis
- Market segments
- 4.3 Market size 2023
- 4.4 Market outlook: Forecast for 2023-2028
- Chart on Global - Market size and forecast 2023-2028 ($ million)
- Data Table on Global - Market size and forecast 2023-2028 ($ million)
- Chart on Global Market: Year-over-year growth 2023-2028 (%)
- Data Table on Global Market: Year-over-year growth 2023-2028 (%)
5 Historic Market Size
- 5.1 Global Prils Market 2018 - 2022
- Historic Market Size - Data Table on Global Prils Market 2018 - 2022 ($ million)
- 5.2 Application segment analysis 2018 - 2022
- Historic Market Size - Application Segment 2018 - 2022 ($ million)
- 5.3 Geography segment analysis 2018 - 2022
- Historic Market Size - Geography Segment 2018 - 2022 ($ million)
- 5.4 Country segment analysis 2018 - 2022
- Historic Market Size - Country Segment 2018 - 2022 ($ million)
6 Five Forces Analysis
- 6.1 Five forces summary
- Five forces analysis - Comparison between 2023 and 2028
- 6.2 Bargaining power of buyers
- Bargaining power of buyers - Impact of key factors 2023 and 2028
- 6.3 Bargaining power of suppliers
- Bargaining power of suppliers - Impact of key factors in 2023 and 2028
- 6.4 Threat of new entrants
- Threat of new entrants - Impact of key factors in 2023 and 2028
- 6.5 Threat of substitutes
- Threat of substitutes - Impact of key factors in 2023 and 2028
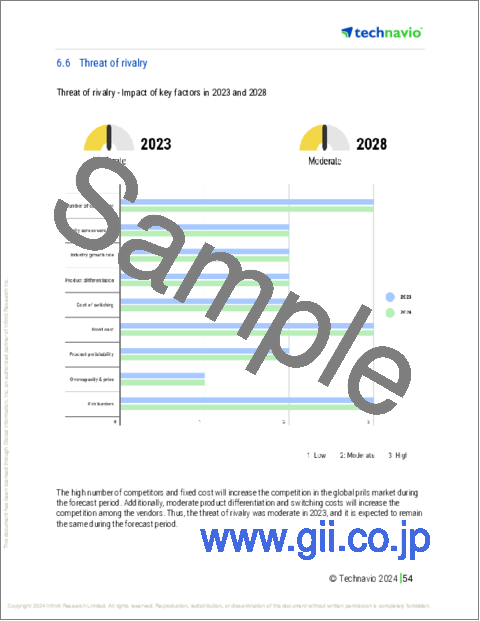
- 6.6 Threat of rivalry
- Threat of rivalry - Impact of key factors in 2023 and 2028
- 6.7 Market condition
- Chart on Market condition - Five forces 2023 and 2028
7 Market Segmentation by Application
- 7.1 Market segments
- Chart on Application - Market share 2023-2028 (%)
- Data Table on Application - Market share 2023-2028 (%)
- 7.2 Comparison by Application
- Chart on Comparison by Application
- Data Table on Comparison by Application
- 7.3 Hypertension - Market size and forecast 2023-2028
- Chart on Hypertension - Market size and forecast 2023-2028 ($ million)
- Data Table on Hypertension - Market size and forecast 2023-2028 ($ million)
- Chart on Hypertension - Year-over-year growth 2023-2028 (%)
- Data Table on Hypertension - Year-over-year growth 2023-2028 (%)
- 7.4 Heart failure - Market size and forecast 2023-2028
- Chart on Heart failure - Market size and forecast 2023-2028 ($ million)
- Data Table on Heart failure - Market size and forecast 2023-2028 ($ million)
- Chart on Heart failure - Year-over-year growth 2023-2028 (%)
- Data Table on Heart failure - Year-over-year growth 2023-2028 (%)
- 7.5 Chronic kidney disorders - Market size and forecast 2023-2028
- Chart on Chronic kidney disorders - Market size and forecast 2023-2028 ($ million)
- Data Table on Chronic kidney disorders - Market size and forecast 2023-2028 ($ million)
- Chart on Chronic kidney disorders - Year-over-year growth 2023-2028 (%)
- Data Table on Chronic kidney disorders - Year-over-year growth 2023-2028 (%)
- 7.6 Market opportunity by Application
- Market opportunity by Application ($ million)
- Data Table on Market opportunity by Application ($ million)
8 Customer Landscape
- 8.1 Customer landscape overview
- Analysis of price sensitivity, lifecycle, customer purchase basket, adoption rates, and purchase criteria
9 Geographic Landscape
- 9.1 Geographic segmentation
- Chart on Market share By Geographical Landscape 2023-2028 (%)
- Data Table on Market share By Geographical Landscape 2023-2028 (%)
- 9.2 Geographic comparison
- Chart on Geographic comparison
- Data Table on Geographic comparison
- 9.3 North America - Market size and forecast 2023-2028
- Chart on North America - Market size and forecast 2023-2028 ($ million)
- Data Table on North America - Market size and forecast 2023-2028 ($ million)
- Chart on North America - Year-over-year growth 2023-2028 (%)
- Data Table on North America - Year-over-year growth 2023-2028 (%)
- 9.4 Europe - Market size and forecast 2023-2028
- Chart on Europe - Market size and forecast 2023-2028 ($ million)
- Data Table on Europe - Market size and forecast 2023-2028 ($ million)
- Chart on Europe - Year-over-year growth 2023-2028 (%)
- Data Table on Europe - Year-over-year growth 2023-2028 (%)
- 9.5 Asia - Market size and forecast 2023-2028
- Chart on Asia - Market size and forecast 2023-2028 ($ million)
- Data Table on Asia - Market size and forecast 2023-2028 ($ million)
- Chart on Asia - Year-over-year growth 2023-2028 (%)
- Data Table on Asia - Year-over-year growth 2023-2028 (%)
- 9.6 Rest of World (ROW) - Market size and forecast 2023-2028
- Chart on Rest of World (ROW) - Market size and forecast 2023-2028 ($ million)
- Data Table on Rest of World (ROW) - Market size and forecast 2023-2028 ($ million)
- Chart on Rest of World (ROW) - Year-over-year growth 2023-2028 (%)
- Data Table on Rest of World (ROW) - Year-over-year growth 2023-2028 (%)
- 9.7 China - Market size and forecast 2023-2028
- Chart on China - Market size and forecast 2023-2028 ($ million)
- Data Table on China - Market size and forecast 2023-2028 ($ million)
- Chart on China - Year-over-year growth 2023-2028 (%)
- Data Table on China - Year-over-year growth 2023-2028 (%)
- 9.8 US - Market size and forecast 2023-2028
- Chart on US - Market size and forecast 2023-2028 ($ million)
- Data Table on US - Market size and forecast 2023-2028 ($ million)
- Chart on US - Year-over-year growth 2023-2028 (%)
- Data Table on US - Year-over-year growth 2023-2028 (%)
- 9.9 India - Market size and forecast 2023-2028
- Chart on India - Market size and forecast 2023-2028 ($ million)
- Data Table on India - Market size and forecast 2023-2028 ($ million)
- Chart on India - Year-over-year growth 2023-2028 (%)
- Data Table on India - Year-over-year growth 2023-2028 (%)
- 9.10 Germany - Market size and forecast 2023-2028
- Chart on Germany - Market size and forecast 2023-2028 ($ million)
- Data Table on Germany - Market size and forecast 2023-2028 ($ million)
- Chart on Germany - Year-over-year growth 2023-2028 (%)
- Data Table on Germany - Year-over-year growth 2023-2028 (%)
- 9.11 Canada - Market size and forecast 2023-2028
- Chart on Canada - Market size and forecast 2023-2028 ($ million)
- Data Table on Canada - Market size and forecast 2023-2028 ($ million)
- Chart on Canada - Year-over-year growth 2023-2028 (%)
- Data Table on Canada - Year-over-year growth 2023-2028 (%)
- 9.12 Japan - Market size and forecast 2023-2028
- Chart on Japan - Market size and forecast 2023-2028 ($ million)
- Data Table on Japan - Market size and forecast 2023-2028 ($ million)
- Chart on Japan - Year-over-year growth 2023-2028 (%)
- Data Table on Japan - Year-over-year growth 2023-2028 (%)
- 9.13 UK - Market size and forecast 2023-2028
- Chart on UK - Market size and forecast 2023-2028 ($ million)
- Data Table on UK - Market size and forecast 2023-2028 ($ million)
- Chart on UK - Year-over-year growth 2023-2028 (%)
- Data Table on UK - Year-over-year growth 2023-2028 (%)
- 9.14 France - Market size and forecast 2023-2028
- Chart on France - Market size and forecast 2023-2028 ($ million)
- Data Table on France - Market size and forecast 2023-2028 ($ million)
- Chart on France - Year-over-year growth 2023-2028 (%)
- Data Table on France - Year-over-year growth 2023-2028 (%)
- 9.15 Mexico - Market size and forecast 2023-2028
- Chart on Mexico - Market size and forecast 2023-2028 ($ million)
- Data Table on Mexico - Market size and forecast 2023-2028 ($ million)
- Chart on Mexico - Year-over-year growth 2023-2028 (%)
- Data Table on Mexico - Year-over-year growth 2023-2028 (%)
- 9.16 Italy - Market size and forecast 2023-2028
- Chart on Italy - Market size and forecast 2023-2028 ($ million)
- Data Table on Italy - Market size and forecast 2023-2028 ($ million)
- Chart on Italy - Year-over-year growth 2023-2028 (%)
- Data Table on Italy - Year-over-year growth 2023-2028 (%)
- 9.17 Market opportunity By Geographical Landscape
- Market opportunity By Geographical Landscape ($ million)
- Data Tables on Market opportunity By Geographical Landscape ($ million)
10 Drivers, Challenges, and Opportunity/Restraints
- 10.1 Market drivers
- 10.2 Market challenges
- 10.3 Impact of drivers and challenges
- Impact of drivers and challenges in 2023 and 2028
- 10.4 Market opportunities/restraints
11 Competitive Landscape
- 11.1 Overview
- 11.2 Competitive Landscape
- Overview on criticality of inputs and factors of differentiation
- 11.3 Landscape disruption
- Overview on factors of disruption
- 11.4 Industry risks
- Impact of key risks on business
12 Competitive Analysis
- 12.1 Companies profiled
- Companies covered
- 12.2 Company ranking index
- Company ranking index
- 12.3 Market positioning of companies
- Matrix on companies position and classification
- 12.4 Aurobindo Pharma Ltd.
- Aurobindo Pharma Ltd. - Overview
- Aurobindo Pharma Ltd. - Product / Service
- Aurobindo Pharma Ltd. - Key offerings
- SWOT
- 12.5 Dr Reddys Laboratories Ltd.
- Dr Reddys Laboratories Ltd. - Overview
- Dr Reddys Laboratories Ltd. - Business segments
- Dr Reddys Laboratories Ltd. - Key news
- Dr Reddys Laboratories Ltd. - Key offerings
- Dr Reddys Laboratories Ltd. - Segment focus
- SWOT
- 12.6 Fazio Group of Companies
- Fazio Group of Companies - Overview
- Fazio Group of Companies - Product / Service
- Fazio Group of Companies - Key offerings
- SWOT
- 12.7 Lupin Ltd.
- Lupin Ltd. - Overview
- Lupin Ltd. - Business segments
- Lupin Ltd. - Key news
- Lupin Ltd. - Key offerings
- Lupin Ltd. - Segment focus
- SWOT
- 12.8 Manus Aktteva Biopharma LLP
- Manus Aktteva Biopharma LLP - Overview
- Manus Aktteva Biopharma LLP - Product / Service
- Manus Aktteva Biopharma LLP - Key offerings
- SWOT
- 12.9 Merck KGaA
- Merck KGaA - Overview
- Merck KGaA - Business segments
- Merck KGaA - Key news
- Merck KGaA - Key offerings
- Merck KGaA - Segment focus
- SWOT
- 12.10 Novartis AG
- Novartis AG - Overview
- Novartis AG - Business segments
- Novartis AG - Key news
- Novartis AG - Key offerings
- Novartis AG - Segment focus
- SWOT
- 12.11 Pfizer Inc.
- Pfizer Inc. - Overview
- Pfizer Inc. - Product / Service
- Pfizer Inc. - Key news
- Pfizer Inc. - Key offerings
- SWOT
- 12.12 Sun Pharmaceutical Industries Ltd.
- Sun Pharmaceutical Industries Ltd. - Overview
- Sun Pharmaceutical Industries Ltd. - Product / Service
- Sun Pharmaceutical Industries Ltd. - Key news
- Sun Pharmaceutical Industries Ltd. - Key offerings
- SWOT
- 12.13 Viatris Inc.
- Viatris Inc. - Overview
- Viatris Inc. - Business segments
- Viatris Inc. - Key news
- Viatris Inc. - Key offerings
- Viatris Inc. - Segment focus
- SWOT
13 Appendix
- 13.1 Scope of the report
- 13.2 Inclusions and exclusions checklist
- Inclusions checklist
- Exclusions checklist
- 13.3 Currency conversion rates for US$
- Currency conversion rates for US$
- 13.4 Research methodology
- Research methodology
- 13.5 Data procurement
- Information sources
- 13.6 Data validation
- Data validation
- 13.7 Validation techniques employed for market sizing
- Validation techniques employed for market sizing
- 13.8 Data synthesis
- Data synthesis
- 13.9 360 degree market analysis
- 360 degree market analysis
- 13.10 List of abbreviations
- List of abbreviations

