|
|
市場調査レポート
商品コード
1601956
インフラモニタリングの世界市場(2024年~2028年)Global Infrastructure Monitoring Market 2024-2028 |
||||||

|
|||||||
カスタマイズ可能
|
|||||||


| インフラモニタリングの世界市場(2024年~2028年) |
|
出版日: 2024年11月13日
発行: TechNavio
ページ情報: 英文 166 Pages
納期: 即納可能
|

全表示
- 概要
- 図表
- 目次
インフラモニタリング市場(2024年~2028年)
インフラモニタリング市場は、2023年から2028年に94億270万米ドルとなり、予測期間中のCAGRは8.9%で成長すると予測されます。当レポートでは、インフラモニタリング市場の全体的な分析、市場規模・予測、動向、成長促進要因、課題、約25のベンダーを網羅したベンダー分析などを掲載しています。
現在の市場シナリオ、最新動向と促進要因、市場環境全体に関する最新分析を提供しています。市場は、世界の建設およびインフラ開拓活動の増加、構造ヘルスモニタリングへの設備投資の急増、インフラの老朽化、およびインフラモニタリングに関連する優れた利点によって牽引されています。
| 市場範囲 | |
|---|---|
| 基準年 | 2024年 |
| 終了年 | 2028年 |
| 予測期間 | 2024年~2028年 |
| 成長モメンタム | 加速 |
| 前年比(2024年) | 8.1% |
| CAGR | 8.9% |
| 増分額 | 94億270万米ドル |
本調査では、今後数年間のインフラモニタリング市場成長を牽引する主な要因の1つとして、土木インフラの保守・補修における自動化と標準化の採用を挙げています。また、IT・通信業界の繁栄や、近年のインフラの致命的な故障の増加も、市場の大きな需要につながると思われます。
目次
第1章 エグゼクティブサマリー
- 市場概要
第2章 Technavioによる分析
- 価格感度・ライフサイクル・顧客購入バスケット・採用率・購入基準の分析
- インプットの重要性と差別化の要因
- 混乱の要因
- 促進要因と課題の影響
第3章 市場情勢
- 市場エコシステム
- 市場の特徴
- バリューチェーン分析
第4章 市場規模
- 市場の定義
- 市場セグメント分析
- 市場規模、2023年
- 市場の見通し、2023年~2028年
第5章 市場規模実績
- インフラモニタリングの世界市場、2018年~2022年
- 技術セグメント分析、2018年~2022年
- 地域別セグメント分析、2018年~2022年
- 国別セグメント分析、2018年~2022年
第6章 定性分析
- インフラモニタリングの世界市場におけるAIの影響
第7章 ファイブフォース分析
- ファイブフォースの要約
- 買い手の交渉力
- 供給企業の交渉力
- 新規参入業者の脅威
- 代替品の脅威
- 競争の脅威
- 市況
第8章 市場セグメンテーション:技術別
- 市場セグメント
- 比較:技術別
- 無線:市場規模と予測、2023年~2028年
- 有線:市場規模と予測、2023年~2028年
- 市場機会:技術別
第9章 顧客情勢
- 顧客情勢の概要
第10章 地域別情勢
- 地域別セグメンテーション
- 地域別比較
- 欧州:市場規模と予測、2023年~2028年
- 北米:市場規模と予測、2023年~2028年
- アジア太平洋:市場規模と予測、2023年~2028年
- 中東・アフリカ:市場規模と予測、2023年~2028年
- 南米:市場規模と予測、2023年~2028年
- 米国:市場規模と予測、2023年~2028年
- ドイツ:市場規模と予測、2023年~2028年
- 中国:市場規模と予測、2023年~2028年
- カナダ:市場規模と予測、2023年~2028年
- 英国:市場規模と予測、2023年~2028年
- 日本:市場規模と予測、2023年~2028年
- インド:市場規模と予測、2023年~2028年
- 韓国:市場規模と予測、2023年~2028年
- フランス:市場規模と予測、2023年~2028年
- イタリア:市場規模と予測、2023年~2028年
- 市場機会:地域情勢別
第11章 促進要因・課題・機会・抑制要因
- 市場促進要因
- 市場の課題
- 促進要因と課題の影響
- 市場の機会・抑制要因
第12章 競合情勢
- 概要
- 競合情勢
- 混乱の状況
- 業界のリスク
第13章 競合分析
- 企業プロファイル
- 企業ランキング指数
- 企業の市場ポジショニング
- Acellent Technologies Inc.
- Campbell Scientific Inc.
- Emerson Electric Co.
- GEOKON LLC
- Mistras Group Inc.
- Sixense Group
- Spectris Plc
- STRUCTURAL MONITORING SYSTEMS plc
- Toshiba Corp.
- Xylem Inc.
第14章 付録
Exhibits:
- Exhibits1: Executive Summary - Chart on Market Overview
- Exhibits2: Executive Summary - Data Table on Market Overview
- Exhibits3: Executive Summary - Chart on Global Market Characteristics
- Exhibits4: Executive Summary - Chart on Market By Geographical Landscape
- Exhibits5: Executive Summary - Chart on Market Segmentation by Technology
- Exhibits6: Executive Summary - Chart on Incremental Growth
- Exhibits7: Executive Summary - Data Table on Incremental Growth
- Exhibits8: Executive Summary - Chart on Company Market Positioning
- Exhibits9: Analysis of price sensitivity, lifecycle, customer purchase basket, adoption rates, and purchase criteria
- Exhibits10: Overview on criticality of inputs and factors of differentiation
- Exhibits11: Overview on factors of disruption
- Exhibits12: Impact of drivers and challenges in 2023 and 2028
- Exhibits13: Parent Market
- Exhibits14: Data Table on - Parent Market
- Exhibits15: Market characteristics analysis
- Exhibits16: Value Chain Analysis
- Exhibits17: Offerings of companies included in the market definition
- Exhibits18: Market segments
- Exhibits19: Chart on Global - Market size and forecast 2023-2028 ($ million)
- Exhibits20: Data Table on Global - Market size and forecast 2023-2028 ($ million)
- Exhibits21: Chart on Global Market: Year-over-year growth 2023-2028 (%)
- Exhibits22: Data Table on Global Market: Year-over-year growth 2023-2028 (%)
- Exhibits23: Historic Market Size - Data Table on Global Infrastructure Monitoring Market 2018 - 2022 ($ million)
- Exhibits24: Historic Market Size - Technology Segment 2018 - 2022 ($ million)
- Exhibits25: Historic Market Size - Geography Segment 2018 - 2022 ($ million)
- Exhibits26: Historic Market Size - Country Segment 2018 - 2022 ($ million)
- Exhibits27: Five forces analysis - Comparison between 2023 and 2028
- Exhibits28: Bargaining power of buyers - Impact of key factors 2023 and 2028
- Exhibits29: Bargaining power of suppliers - Impact of key factors in 2023 and 2028
- Exhibits30: Threat of new entrants - Impact of key factors in 2023 and 2028
- Exhibits31: Threat of substitutes - Impact of key factors in 2023 and 2028
- Exhibits32: Threat of rivalry - Impact of key factors in 2023 and 2028
- Exhibits33: Chart on Market condition - Five forces 2023 and 2028
- Exhibits34: Chart on Technology - Market share 2023-2028 (%)
- Exhibits35: Data Table on Technology - Market share 2023-2028 (%)
- Exhibits36: Chart on Comparison by Technology
- Exhibits37: Data Table on Comparison by Technology
- Exhibits38: Chart on Wireless - Market size and forecast 2023-2028 ($ million)
- Exhibits39: Data Table on Wireless - Market size and forecast 2023-2028 ($ million)
- Exhibits40: Chart on Wireless - Year-over-year growth 2023-2028 (%)
- Exhibits41: Data Table on Wireless - Year-over-year growth 2023-2028 (%)
- Exhibits42: Chart on Wired - Market size and forecast 2023-2028 ($ million)
- Exhibits43: Data Table on Wired - Market size and forecast 2023-2028 ($ million)
- Exhibits44: Chart on Wired - Year-over-year growth 2023-2028 (%)
- Exhibits45: Data Table on Wired - Year-over-year growth 2023-2028 (%)
- Exhibits46: Market opportunity by Technology ($ million)
- Exhibits47: Data Table on Market opportunity by Technology ($ million)
- Exhibits48: Analysis of price sensitivity, lifecycle, customer purchase basket, adoption rates, and purchase criteria
- Exhibits49: Chart on Market share By Geographical Landscape 2023-2028 (%)
- Exhibits50: Data Table on Market share By Geographical Landscape 2023-2028 (%)
- Exhibits51: Chart on Geographic comparison
- Exhibits52: Data Table on Geographic comparison
- Exhibits53: Chart on Europe - Market size and forecast 2023-2028 ($ million)
- Exhibits54: Data Table on Europe - Market size and forecast 2023-2028 ($ million)
- Exhibits55: Chart on Europe - Year-over-year growth 2023-2028 (%)
- Exhibits56: Data Table on Europe - Year-over-year growth 2023-2028 (%)
- Exhibits57: Chart on North America - Market size and forecast 2023-2028 ($ million)
- Exhibits58: Data Table on North America - Market size and forecast 2023-2028 ($ million)
- Exhibits59: Chart on North America - Year-over-year growth 2023-2028 (%)
- Exhibits60: Data Table on North America - Year-over-year growth 2023-2028 (%)
- Exhibits61: Chart on APAC - Market size and forecast 2023-2028 ($ million)
- Exhibits62: Data Table on APAC - Market size and forecast 2023-2028 ($ million)
- Exhibits63: Chart on APAC - Year-over-year growth 2023-2028 (%)
- Exhibits64: Data Table on APAC - Year-over-year growth 2023-2028 (%)
- Exhibits65: Chart on Middle East and Africa - Market size and forecast 2023-2028 ($ million)
- Exhibits66: Data Table on Middle East and Africa - Market size and forecast 2023-2028 ($ million)
- Exhibits67: Chart on Middle East and Africa - Year-over-year growth 2023-2028 (%)
- Exhibits68: Data Table on Middle East and Africa - Year-over-year growth 2023-2028 (%)
- Exhibits69: Chart on South America - Market size and forecast 2023-2028 ($ million)
- Exhibits70: Data Table on South America - Market size and forecast 2023-2028 ($ million)
- Exhibits71: Chart on South America - Year-over-year growth 2023-2028 (%)
- Exhibits72: Data Table on South America - Year-over-year growth 2023-2028 (%)
- Exhibits73: Chart on US - Market size and forecast 2023-2028 ($ million)
- Exhibits74: Data Table on US - Market size and forecast 2023-2028 ($ million)
- Exhibits75: Chart on US - Year-over-year growth 2023-2028 (%)
- Exhibits76: Data Table on US - Year-over-year growth 2023-2028 (%)
- Exhibits77: Chart on Germany - Market size and forecast 2023-2028 ($ million)
- Exhibits78: Data Table on Germany - Market size and forecast 2023-2028 ($ million)
- Exhibits79: Chart on Germany - Year-over-year growth 2023-2028 (%)
- Exhibits80: Data Table on Germany - Year-over-year growth 2023-2028 (%)
- Exhibits81: Chart on China - Market size and forecast 2023-2028 ($ million)
- Exhibits82: Data Table on China - Market size and forecast 2023-2028 ($ million)
- Exhibits83: Chart on China - Year-over-year growth 2023-2028 (%)
- Exhibits84: Data Table on China - Year-over-year growth 2023-2028 (%)
- Exhibits85: Chart on Canada - Market size and forecast 2023-2028 ($ million)
- Exhibits86: Data Table on Canada - Market size and forecast 2023-2028 ($ million)
- Exhibits87: Chart on Canada - Year-over-year growth 2023-2028 (%)
- Exhibits88: Data Table on Canada - Year-over-year growth 2023-2028 (%)
- Exhibits89: Chart on UK - Market size and forecast 2023-2028 ($ million)
- Exhibits90: Data Table on UK - Market size and forecast 2023-2028 ($ million)
- Exhibits91: Chart on UK - Year-over-year growth 2023-2028 (%)
- Exhibits92: Data Table on UK - Year-over-year growth 2023-2028 (%)
- Exhibits93: Chart on Japan - Market size and forecast 2023-2028 ($ million)
- Exhibits94: Data Table on Japan - Market size and forecast 2023-2028 ($ million)
- Exhibits95: Chart on Japan - Year-over-year growth 2023-2028 (%)
- Exhibits96: Data Table on Japan - Year-over-year growth 2023-2028 (%)
- Exhibits97: Chart on India - Market size and forecast 2023-2028 ($ million)
- Exhibits98: Data Table on India - Market size and forecast 2023-2028 ($ million)
- Exhibits99: Chart on India - Year-over-year growth 2023-2028 (%)
- Exhibits100: Data Table on India - Year-over-year growth 2023-2028 (%)
- Exhibits101: Chart on South Korea - Market size and forecast 2023-2028 ($ million)
- Exhibits102: Data Table on South Korea - Market size and forecast 2023-2028 ($ million)
- Exhibits103: Chart on South Korea - Year-over-year growth 2023-2028 (%)
- Exhibits104: Data Table on South Korea - Year-over-year growth 2023-2028 (%)
- Exhibits105: Chart on France - Market size and forecast 2023-2028 ($ million)
- Exhibits106: Data Table on France - Market size and forecast 2023-2028 ($ million)
- Exhibits107: Chart on France - Year-over-year growth 2023-2028 (%)
- Exhibits108: Data Table on France - Year-over-year growth 2023-2028 (%)
- Exhibits109: Chart on Italy - Market size and forecast 2023-2028 ($ million)
- Exhibits110: Data Table on Italy - Market size and forecast 2023-2028 ($ million)
- Exhibits111: Chart on Italy - Year-over-year growth 2023-2028 (%)
- Exhibits112: Data Table on Italy - Year-over-year growth 2023-2028 (%)
- Exhibits113: Market opportunity By Geographical Landscape ($ million)
- Exhibits114: Data Tables on Market opportunity By Geographical Landscape ($ million)
- Exhibits115: Impact of drivers and challenges in 2023 and 2028
- Exhibits116: Overview on criticality of inputs and factors of differentiation
- Exhibits117: Overview on factors of disruption
- Exhibits118: Impact of key risks on business
- Exhibits119: Companies covered
- Exhibits120: Company ranking index
- Exhibits121: Matrix on companies position and classification
- Exhibits122: Acellent Technologies Inc. - Overview
- Exhibits123: Acellent Technologies Inc. - Product / Service
- Exhibits124: Acellent Technologies Inc. - Key offerings
- Exhibits125: SWOT
- Exhibits126: Campbell Scientific Inc. - Overview
- Exhibits127: Campbell Scientific Inc. - Product / Service
- Exhibits128: Campbell Scientific Inc. - Key offerings
- Exhibits129: SWOT
- Exhibits130: Emerson Electric Co. - Overview
- Exhibits131: Emerson Electric Co. - Business segments
- Exhibits132: Emerson Electric Co. - Key news
- Exhibits133: Emerson Electric Co. - Key offerings
- Exhibits134: Emerson Electric Co. - Segment focus
- Exhibits135: SWOT
- Exhibits136: GEOKON LLC - Overview
- Exhibits137: GEOKON LLC - Product / Service
- Exhibits138: GEOKON LLC - Key offerings
- Exhibits139: SWOT
- Exhibits140: Mistras Group Inc. - Overview
- Exhibits141: Mistras Group Inc. - Business segments
- Exhibits142: Mistras Group Inc. - Key news
- Exhibits143: Mistras Group Inc. - Key offerings
- Exhibits144: Mistras Group Inc. - Segment focus
- Exhibits145: SWOT
- Exhibits146: Sixense Group - Overview
- Exhibits147: Sixense Group - Product / Service
- Exhibits148: Sixense Group - Key offerings
- Exhibits149: SWOT
- Exhibits150: Spectris Plc - Overview
- Exhibits151: Spectris Plc - Business segments
- Exhibits152: Spectris Plc - Key news
- Exhibits153: Spectris Plc - Key offerings
- Exhibits154: Spectris Plc - Segment focus
- Exhibits155: SWOT
- Exhibits156: STRUCTURAL MONITORING SYSTEMS plc - Overview
- Exhibits157: STRUCTURAL MONITORING SYSTEMS plc - Business segments
- Exhibits158: STRUCTURAL MONITORING SYSTEMS plc - Key offerings
- Exhibits159: STRUCTURAL MONITORING SYSTEMS plc - Segment focus
- Exhibits160: SWOT
- Exhibits161: Toshiba Corp. - Overview
- Exhibits162: Toshiba Corp. - Business segments
- Exhibits163: Toshiba Corp. - Key news
- Exhibits164: Toshiba Corp. - Key offerings
- Exhibits165: Toshiba Corp. - Segment focus
- Exhibits166: SWOT
- Exhibits167: Xylem Inc. - Overview
- Exhibits168: Xylem Inc. - Business segments
- Exhibits169: Xylem Inc. - Key news
- Exhibits170: Xylem Inc. - Key offerings
- Exhibits171: Xylem Inc. - Segment focus
- Exhibits172: SWOT
- Exhibits173: Inclusions checklist
- Exhibits174: Exclusions checklist
- Exhibits175: Currency conversion rates for US$
- Exhibits176: Research methodology
- Exhibits177: Information sources
- Exhibits178: Data validation
- Exhibits179: Validation techniques employed for market sizing
- Exhibits180: Data synthesis
- Exhibits181: 360 degree market analysis
- Exhibits182: List of abbreviations
Infrastructure Monitoring Market 2024-2028
The infrastructure monitoring market is forecasted to grow by USD 9402.7 mn during 2023-2028, accelerating at a CAGR of 8.9% during the forecast period. The report on the infrastructure monitoring market provides a holistic analysis, market size and forecast, trends, growth drivers, and challenges, as well as vendor analysis covering around 25 vendors.
The report offers an up-to-date analysis regarding the current market scenario, the latest trends and drivers, and the overall market environment. The market is driven by rise in global construction and infrastructure development activities, surging capital investments in structural health monitoring, and aging infrastructure and superior benefits associated with infrastructure monitoring.
| Market Scope | |
|---|---|
| Base Year | 2024 |
| End Year | 2028 |
| Series Year | 2024-2028 |
| Growth Momentum | Accelerate |
| YOY 2024 | 8.1% |
| CAGR | 8.9% |
| Incremental Value | $9402.7 mn |
Technavio's infrastructure monitoring market is segmented as below:
By Technology
- Wireless
- Wired
By Geographical Landscape
- Europe
- North America
- APAC
- Middle East and Africa
- South America
This study identifies the adoption of automation and standardization in maintenance and repair of civil infrastructure as one of the prime reasons driving the infrastructure monitoring market growth during the next few years. Also, thriving it and telecommunications industry and rising incidences of catastrophic failure of infrastructure in recent years will lead to sizable demand in the market.
The report on the infrastructure monitoring market covers the following areas:
- Infrastructure Monitoring Market sizing
- Infrastructure Monitoring Market forecast
- Infrastructure Monitoring Market industry analysis
The robust vendor analysis is designed to help clients improve their market position, and in line with this, this report provides a detailed analysis of several leading infrastructure monitoring market vendors that include Acellent Technologies Inc., AES Engineering, Campbell Scientific Inc., Digitexx Systems Ltd., Emerson Electric Co., Geocomp Corp., GEOKON LLC, Geomotion Singapore Pte. Ltd., Mabey Holdings Ltd., Mistras Group Inc., Monnit Corp., Nova Ventures Group Corp., OYO Corp., RST Instruments Ltd., Sisgeo S.r.l., Sixense Group, Spectris Plc, STRUCTURAL MONITORING SYSTEMS plc, Toshiba Corp., and Xylem Inc.. Also, the infrastructure monitoring market analysis report includes information on upcoming trends and challenges that will influence market growth. This is to help companies strategize and leverage all forthcoming growth opportunities.
The study was conducted using an objective combination of primary and secondary information including inputs from key participants in the industry. The report contains a comprehensive market and vendor landscape in addition to an analysis of the key vendors.
The publisher presents a detailed picture of the market by the way of study, synthesis, and summation of data from multiple sources by an analysis of key parameters such as profit, pricing, competition, and promotions. It presents various market facets by identifying the key industry influencers. The data presented is comprehensive, reliable, and a result of extensive primary and secondary research. The market research reports provide a complete competitive landscape and an in-depth vendor selection methodology and analysis using qualitative and quantitative research to forecast accurate market growth.
Table of Contents
1 Executive Summary
- 1.1 Market overview
- Executive Summary - Chart on Market Overview
- Executive Summary - Data Table on Market Overview
- Executive Summary - Chart on Global Market Characteristics
- Executive Summary - Chart on Market By Geographical Landscape
- Executive Summary - Chart on Market Segmentation by Technology
- Executive Summary - Chart on Incremental Growth
- Executive Summary - Data Table on Incremental Growth
- Executive Summary - Chart on Company Market Positioning
2 Technavio Analysis
- 2.1 Analysis of price sensitivity, lifecycle, customer purchase basket, adoption rates, and purchase criteria
- Analysis of price sensitivity, lifecycle, customer purchase basket, adoption rates, and purchase criteria
- 2.2 Criticality of inputs and Factors of differentiation
- Overview on criticality of inputs and factors of differentiation
- 2.3 Factors of disruption
- Overview on factors of disruption
- 2.4 Impact of drivers and challenges
- Impact of drivers and challenges in 2023 and 2028
3 Market Landscape
- 3.1 Market ecosystem
- Parent Market
- Data Table on - Parent Market
- 3.2 Market characteristics
- Market characteristics analysis
- 3.3 Value chain analysis
- Value Chain Analysis
4 Market Sizing
- 4.1 Market definition
- Offerings of companies included in the market definition
- 4.2 Market segment analysis
- Market segments
- 4.3 Market size 2023
- 4.4 Market outlook: Forecast for 2023-2028
- Chart on Global - Market size and forecast 2023-2028 ($ million)
- Data Table on Global - Market size and forecast 2023-2028 ($ million)
- Chart on Global Market: Year-over-year growth 2023-2028 (%)
- Data Table on Global Market: Year-over-year growth 2023-2028 (%)
5 Historic Market Size
- 5.1 Global Infrastructure Monitoring Market 2018 - 2022
- Historic Market Size - Data Table on Global Infrastructure Monitoring Market 2018 - 2022 ($ million)
- 5.2 Technology segment analysis 2018 - 2022
- Historic Market Size - Technology Segment 2018 - 2022 ($ million)
- 5.3 Geography segment analysis 2018 - 2022
- Historic Market Size - Geography Segment 2018 - 2022 ($ million)
- 5.4 Country segment analysis 2018 - 2022
- Historic Market Size - Country Segment 2018 - 2022 ($ million)
6 Qualitative Analysis
- 6.1 The impact of AI in Global Infrastructure Monitoring Market
7 Five Forces Analysis
- 7.1 Five forces summary
- Five forces analysis - Comparison between 2023 and 2028
- 7.2 Bargaining power of buyers
- Bargaining power of buyers - Impact of key factors 2023 and 2028
- 7.3 Bargaining power of suppliers
- Bargaining power of suppliers - Impact of key factors in 2023 and 2028
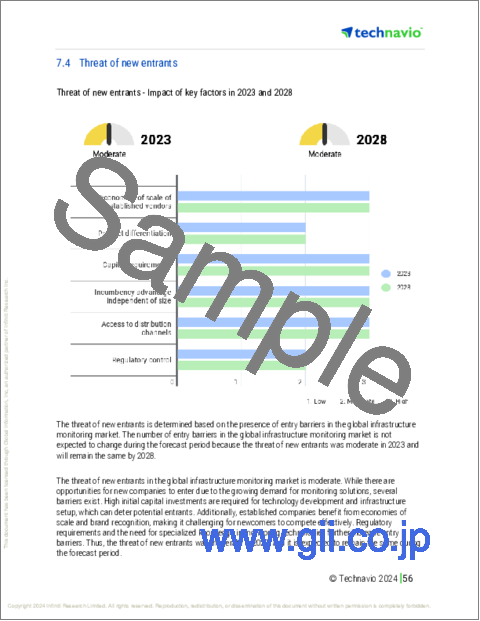
- 7.4 Threat of new entrants
- Threat of new entrants - Impact of key factors in 2023 and 2028
- 7.5 Threat of substitutes
- Threat of substitutes - Impact of key factors in 2023 and 2028
- 7.6 Threat of rivalry
- Threat of rivalry - Impact of key factors in 2023 and 2028
- 7.7 Market condition
- Chart on Market condition - Five forces 2023 and 2028
8 Market Segmentation by Technology
- 8.1 Market segments
- Chart on Technology - Market share 2023-2028 (%)
- Data Table on Technology - Market share 2023-2028 (%)
- 8.2 Comparison by Technology
- Chart on Comparison by Technology
- Data Table on Comparison by Technology
- 8.3 Wireless - Market size and forecast 2023-2028
- Chart on Wireless - Market size and forecast 2023-2028 ($ million)
- Data Table on Wireless - Market size and forecast 2023-2028 ($ million)
- Chart on Wireless - Year-over-year growth 2023-2028 (%)
- Data Table on Wireless - Year-over-year growth 2023-2028 (%)
- 8.4 Wired - Market size and forecast 2023-2028
- Chart on Wired - Market size and forecast 2023-2028 ($ million)
- Data Table on Wired - Market size and forecast 2023-2028 ($ million)
- Chart on Wired - Year-over-year growth 2023-2028 (%)
- Data Table on Wired - Year-over-year growth 2023-2028 (%)
- 8.5 Market opportunity by Technology
- Market opportunity by Technology ($ million)
- Data Table on Market opportunity by Technology ($ million)
9 Customer Landscape
- 9.1 Customer landscape overview
- Analysis of price sensitivity, lifecycle, customer purchase basket, adoption rates, and purchase criteria
10 Geographic Landscape
- 10.1 Geographic segmentation
- Chart on Market share By Geographical Landscape 2023-2028 (%)
- Data Table on Market share By Geographical Landscape 2023-2028 (%)
- 10.2 Geographic comparison
- Chart on Geographic comparison
- Data Table on Geographic comparison
- 10.3 Europe - Market size and forecast 2023-2028
- Chart on Europe - Market size and forecast 2023-2028 ($ million)
- Data Table on Europe - Market size and forecast 2023-2028 ($ million)
- Chart on Europe - Year-over-year growth 2023-2028 (%)
- Data Table on Europe - Year-over-year growth 2023-2028 (%)
- 10.4 North America - Market size and forecast 2023-2028
- Chart on North America - Market size and forecast 2023-2028 ($ million)
- Data Table on North America - Market size and forecast 2023-2028 ($ million)
- Chart on North America - Year-over-year growth 2023-2028 (%)
- Data Table on North America - Year-over-year growth 2023-2028 (%)
- 10.5 APAC - Market size and forecast 2023-2028
- Chart on APAC - Market size and forecast 2023-2028 ($ million)
- Data Table on APAC - Market size and forecast 2023-2028 ($ million)
- Chart on APAC - Year-over-year growth 2023-2028 (%)
- Data Table on APAC - Year-over-year growth 2023-2028 (%)
- 10.6 Middle East and Africa - Market size and forecast 2023-2028
- Chart on Middle East and Africa - Market size and forecast 2023-2028 ($ million)
- Data Table on Middle East and Africa - Market size and forecast 2023-2028 ($ million)
- Chart on Middle East and Africa - Year-over-year growth 2023-2028 (%)
- Data Table on Middle East and Africa - Year-over-year growth 2023-2028 (%)
- 10.7 South America - Market size and forecast 2023-2028
- Chart on South America - Market size and forecast 2023-2028 ($ million)
- Data Table on South America - Market size and forecast 2023-2028 ($ million)
- Chart on South America - Year-over-year growth 2023-2028 (%)
- Data Table on South America - Year-over-year growth 2023-2028 (%)
- 10.8 US - Market size and forecast 2023-2028
- Chart on US - Market size and forecast 2023-2028 ($ million)
- Data Table on US - Market size and forecast 2023-2028 ($ million)
- Chart on US - Year-over-year growth 2023-2028 (%)
- Data Table on US - Year-over-year growth 2023-2028 (%)
- 10.9 Germany - Market size and forecast 2023-2028
- Chart on Germany - Market size and forecast 2023-2028 ($ million)
- Data Table on Germany - Market size and forecast 2023-2028 ($ million)
- Chart on Germany - Year-over-year growth 2023-2028 (%)
- Data Table on Germany - Year-over-year growth 2023-2028 (%)
- 10.10 China - Market size and forecast 2023-2028
- Chart on China - Market size and forecast 2023-2028 ($ million)
- Data Table on China - Market size and forecast 2023-2028 ($ million)
- Chart on China - Year-over-year growth 2023-2028 (%)
- Data Table on China - Year-over-year growth 2023-2028 (%)
- 10.11 Canada - Market size and forecast 2023-2028
- Chart on Canada - Market size and forecast 2023-2028 ($ million)
- Data Table on Canada - Market size and forecast 2023-2028 ($ million)
- Chart on Canada - Year-over-year growth 2023-2028 (%)
- Data Table on Canada - Year-over-year growth 2023-2028 (%)
- 10.12 UK - Market size and forecast 2023-2028
- Chart on UK - Market size and forecast 2023-2028 ($ million)
- Data Table on UK - Market size and forecast 2023-2028 ($ million)
- Chart on UK - Year-over-year growth 2023-2028 (%)
- Data Table on UK - Year-over-year growth 2023-2028 (%)
- 10.13 Japan - Market size and forecast 2023-2028
- Chart on Japan - Market size and forecast 2023-2028 ($ million)
- Data Table on Japan - Market size and forecast 2023-2028 ($ million)
- Chart on Japan - Year-over-year growth 2023-2028 (%)
- Data Table on Japan - Year-over-year growth 2023-2028 (%)
- 10.14 India - Market size and forecast 2023-2028
- Chart on India - Market size and forecast 2023-2028 ($ million)
- Data Table on India - Market size and forecast 2023-2028 ($ million)
- Chart on India - Year-over-year growth 2023-2028 (%)
- Data Table on India - Year-over-year growth 2023-2028 (%)
- 10.15 South Korea - Market size and forecast 2023-2028
- Chart on South Korea - Market size and forecast 2023-2028 ($ million)
- Data Table on South Korea - Market size and forecast 2023-2028 ($ million)
- Chart on South Korea - Year-over-year growth 2023-2028 (%)
- Data Table on South Korea - Year-over-year growth 2023-2028 (%)
- 10.16 France - Market size and forecast 2023-2028
- Chart on France - Market size and forecast 2023-2028 ($ million)
- Data Table on France - Market size and forecast 2023-2028 ($ million)
- Chart on France - Year-over-year growth 2023-2028 (%)
- Data Table on France - Year-over-year growth 2023-2028 (%)
- 10.17 Italy - Market size and forecast 2023-2028
- Chart on Italy - Market size and forecast 2023-2028 ($ million)
- Data Table on Italy - Market size and forecast 2023-2028 ($ million)
- Chart on Italy - Year-over-year growth 2023-2028 (%)
- Data Table on Italy - Year-over-year growth 2023-2028 (%)
- 10.18 Market opportunity By Geographical Landscape
- Market opportunity By Geographical Landscape ($ million)
- Data Tables on Market opportunity By Geographical Landscape ($ million)
11 Drivers, Challenges, and Opportunity/Restraints
- 11.1 Market drivers
- 11.2 Market challenges
- 11.3 Impact of drivers and challenges
- Impact of drivers and challenges in 2023 and 2028
- 11.4 Market opportunities/restraints
12 Competitive Landscape
- 12.1 Overview
- 12.2 Competitive Landscape
- Overview on criticality of inputs and factors of differentiation
- 12.3 Landscape disruption
- Overview on factors of disruption
- 12.4 Industry risks
- Impact of key risks on business
13 Competitive Analysis
- 13.1 Companies profiled
- Companies covered
- 13.2 Company ranking index
- Company ranking index
- 13.3 Market positioning of companies
- Matrix on companies position and classification
- 13.4 Acellent Technologies Inc.
- Acellent Technologies Inc. - Overview
- Acellent Technologies Inc. - Product / Service
- Acellent Technologies Inc. - Key offerings
- SWOT
- 13.5 Campbell Scientific Inc.
- Campbell Scientific Inc. - Overview
- Campbell Scientific Inc. - Product / Service
- Campbell Scientific Inc. - Key offerings
- SWOT
- 13.6 Emerson Electric Co.
- Emerson Electric Co. - Overview
- Emerson Electric Co. - Business segments
- Emerson Electric Co. - Key news
- Emerson Electric Co. - Key offerings
- Emerson Electric Co. - Segment focus
- SWOT
- 13.7 GEOKON LLC
- GEOKON LLC - Overview
- GEOKON LLC - Product / Service
- GEOKON LLC - Key offerings
- SWOT
- 13.8 Mistras Group Inc.
- Mistras Group Inc. - Overview
- Mistras Group Inc. - Business segments
- Mistras Group Inc. - Key news
- Mistras Group Inc. - Key offerings
- Mistras Group Inc. - Segment focus
- SWOT
- 13.9 Sixense Group
- Sixense Group - Overview
- Sixense Group - Product / Service
- Sixense Group - Key offerings
- SWOT
- 13.10 Spectris Plc
- Spectris Plc - Overview
- Spectris Plc - Business segments
- Spectris Plc - Key news
- Spectris Plc - Key offerings
- Spectris Plc - Segment focus
- SWOT
- 13.11 STRUCTURAL MONITORING SYSTEMS plc
- STRUCTURAL MONITORING SYSTEMS plc - Overview
- STRUCTURAL MONITORING SYSTEMS plc - Business segments
- STRUCTURAL MONITORING SYSTEMS plc - Key offerings
- STRUCTURAL MONITORING SYSTEMS plc - Segment focus
- SWOT
- 13.12 Toshiba Corp.
- Toshiba Corp. - Overview
- Toshiba Corp. - Business segments
- Toshiba Corp. - Key news
- Toshiba Corp. - Key offerings
- Toshiba Corp. - Segment focus
- SWOT
- 13.13 Xylem Inc.
- Xylem Inc. - Overview
- Xylem Inc. - Business segments
- Xylem Inc. - Key news
- Xylem Inc. - Key offerings
- Xylem Inc. - Segment focus
- SWOT
14 Appendix
- 14.1 Scope of the report
- 14.2 Inclusions and exclusions checklist
- Inclusions checklist
- Exclusions checklist
- 14.3 Currency conversion rates for US$
- Currency conversion rates for US$
- 14.4 Research methodology
- Research methodology
- 14.5 Data procurement
- Information sources
- 14.6 Data validation
- Data validation
- 14.7 Validation techniques employed for market sizing
- Validation techniques employed for market sizing
- 14.8 Data synthesis
- Data synthesis
- 14.9 360 degree market analysis
- 360 degree market analysis
- 14.10 List of abbreviations
- List of abbreviations
