|
|
市場調査レポート
商品コード
1601905
ドライハニーの世界市場 (2024~2028年)Global Dry Honey Market 2024-2028 |
||||||

|
|||||||
カスタマイズ可能
|
|||||||


| ドライハニーの世界市場 (2024~2028年) |
|
出版日: 2024年11月15日
発行: TechNavio
ページ情報: 英文 169 Pages
納期: 即納可能
|

全表示
- 概要
- 図表
- 目次
ドライハニー市場 (2024~2028年)
ドライハニー (乾燥蜂蜜) 市場は2023-2028年に2億5,760万米ドル分拡大し、予測期間中に3.7%のCAGRで成長すると予測されます。当レポートでは、ドライハニー市場の全体的な分析、市場規模・予測、動向、成長促進要因、課題、約25のベンダーを網羅したベンダー分析などを掲載しています。
当レポートでは、現在の市場シナリオ、最新動向と促進要因、市場環境全体に関する最新分析を提供しています。市場は、ドライハニーを摂取することによる健康上のメリット、食品中の健康的な成分、世界の組織的小売業の成長によって牽引されています。
| 市場範囲 | |
|---|---|
| 基準年 | 2024年 |
| 終了年 | 2028年 |
| 予測期間 | 2024~2028年 |
| 成長モメンタム | 加速 |
| 前年比 (2024年) | 3.5% |
| CAGR | 3.7% |
| 増分額 | 2億5,760万米ドル |
当レポートでは、今後数年間におけるドライハニー市場の成長を促進する主な理由の一つとして、天然ミツバチの生息地の回復を挙げています。また、オンラインショッピングへの嗜好の高まりや、食品・飲料業界におけるドライハニーの革新的な活用方法が、市場の大きな需要につながります。
目次
第1章 エグゼクティブサマリー
- 市場概要
第2章 Technavioによる分析
- 価格感応度・ライフサイクル・顧客購入バスケット・採用率・購入基準の分析
- インプットの重要性と差別化の要因
- 混乱の要因
- 促進要因と課題の影響
第3章 市場情勢
- 市場エコシステム
- 市場の特徴
- バリューチェーン分析
第4章 市場規模
- 市場の定義
- 市場セグメント分析
- 地域別分析 (2018~2022年)
- 国別分析 (2018~2022年)
第5章 市場規模実績
- ドライハニーの世界市場 (2018~2022年)
- 製品別分析 (2018~2022年)
- 地域別分析 (2018~2022年)
- 国別分析 (2018~2022年)
第6章 定性分析
- AIの影響:ドライハニーの世界市場
第7章 ファイブフォース分析
- ファイブフォースの要約
- 買い手の交渉力
- 供給企業の交渉力
- 新規参入業者の脅威
- 代替品の脅威
- 競争の脅威
- 市況
第8章 市場セグメンテーション:製品別
- 市場セグメント
- 比較:製品別
- 従来型:市場規模と予測 (2023~2028年)
- オーガニック:市場規模と予測 (2023~2028年)
- 市場機会:製品別
第9章 顧客情勢
- 顧客情勢の概要
第10章 地域別情勢
- 地域別セグメンテーション
- 地域別比較
- 北米:市場規模と予測 (2023~2028年)
- 欧州:市場規模と予測 (2023~2028年)
- アジア太平洋:市場規模と予測 (2023~2028年)
- 南米:市場規模と予測 (2023~2028年)
- 中東・アフリカ:市場規模と予測 (2023~2028年)
- 米国:市場規模と予測 (2023~2028年)
- カナダ:市場規模と予測 (2023~2028年)
- ドイツ:市場規模と予測 (2023~2028年)
- 英国:市場規模と予測 (2023~2028年)
- フランス:市場規模と予測 (2023~2028年)
- 中国:市場規模と予測 (2023~2028年)
- イタリア:市場規模と予測 (2023~2028年)
- 日本:市場規模と予測 (2023~2028年)
- インド:市場規模と予測 (2023~2028年)
- 韓国:市場規模と予測 (2023~2028年)
- 市場機会:地域別
第11章 促進要因・課題・機会・抑制要因
- 市場促進要因
- 市場の課題
- 促進要因と課題の影響
- 市場の機会・抑制要因
第12章 競合情勢
- 概要
- 競合情勢
- 混乱の状況
- 業界のリスク
第13章 競合分析
- 企業プロファイル
- 企業ランキング指数
- 企業の市場ポジショニング
- Archer Daniels Midland Co.
- ASR GROUP
- Associated British Foods Plc
- Blue Chip Group
- Delee Foods Group Co. Ltd.
- Holy Natural
- Honibe
- Melland Ecogreen Technology Co. Ltd.
- Norevo GmbH
- SoulBee Honey
第14章 付録
Exhibits:
- Exhibits1: Executive Summary - Chart on Market Overview
- Exhibits2: Executive Summary - Data Table on Market Overview
- Exhibits3: Executive Summary - Chart on Global Market Characteristics
- Exhibits4: Executive Summary - Chart on Market By Geographical Landscape
- Exhibits5: Executive Summary - Chart on Market Segmentation by Product
- Exhibits6: Executive Summary - Chart on Incremental Growth
- Exhibits7: Executive Summary - Data Table on Incremental Growth
- Exhibits8: Executive Summary - Chart on Company Market Positioning
- Exhibits9: Analysis of price sensitivity, lifecycle, customer purchase basket, adoption rates, and purchase criteria
- Exhibits10: Overview on criticality of inputs and factors of differentiation
- Exhibits11: Overview on factors of disruption
- Exhibits12: Impact of drivers and challenges in 2023 and 2028
- Exhibits13: Parent Market
- Exhibits14: Data Table on - Parent Market
- Exhibits15: Market characteristics analysis
- Exhibits16: Value Chain Analysis
- Exhibits17: Offerings of companies included in the market definition
- Exhibits18: Market segments
- Exhibits19: Chart on Global - Market size and forecast 2023-2028 ($ million)
- Exhibits20: Data Table on Global - Market size and forecast 2023-2028 ($ million)
- Exhibits21: Chart on Global Market: Year-over-year growth 2023-2028 (%)
- Exhibits22: Data Table on Global Market: Year-over-year growth 2023-2028 (%)
- Exhibits23: Historic Market Size - Data Table on Global Dry Honey Market 2018 - 2022 ($ million)
- Exhibits24: Historic Market Size - Product Segment 2018 - 2022 ($ million)
- Exhibits25: Historic Market Size - Geography Segment 2018 - 2022 ($ million)
- Exhibits26: Historic Market Size - Country Segment 2018 - 2022 ($ million)
- Exhibits27: Five forces analysis - Comparison between 2023 and 2028
- Exhibits28: Bargaining power of buyers - Impact of key factors 2023 and 2028
- Exhibits29: Bargaining power of suppliers - Impact of key factors in 2023 and 2028
- Exhibits30: Threat of new entrants - Impact of key factors in 2023 and 2028
- Exhibits31: Threat of substitutes - Impact of key factors in 2023 and 2028
- Exhibits32: Threat of rivalry - Impact of key factors in 2023 and 2028
- Exhibits33: Chart on Market condition - Five forces 2023 and 2028
- Exhibits34: Chart on Product - Market share 2023-2028 (%)
- Exhibits35: Data Table on Product - Market share 2023-2028 (%)
- Exhibits36: Chart on Comparison by Product
- Exhibits37: Data Table on Comparison by Product
- Exhibits38: Chart on Conventional - Market size and forecast 2023-2028 ($ million)
- Exhibits39: Data Table on Conventional - Market size and forecast 2023-2028 ($ million)
- Exhibits40: Chart on Conventional - Year-over-year growth 2023-2028 (%)
- Exhibits41: Data Table on Conventional - Year-over-year growth 2023-2028 (%)
- Exhibits42: Chart on Organic - Market size and forecast 2023-2028 ($ million)
- Exhibits43: Data Table on Organic - Market size and forecast 2023-2028 ($ million)
- Exhibits44: Chart on Organic - Year-over-year growth 2023-2028 (%)
- Exhibits45: Data Table on Organic - Year-over-year growth 2023-2028 (%)
- Exhibits46: Market opportunity by Product ($ million)
- Exhibits47: Data Table on Market opportunity by Product ($ million)
- Exhibits48: Analysis of price sensitivity, lifecycle, customer purchase basket, adoption rates, and purchase criteria
- Exhibits49: Chart on Market share By Geographical Landscape 2023-2028 (%)
- Exhibits50: Data Table on Market share By Geographical Landscape 2023-2028 (%)
- Exhibits51: Chart on Geographic comparison
- Exhibits52: Data Table on Geographic comparison
- Exhibits53: Chart on North America - Market size and forecast 2023-2028 ($ million)
- Exhibits54: Data Table on North America - Market size and forecast 2023-2028 ($ million)
- Exhibits55: Chart on North America - Year-over-year growth 2023-2028 (%)
- Exhibits56: Data Table on North America - Year-over-year growth 2023-2028 (%)
- Exhibits57: Chart on Europe - Market size and forecast 2023-2028 ($ million)
- Exhibits58: Data Table on Europe - Market size and forecast 2023-2028 ($ million)
- Exhibits59: Chart on Europe - Year-over-year growth 2023-2028 (%)
- Exhibits60: Data Table on Europe - Year-over-year growth 2023-2028 (%)
- Exhibits61: Chart on APAC - Market size and forecast 2023-2028 ($ million)
- Exhibits62: Data Table on APAC - Market size and forecast 2023-2028 ($ million)
- Exhibits63: Chart on APAC - Year-over-year growth 2023-2028 (%)
- Exhibits64: Data Table on APAC - Year-over-year growth 2023-2028 (%)
- Exhibits65: Chart on South America - Market size and forecast 2023-2028 ($ million)
- Exhibits66: Data Table on South America - Market size and forecast 2023-2028 ($ million)
- Exhibits67: Chart on South America - Year-over-year growth 2023-2028 (%)
- Exhibits68: Data Table on South America - Year-over-year growth 2023-2028 (%)
- Exhibits69: Chart on Middle East and Africa - Market size and forecast 2023-2028 ($ million)
- Exhibits70: Data Table on Middle East and Africa - Market size and forecast 2023-2028 ($ million)
- Exhibits71: Chart on Middle East and Africa - Year-over-year growth 2023-2028 (%)
- Exhibits72: Data Table on Middle East and Africa - Year-over-year growth 2023-2028 (%)
- Exhibits73: Chart on US - Market size and forecast 2023-2028 ($ million)
- Exhibits74: Data Table on US - Market size and forecast 2023-2028 ($ million)
- Exhibits75: Chart on US - Year-over-year growth 2023-2028 (%)
- Exhibits76: Data Table on US - Year-over-year growth 2023-2028 (%)
- Exhibits77: Chart on Canada - Market size and forecast 2023-2028 ($ million)
- Exhibits78: Data Table on Canada - Market size and forecast 2023-2028 ($ million)
- Exhibits79: Chart on Canada - Year-over-year growth 2023-2028 (%)
- Exhibits80: Data Table on Canada - Year-over-year growth 2023-2028 (%)
- Exhibits81: Chart on Germany - Market size and forecast 2023-2028 ($ million)
- Exhibits82: Data Table on Germany - Market size and forecast 2023-2028 ($ million)
- Exhibits83: Chart on Germany - Year-over-year growth 2023-2028 (%)
- Exhibits84: Data Table on Germany - Year-over-year growth 2023-2028 (%)
- Exhibits85: Chart on UK - Market size and forecast 2023-2028 ($ million)
- Exhibits86: Data Table on UK - Market size and forecast 2023-2028 ($ million)
- Exhibits87: Chart on UK - Year-over-year growth 2023-2028 (%)
- Exhibits88: Data Table on UK - Year-over-year growth 2023-2028 (%)
- Exhibits89: Chart on France - Market size and forecast 2023-2028 ($ million)
- Exhibits90: Data Table on France - Market size and forecast 2023-2028 ($ million)
- Exhibits91: Chart on France - Year-over-year growth 2023-2028 (%)
- Exhibits92: Data Table on France - Year-over-year growth 2023-2028 (%)
- Exhibits93: Chart on China - Market size and forecast 2023-2028 ($ million)
- Exhibits94: Data Table on China - Market size and forecast 2023-2028 ($ million)
- Exhibits95: Chart on China - Year-over-year growth 2023-2028 (%)
- Exhibits96: Data Table on China - Year-over-year growth 2023-2028 (%)
- Exhibits97: Chart on Italy - Market size and forecast 2023-2028 ($ million)
- Exhibits98: Data Table on Italy - Market size and forecast 2023-2028 ($ million)
- Exhibits99: Chart on Italy - Year-over-year growth 2023-2028 (%)
- Exhibits100: Data Table on Italy - Year-over-year growth 2023-2028 (%)
- Exhibits101: Chart on Japan - Market size and forecast 2023-2028 ($ million)
- Exhibits102: Data Table on Japan - Market size and forecast 2023-2028 ($ million)
- Exhibits103: Chart on Japan - Year-over-year growth 2023-2028 (%)
- Exhibits104: Data Table on Japan - Year-over-year growth 2023-2028 (%)
- Exhibits105: Chart on India - Market size and forecast 2023-2028 ($ million)
- Exhibits106: Data Table on India - Market size and forecast 2023-2028 ($ million)
- Exhibits107: Chart on India - Year-over-year growth 2023-2028 (%)
- Exhibits108: Data Table on India - Year-over-year growth 2023-2028 (%)
- Exhibits109: Chart on South Korea - Market size and forecast 2023-2028 ($ million)
- Exhibits110: Data Table on South Korea - Market size and forecast 2023-2028 ($ million)
- Exhibits111: Chart on South Korea - Year-over-year growth 2023-2028 (%)
- Exhibits112: Data Table on South Korea - Year-over-year growth 2023-2028 (%)
- Exhibits113: Market opportunity By Geographical Landscape ($ million)
- Exhibits114: Data Tables on Market opportunity By Geographical Landscape ($ million)
- Exhibits115: Impact of drivers and challenges in 2023 and 2028
- Exhibits116: Overview on criticality of inputs and factors of differentiation
- Exhibits117: Overview on factors of disruption
- Exhibits118: Impact of key risks on business
- Exhibits119: Companies covered
- Exhibits120: Company ranking index
- Exhibits121: Matrix on companies position and classification
- Exhibits122: Archer Daniels Midland Co. - Overview
- Exhibits123: Archer Daniels Midland Co. - Business segments
- Exhibits124: Archer Daniels Midland Co. - Key news
- Exhibits125: Archer Daniels Midland Co. - Key offerings
- Exhibits126: Archer Daniels Midland Co. - Segment focus
- Exhibits127: SWOT
- Exhibits128: ASR GROUP - Overview
- Exhibits129: ASR GROUP - Product / Service
- Exhibits130: ASR GROUP - Key offerings
- Exhibits131: SWOT
- Exhibits132: Associated British Foods Plc - Overview
- Exhibits133: Associated British Foods Plc - Business segments
- Exhibits134: Associated British Foods Plc - Key offerings
- Exhibits135: Associated British Foods Plc - Segment focus
- Exhibits136: SWOT
- Exhibits137: Blue Chip Group - Overview
- Exhibits138: Blue Chip Group - Product / Service
- Exhibits139: Blue Chip Group - Key offerings
- Exhibits140: SWOT
- Exhibits141: Delee Foods Group Co. Ltd. - Overview
- Exhibits142: Delee Foods Group Co. Ltd. - Product / Service
- Exhibits143: Delee Foods Group Co. Ltd. - Key offerings
- Exhibits144: SWOT
- Exhibits145: Holy Natural - Overview
- Exhibits146: Holy Natural - Product / Service
- Exhibits147: Holy Natural - Key offerings
- Exhibits148: SWOT
- Exhibits149: Honibe - Overview
- Exhibits150: Honibe - Product / Service
- Exhibits151: Honibe - Key offerings
- Exhibits152: SWOT
- Exhibits153: Melland Ecogreen Technology Co. Ltd. - Overview
- Exhibits154: Melland Ecogreen Technology Co. Ltd. - Product / Service
- Exhibits155: Melland Ecogreen Technology Co. Ltd. - Key offerings
- Exhibits156: SWOT
- Exhibits157: Norevo GmbH - Overview
- Exhibits158: Norevo GmbH - Product / Service
- Exhibits159: Norevo GmbH - Key offerings
- Exhibits160: SWOT
- Exhibits161: SoulBee Honey - Overview
- Exhibits162: SoulBee Honey - Product / Service
- Exhibits163: SoulBee Honey - Key offerings
- Exhibits164: SWOT
- Exhibits165: Inclusions checklist
- Exhibits166: Exclusions checklist
- Exhibits167: Currency conversion rates for US$
- Exhibits168: Research methodology
- Exhibits169: Information sources
- Exhibits170: Data validation
- Exhibits171: Validation techniques employed for market sizing
- Exhibits172: Data synthesis
- Exhibits173: 360 degree market analysis
- Exhibits174: List of abbreviations
Dry Honey Market 2024-2028
The dry honey market is forecasted to grow by USD 257.6 mn during 2023-2028, accelerating at a CAGR of 3.7% during the forecast period. The report on the dry honey market provides a holistic analysis, market size and forecast, trends, growth drivers, and challenges, as well as vendor analysis covering around 25 vendors.
The report offers an up-to-date analysis regarding the current market scenario, the latest trends and drivers, and the overall market environment. The market is driven by health benefits of consuming dry honey, healthy ingredients in food products, and growth in organized retailing globally.
| Market Scope | |
|---|---|
| Base Year | 2024 |
| End Year | 2028 |
| Series Year | 2024-2028 |
| Growth Momentum | Accelerate |
| YOY 2024 | 3.5% |
| CAGR | 3.7% |
| Incremental Value | $257.6 mn |
Technavio's dry honey market is segmented as below:
By Product
- Conventional
- Organic
By Geographical Landscape
- North America
- Europe
- APAC
- South America
- Middle East and Africa
This study identifies the restoration of natural bee habitats as one of the prime reasons driving the dry honey market growth during the next few years. Also, growing preference for online shopping and innovative applications of dry honey in food and beverage industry will lead to sizable demand in the market.
The report on the dry honey market covers the following areas:
- Dry Honey Market sizing
- Dry Honey Market forecast
- Dry Honey Market industry analysis
The robust vendor analysis is designed to help clients improve their market position, and in line with this, this report provides a detailed analysis of several leading dry honey market vendors that include AmTech Ingredients, Archer Daniels Midland Co., ASR GROUP, Associated British Foods Plc, Blue Chip Group, Delee Foods Group Co. Ltd., Fresh Essentials organics, Holy Natural, Honibe, Melland Ecogreen Technology Co. Ltd., Norevo GmbH, SoulBee Honey, and Woodland Foods Ltd.. Also, the dry honey market analysis report includes information on upcoming trends and challenges that will influence market growth. This is to help companies strategize and leverage all forthcoming growth opportunities.
The study was conducted using an objective combination of primary and secondary information including inputs from key participants in the industry. The report contains a comprehensive market and vendor landscape in addition to an analysis of the key vendors.
The publisher presents a detailed picture of the market by the way of study, synthesis, and summation of data from multiple sources by an analysis of key parameters such as profit, pricing, competition, and promotions. It presents various market facets by identifying the key industry influencers. The data presented is comprehensive, reliable, and a result of extensive primary and secondary research. The market research reports provide a complete competitive landscape and an in-depth vendor selection methodology and analysis using qualitative and quantitative research to forecast accurate market growth.
Table of Contents
1 Executive Summary
- 1.1 Market overview
- Executive Summary - Chart on Market Overview
- Executive Summary - Data Table on Market Overview
- Executive Summary - Chart on Global Market Characteristics
- Executive Summary - Chart on Market By Geographical Landscape
- Executive Summary - Chart on Market Segmentation by Product
- Executive Summary - Chart on Incremental Growth
- Executive Summary - Data Table on Incremental Growth
- Executive Summary - Chart on Company Market Positioning
2 Technavio Analysis
- 2.1 Analysis of price sensitivity, lifecycle, customer purchase basket, adoption rates, and purchase criteria
- Analysis of price sensitivity, lifecycle, customer purchase basket, adoption rates, and purchase criteria
- 2.2 Criticality of inputs and Factors of differentiation
- Overview on criticality of inputs and factors of differentiation
- 2.3 Factors of disruption
- Overview on factors of disruption
- 2.4 Impact of drivers and challenges
- Impact of drivers and challenges in 2023 and 2028
3 Market Landscape
- 3.1 Market ecosystem
- Parent Market
- Data Table on - Parent Market
- 3.2 Market characteristics
- Market characteristics analysis
- 3.3 Value chain analysis
- Value Chain Analysis
4 Market Sizing
- 4.1 Market definition
- Offerings of companies included in the market definition
- 4.2 Market segment analysis
- Market segments
- 4.3 Market size 2023
- 4.4 Market outlook: Forecast for 2023-2028
- Chart on Global - Market size and forecast 2023-2028 ($ million)
- Data Table on Global - Market size and forecast 2023-2028 ($ million)
- Chart on Global Market: Year-over-year growth 2023-2028 (%)
- Data Table on Global Market: Year-over-year growth 2023-2028 (%)
5 Historic Market Size
- 5.1 Global Dry Honey Market 2018 - 2022
- Historic Market Size - Data Table on Global Dry Honey Market 2018 - 2022 ($ million)
- 5.2 Product segment analysis 2018 - 2022
- Historic Market Size - Product Segment 2018 - 2022 ($ million)
- 5.3 Geography segment analysis 2018 - 2022
- Historic Market Size - Geography Segment 2018 - 2022 ($ million)
- 5.4 Country segment analysis 2018 - 2022
- Historic Market Size - Country Segment 2018 - 2022 ($ million)
6 Qualitative Analysis
- 6.1 Impact of AI on Global Dry Honey Market
7 Five Forces Analysis
- 7.1 Five forces summary
- Five forces analysis - Comparison between 2023 and 2028
- 7.2 Bargaining power of buyers
- Bargaining power of buyers - Impact of key factors 2023 and 2028
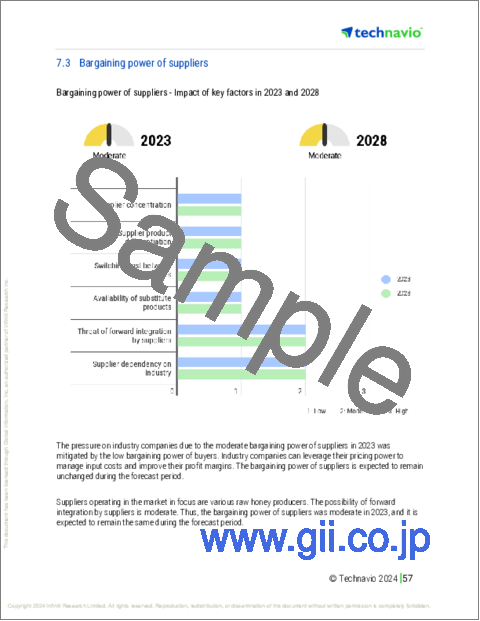
- 7.3 Bargaining power of suppliers
- Bargaining power of suppliers - Impact of key factors in 2023 and 2028
- 7.4 Threat of new entrants
- Threat of new entrants - Impact of key factors in 2023 and 2028
- 7.5 Threat of substitutes
- Threat of substitutes - Impact of key factors in 2023 and 2028
- 7.6 Threat of rivalry
- Threat of rivalry - Impact of key factors in 2023 and 2028
- 7.7 Market condition
- Chart on Market condition - Five forces 2023 and 2028
8 Market Segmentation by Product
- 8.1 Market segments
- Chart on Product - Market share 2023-2028 (%)
- Data Table on Product - Market share 2023-2028 (%)
- 8.2 Comparison by Product
- Chart on Comparison by Product
- Data Table on Comparison by Product
- 8.3 Conventional - Market size and forecast 2023-2028
- Chart on Conventional - Market size and forecast 2023-2028 ($ million)
- Data Table on Conventional - Market size and forecast 2023-2028 ($ million)
- Chart on Conventional - Year-over-year growth 2023-2028 (%)
- Data Table on Conventional - Year-over-year growth 2023-2028 (%)
- 8.4 Organic - Market size and forecast 2023-2028
- Chart on Organic - Market size and forecast 2023-2028 ($ million)
- Data Table on Organic - Market size and forecast 2023-2028 ($ million)
- Chart on Organic - Year-over-year growth 2023-2028 (%)
- Data Table on Organic - Year-over-year growth 2023-2028 (%)
- 8.5 Market opportunity by Product
- Market opportunity by Product ($ million)
- Data Table on Market opportunity by Product ($ million)
9 Customer Landscape
- 9.1 Customer landscape overview
- Analysis of price sensitivity, lifecycle, customer purchase basket, adoption rates, and purchase criteria
10 Geographic Landscape
- 10.1 Geographic segmentation
- Chart on Market share By Geographical Landscape 2023-2028 (%)
- Data Table on Market share By Geographical Landscape 2023-2028 (%)
- 10.2 Geographic comparison
- Chart on Geographic comparison
- Data Table on Geographic comparison
- 10.3 North America - Market size and forecast 2023-2028
- Chart on North America - Market size and forecast 2023-2028 ($ million)
- Data Table on North America - Market size and forecast 2023-2028 ($ million)
- Chart on North America - Year-over-year growth 2023-2028 (%)
- Data Table on North America - Year-over-year growth 2023-2028 (%)
- 10.4 Europe - Market size and forecast 2023-2028
- Chart on Europe - Market size and forecast 2023-2028 ($ million)
- Data Table on Europe - Market size and forecast 2023-2028 ($ million)
- Chart on Europe - Year-over-year growth 2023-2028 (%)
- Data Table on Europe - Year-over-year growth 2023-2028 (%)
- 10.5 APAC - Market size and forecast 2023-2028
- Chart on APAC - Market size and forecast 2023-2028 ($ million)
- Data Table on APAC - Market size and forecast 2023-2028 ($ million)
- Chart on APAC - Year-over-year growth 2023-2028 (%)
- Data Table on APAC - Year-over-year growth 2023-2028 (%)
- 10.6 South America - Market size and forecast 2023-2028
- Chart on South America - Market size and forecast 2023-2028 ($ million)
- Data Table on South America - Market size and forecast 2023-2028 ($ million)
- Chart on South America - Year-over-year growth 2023-2028 (%)
- Data Table on South America - Year-over-year growth 2023-2028 (%)
- 10.7 Middle East and Africa - Market size and forecast 2023-2028
- Chart on Middle East and Africa - Market size and forecast 2023-2028 ($ million)
- Data Table on Middle East and Africa - Market size and forecast 2023-2028 ($ million)
- Chart on Middle East and Africa - Year-over-year growth 2023-2028 (%)
- Data Table on Middle East and Africa - Year-over-year growth 2023-2028 (%)
- 10.8 US - Market size and forecast 2023-2028
- Chart on US - Market size and forecast 2023-2028 ($ million)
- Data Table on US - Market size and forecast 2023-2028 ($ million)
- Chart on US - Year-over-year growth 2023-2028 (%)
- Data Table on US - Year-over-year growth 2023-2028 (%)
- 10.9 Canada - Market size and forecast 2023-2028
- Chart on Canada - Market size and forecast 2023-2028 ($ million)
- Data Table on Canada - Market size and forecast 2023-2028 ($ million)
- Chart on Canada - Year-over-year growth 2023-2028 (%)
- Data Table on Canada - Year-over-year growth 2023-2028 (%)
- 10.10 Germany - Market size and forecast 2023-2028
- Chart on Germany - Market size and forecast 2023-2028 ($ million)
- Data Table on Germany - Market size and forecast 2023-2028 ($ million)
- Chart on Germany - Year-over-year growth 2023-2028 (%)
- Data Table on Germany - Year-over-year growth 2023-2028 (%)
- 10.11 UK - Market size and forecast 2023-2028
- Chart on UK - Market size and forecast 2023-2028 ($ million)
- Data Table on UK - Market size and forecast 2023-2028 ($ million)
- Chart on UK - Year-over-year growth 2023-2028 (%)
- Data Table on UK - Year-over-year growth 2023-2028 (%)
- 10.12 France - Market size and forecast 2023-2028
- Chart on France - Market size and forecast 2023-2028 ($ million)
- Data Table on France - Market size and forecast 2023-2028 ($ million)
- Chart on France - Year-over-year growth 2023-2028 (%)
- Data Table on France - Year-over-year growth 2023-2028 (%)
- 10.13 China - Market size and forecast 2023-2028
- Chart on China - Market size and forecast 2023-2028 ($ million)
- Data Table on China - Market size and forecast 2023-2028 ($ million)
- Chart on China - Year-over-year growth 2023-2028 (%)
- Data Table on China - Year-over-year growth 2023-2028 (%)
- 10.14 Italy - Market size and forecast 2023-2028
- Chart on Italy - Market size and forecast 2023-2028 ($ million)
- Data Table on Italy - Market size and forecast 2023-2028 ($ million)
- Chart on Italy - Year-over-year growth 2023-2028 (%)
- Data Table on Italy - Year-over-year growth 2023-2028 (%)
- 10.15 Japan - Market size and forecast 2023-2028
- Chart on Japan - Market size and forecast 2023-2028 ($ million)
- Data Table on Japan - Market size and forecast 2023-2028 ($ million)
- Chart on Japan - Year-over-year growth 2023-2028 (%)
- Data Table on Japan - Year-over-year growth 2023-2028 (%)
- 10.16 India - Market size and forecast 2023-2028
- Chart on India - Market size and forecast 2023-2028 ($ million)
- Data Table on India - Market size and forecast 2023-2028 ($ million)
- Chart on India - Year-over-year growth 2023-2028 (%)
- Data Table on India - Year-over-year growth 2023-2028 (%)
- 10.17 South Korea - Market size and forecast 2023-2028
- Chart on South Korea - Market size and forecast 2023-2028 ($ million)
- Data Table on South Korea - Market size and forecast 2023-2028 ($ million)
- Chart on South Korea - Year-over-year growth 2023-2028 (%)
- Data Table on South Korea - Year-over-year growth 2023-2028 (%)
- 10.18 Market opportunity By Geographical Landscape
- Market opportunity By Geographical Landscape ($ million)
- Data Tables on Market opportunity By Geographical Landscape ($ million)
11 Drivers, Challenges, and Opportunity/Restraints
- 11.1 Market drivers
- 11.2 Market challenges
- 11.3 Impact of drivers and challenges
- Impact of drivers and challenges in 2023 and 2028
- 11.4 Market opportunities/restraints
12 Competitive Landscape
- 12.1 Overview
- 12.2 Competitive Landscape
- Overview on criticality of inputs and factors of differentiation
- 12.3 Landscape disruption
- Overview on factors of disruption
- 12.4 Industry risks
- Impact of key risks on business
13 Competitive Analysis
- 13.1 Companies profiled
- Companies covered
- 13.2 Company ranking index
- Company ranking index
- 13.3 Market positioning of companies
- Matrix on companies position and classification
- 13.4 Archer Daniels Midland Co.
- Archer Daniels Midland Co. - Overview
- Archer Daniels Midland Co. - Business segments
- Archer Daniels Midland Co. - Key news
- Archer Daniels Midland Co. - Key offerings
- Archer Daniels Midland Co. - Segment focus
- SWOT
- 13.5 ASR GROUP
- ASR GROUP - Overview
- ASR GROUP - Product / Service
- ASR GROUP - Key offerings
- SWOT
- 13.6 Associated British Foods Plc
- Associated British Foods Plc - Overview
- Associated British Foods Plc - Business segments
- Associated British Foods Plc - Key offerings
- Associated British Foods Plc - Segment focus
- SWOT
- 13.7 Blue Chip Group
- Blue Chip Group - Overview
- Blue Chip Group - Product / Service
- Blue Chip Group - Key offerings
- SWOT
- 13.8 Delee Foods Group Co. Ltd.
- Delee Foods Group Co. Ltd. - Overview
- Delee Foods Group Co. Ltd. - Product / Service
- Delee Foods Group Co. Ltd. - Key offerings
- SWOT
- 13.9 Holy Natural
- Holy Natural - Overview
- Holy Natural - Product / Service
- Holy Natural - Key offerings
- SWOT
- 13.10 Honibe
- Honibe - Overview
- Honibe - Product / Service
- Honibe - Key offerings
- SWOT
- 13.11 Melland Ecogreen Technology Co. Ltd.
- Melland Ecogreen Technology Co. Ltd. - Overview
- Melland Ecogreen Technology Co. Ltd. - Product / Service
- Melland Ecogreen Technology Co. Ltd. - Key offerings
- SWOT
- 13.12 Norevo GmbH
- Norevo GmbH - Overview
- Norevo GmbH - Product / Service
- Norevo GmbH - Key offerings
- SWOT
- 13.13 SoulBee Honey
- SoulBee Honey - Overview
- SoulBee Honey - Product / Service
- SoulBee Honey - Key offerings
- SWOT
14 Appendix
- 14.1 Scope of the report
- 14.2 Inclusions and exclusions checklist
- Inclusions checklist
- Exclusions checklist
- 14.3 Currency conversion rates for US$
- Currency conversion rates for US$
- 14.4 Research methodology
- Research methodology
- 14.5 Data procurement
- Information sources
- 14.6 Data validation
- Data validation
- 14.7 Validation techniques employed for market sizing
- Validation techniques employed for market sizing
- 14.8 Data synthesis
- Data synthesis
- 14.9 360 degree market analysis
- 360 degree market analysis
- 14.10 List of abbreviations
- List of abbreviations

