|
|
市場調査レポート
商品コード
1601875
油汚染土壌処理の世界市場 (2024~2028年)Global Oil Pollution Soil Treatment Market 2024-2028 |
||||||

|
|||||||
カスタマイズ可能
|
|||||||


| 油汚染土壌処理の世界市場 (2024~2028年) |
|
出版日: 2024年11月19日
発行: TechNavio
ページ情報: 英文 218 Pages
納期: 即納可能
|

全表示
- 概要
- 図表
- 目次
油汚染土壌処理市場 (2024~2028年)
油汚染土壌処理市場は2023~2028年に8億8,200万米ドル分拡大し、予測期間中に5.4%のCAGRで成長すると予測されます。当レポートでは、油汚染土壌処理市場の全体的な分析、市場規模・予測、動向、成長促進要因、課題、約25社のベンダーを網羅したベンダー分析などを掲載しています。
現在の市場シナリオ、最新動向と促進要因、市場環境全体に関する最新分析を提供しています。油流出や産業汚染の増加、石油・ガスパイプラインの拡大、土壌処理に関連する環境規制などが市場を牽引しています。
| 市場範囲 | |
|---|---|
| 基準年 | 2024年 |
| 終了年 | 2028年 |
| 予測期間 | 2024~2028年 |
| 成長モメンタム | 加速 |
| 前年比 (2024年) | 5.3% |
| CAGR | 5.4% |
| 増分額 | 8億8,200万米ドル |
当レポートでは、土壌状態のモニタリングにおけるデータ分析、リモートセンシング、地理情報システムの統合が、今後数年間の油汚染土壌処理市場の成長を促進する主要な理由の1つであると特定しています。また、環境に優しく持続可能な土壌治療法へのシフトや、土壌治療におけるナノテクノロジーの使用は、市場の大きな需要につながります。
目次
第1章 エグゼクティブサマリー
- 市場概要
第2章 Technavioによる分析
- 価格感応度・ライフサイクル・顧客購入バスケット・採用率・購入基準の分析
- インプットの重要性と差別化の要因
- 混乱の要因
- 促進要因と課題の影響
第3章 市場情勢
- 市場エコシステム
- 市場の特徴
- バリューチェーン分析
第4章 市場規模
- 市場の定義
- 市場セグメント分析
- 市場規模 (2023年)
- 市場の見通し (2023~2028年)
第5章 市場規模実績
- 油汚染土壌処理の世界市場 (2018~2022年)
- 手法別分析 (2018~2022年)
- エンドユーザー別分析 (2018~2022年)
- 地域別分析 (2018~2022年)
- 国別分析 (2018~2022年)
第6章 定性分析
- 世界の油汚染土壌処理市場に対するAIの影響
第7章 ファイブフォース分析
- ファイブフォースの要約
- 買い手の交渉力
- 供給企業の交渉力
- 新規参入業者の脅威
- 代替品の脅威
- 競争の脅威
- 市況
第8章 市場セグメンテーション:方法別
- 市場セグメント
- 比較:方法別
- バイオレメディエーション:市場規模と予測 (2023~2028年)
- 治療:市場規模と予測 (2023~2028年)
- 化学治療:市場規模と予測 (2023~2028年)
- 身体治療:市場規模と予測 (2023~2028年)
- 電気運動治療:市場規模と予測 (2023~2028年)
- 市場機会:方法別
第9章 市場セグメンテーション:エンドユーザー別
- 市場セグメント
- 比較:エンドユーザー別
- 石油・ガス:市場規模と予測 (2023~2028年)
- 工業製造業:市場規模と予測 (2023~2028年)
- 農業:市場規模と予測 (2023~2028年)
- 廃棄物管理:市場規模と予測 (2023~2028年)
- 建設・インフラ:市場規模と予測 (2023~2028年)
- 市場機会:エンドユーザー別
第10章 顧客情勢
- 顧客情勢の概要
第11章 地域別情勢
- 地域別セグメンテーション
- 地域別比較
- 北米:市場規模と予測 (2023~2028年)
- 欧州:市場規模と予測 (2023~2028年)
- アジア太平洋:市場規模と予測 (2023~2028年)
- 南米:市場規模と予測 (2023~2028年)
- 中東・アフリカ:市場規模と予測 (2023~2028年)
- 米国:市場規模と予測 (2023~2028年)
- 英国:市場規模と予測 (2023~2028年)
- 中国:市場規模と予測 (2023~2028年)
- インド:市場規模と予測 (2023~2028年)
- ドイツ:市場規模と予測 (2023~2028年)
- ブラジル:市場規模と予測 (2023~2028年)
- 日本:市場規模と予測 (2023~2028年)
- フランス:市場規模と予測 (2023~2028年)
- カナダ:市場規模と予測 (2023~2028年)
- イタリア:市場規模と予測 (2023~2028年)
- 市場機会:地域別
第12章 促進要因・課題・機会・抑制要因
- 市場促進要因
- 市場の課題
- 促進要因と課題の影響
- 市場の機会・抑制要因
第13章 競合情勢
- 概要
- 競合情勢
- 混乱の状況
- 業界のリスク
第14章 競合分析
- 企業プロファイル
- 企業ランキング指数
- 企業の市場ポジショニング
- AECOM
- Clean Earth Inc.
- Clean Harbors Inc.
- ENTACT LLC
- ERM Group Inc.
- Keller Group Plc
- Kuwait Petroleum Corp.
- NRC International Holdings
- Ortec Group
- REGENESIS
- Soil Solutions Inc.
- SUEZ SA
- Terrapure Environmental
- Veolia Environnement SA
- WSP Global Inc.
第15章 付録
Exhibits:
- Exhibits1: Executive Summary - Chart on Market Overview
- Exhibits2: Executive Summary - Data Table on Market Overview
- Exhibits3: Executive Summary - Chart on Global Market Characteristics
- Exhibits4: Executive Summary - Chart on Market By Geographical Landscape
- Exhibits5: Executive Summary - Chart on Market Segmentation by Method
- Exhibits6: Executive Summary - Chart on Market Segmentation by End-user
- Exhibits7: Executive Summary - Chart on Incremental Growth
- Exhibits8: Executive Summary - Data Table on Incremental Growth
- Exhibits9: Executive Summary - Chart on Company Market Positioning
- Exhibits10: Analysis of price sensitivity, lifecycle, customer purchase basket, adoption rates, and purchase criteria
- Exhibits11: Overview on criticality of inputs and factors of differentiation
- Exhibits12: Overview on factors of disruption
- Exhibits13: Impact of drivers and challenges in 2023 and 2028
- Exhibits14: Parent Market
- Exhibits15: Data Table on - Parent Market
- Exhibits16: Market characteristics analysis
- Exhibits17: Value Chain Analysis
- Exhibits18: Offerings of companies included in the market definition
- Exhibits19: Market segments
- Exhibits20: Chart on Global - Market size and forecast 2023-2028 ($ million)
- Exhibits21: Data Table on Global - Market size and forecast 2023-2028 ($ million)
- Exhibits22: Chart on Global Market: Year-over-year growth 2023-2028 (%)
- Exhibits23: Data Table on Global Market: Year-over-year growth 2023-2028 (%)
- Exhibits24: Historic Market Size - Data Table on Global Oil Pollution Soil Treatment Market 2018 - 2022 ($ million)
- Exhibits25: Historic Market Size - Method Segment 2018 - 2022 ($ million)
- Exhibits26: Historic Market Size - End-user Segment 2018 - 2022 ($ million)
- Exhibits27: Historic Market Size - Geography Segment 2018 - 2022 ($ million)
- Exhibits28: Historic Market Size - Country Segment 2018 - 2022 ($ million)
- Exhibits29: Five forces analysis - Comparison between 2023 and 2028
- Exhibits30: Bargaining power of buyers - Impact of key factors 2023 and 2028
- Exhibits31: Bargaining power of suppliers - Impact of key factors in 2023 and 2028
- Exhibits32: Threat of new entrants - Impact of key factors in 2023 and 2028
- Exhibits33: Threat of substitutes - Impact of key factors in 2023 and 2028
- Exhibits34: Threat of rivalry - Impact of key factors in 2023 and 2028
- Exhibits35: Chart on Market condition - Five forces 2023 and 2028
- Exhibits36: Chart on Method - Market share 2023-2028 (%)
- Exhibits37: Data Table on Method - Market share 2023-2028 (%)
- Exhibits38: Chart on Comparison by Method
- Exhibits39: Data Table on Comparison by Method
- Exhibits40: Chart on Bioremediation - Market size and forecast 2023-2028 ($ million)
- Exhibits41: Data Table on Bioremediation - Market size and forecast 2023-2028 ($ million)
- Exhibits42: Chart on Bioremediation - Year-over-year growth 2023-2028 (%)
- Exhibits43: Data Table on Bioremediation - Year-over-year growth 2023-2028 (%)
- Exhibits44: Chart on Thermal treatment - Market size and forecast 2023-2028 ($ million)
- Exhibits45: Data Table on Thermal treatment - Market size and forecast 2023-2028 ($ million)
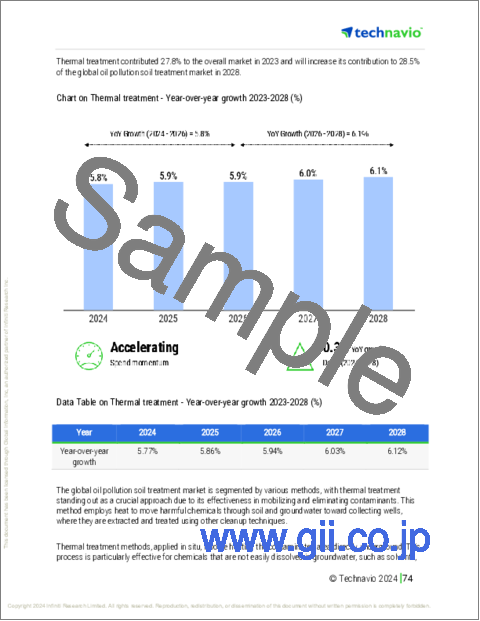
- Exhibits46: Chart on Thermal treatment - Year-over-year growth 2023-2028 (%)
- Exhibits47: Data Table on Thermal treatment - Year-over-year growth 2023-2028 (%)
- Exhibits48: Chart on Chemical treatment - Market size and forecast 2023-2028 ($ million)
- Exhibits49: Data Table on Chemical treatment - Market size and forecast 2023-2028 ($ million)
- Exhibits50: Chart on Chemical treatment - Year-over-year growth 2023-2028 (%)
- Exhibits51: Data Table on Chemical treatment - Year-over-year growth 2023-2028 (%)
- Exhibits52: Chart on Physical treatment - Market size and forecast 2023-2028 ($ million)
- Exhibits53: Data Table on Physical treatment - Market size and forecast 2023-2028 ($ million)
- Exhibits54: Chart on Physical treatment - Year-over-year growth 2023-2028 (%)
- Exhibits55: Data Table on Physical treatment - Year-over-year growth 2023-2028 (%)
- Exhibits56: Chart on Electrokinetic treatment - Market size and forecast 2023-2028 ($ million)
- Exhibits57: Data Table on Electrokinetic treatment - Market size and forecast 2023-2028 ($ million)
- Exhibits58: Chart on Electrokinetic treatment - Year-over-year growth 2023-2028 (%)
- Exhibits59: Data Table on Electrokinetic treatment - Year-over-year growth 2023-2028 (%)
- Exhibits60: Market opportunity by Method ($ million)
- Exhibits61: Data Table on Market opportunity by Method ($ million)
- Exhibits62: Chart on End-user - Market share 2023-2028 (%)
- Exhibits63: Data Table on End-user - Market share 2023-2028 (%)
- Exhibits64: Chart on Comparison by End-user
- Exhibits65: Data Table on Comparison by End-user
- Exhibits66: Chart on Oil and gas - Market size and forecast 2023-2028 ($ million)
- Exhibits67: Data Table on Oil and gas - Market size and forecast 2023-2028 ($ million)
- Exhibits68: Chart on Oil and gas - Year-over-year growth 2023-2028 (%)
- Exhibits69: Data Table on Oil and gas - Year-over-year growth 2023-2028 (%)
- Exhibits70: Chart on Industrial manufacturing - Market size and forecast 2023-2028 ($ million)
- Exhibits71: Data Table on Industrial manufacturing - Market size and forecast 2023-2028 ($ million)
- Exhibits72: Chart on Industrial manufacturing - Year-over-year growth 2023-2028 (%)
- Exhibits73: Data Table on Industrial manufacturing - Year-over-year growth 2023-2028 (%)
- Exhibits74: Chart on Agriculture - Market size and forecast 2023-2028 ($ million)
- Exhibits75: Data Table on Agriculture - Market size and forecast 2023-2028 ($ million)
- Exhibits76: Chart on Agriculture - Year-over-year growth 2023-2028 (%)
- Exhibits77: Data Table on Agriculture - Year-over-year growth 2023-2028 (%)
- Exhibits78: Chart on Waste management - Market size and forecast 2023-2028 ($ million)
- Exhibits79: Data Table on Waste management - Market size and forecast 2023-2028 ($ million)
- Exhibits80: Chart on Waste management - Year-over-year growth 2023-2028 (%)
- Exhibits81: Data Table on Waste management - Year-over-year growth 2023-2028 (%)
- Exhibits82: Chart on Construction and infrastructure - Market size and forecast 2023-2028 ($ million)
- Exhibits83: Data Table on Construction and infrastructure - Market size and forecast 2023-2028 ($ million)
- Exhibits84: Chart on Construction and infrastructure - Year-over-year growth 2023-2028 (%)
- Exhibits85: Data Table on Construction and infrastructure - Year-over-year growth 2023-2028 (%)
- Exhibits86: Market opportunity by End-user ($ million)
- Exhibits87: Data Table on Market opportunity by End-user ($ million)
- Exhibits88: Analysis of price sensitivity, lifecycle, customer purchase basket, adoption rates, and purchase criteria
- Exhibits89: Chart on Market share By Geographical Landscape 2023-2028 (%)
- Exhibits90: Data Table on Market share By Geographical Landscape 2023-2028 (%)
- Exhibits91: Chart on Geographic comparison
- Exhibits92: Data Table on Geographic comparison
- Exhibits93: Chart on North America - Market size and forecast 2023-2028 ($ million)
- Exhibits94: Data Table on North America - Market size and forecast 2023-2028 ($ million)
- Exhibits95: Chart on North America - Year-over-year growth 2023-2028 (%)
- Exhibits96: Data Table on North America - Year-over-year growth 2023-2028 (%)
- Exhibits97: Chart on Europe - Market size and forecast 2023-2028 ($ million)
- Exhibits98: Data Table on Europe - Market size and forecast 2023-2028 ($ million)
- Exhibits99: Chart on Europe - Year-over-year growth 2023-2028 (%)
- Exhibits100: Data Table on Europe - Year-over-year growth 2023-2028 (%)
- Exhibits101: Chart on APAC - Market size and forecast 2023-2028 ($ million)
- Exhibits102: Data Table on APAC - Market size and forecast 2023-2028 ($ million)
- Exhibits103: Chart on APAC - Year-over-year growth 2023-2028 (%)
- Exhibits104: Data Table on APAC - Year-over-year growth 2023-2028 (%)
- Exhibits105: Chart on South America - Market size and forecast 2023-2028 ($ million)
- Exhibits106: Data Table on South America - Market size and forecast 2023-2028 ($ million)
- Exhibits107: Chart on South America - Year-over-year growth 2023-2028 (%)
- Exhibits108: Data Table on South America - Year-over-year growth 2023-2028 (%)
- Exhibits109: Chart on Middle East and Africa - Market size and forecast 2023-2028 ($ million)
- Exhibits110: Data Table on Middle East and Africa - Market size and forecast 2023-2028 ($ million)
- Exhibits111: Chart on Middle East and Africa - Year-over-year growth 2023-2028 (%)
- Exhibits112: Data Table on Middle East and Africa - Year-over-year growth 2023-2028 (%)
- Exhibits113: Chart on US - Market size and forecast 2023-2028 ($ million)
- Exhibits114: Data Table on US - Market size and forecast 2023-2028 ($ million)
- Exhibits115: Chart on US - Year-over-year growth 2023-2028 (%)
- Exhibits116: Data Table on US - Year-over-year growth 2023-2028 (%)
- Exhibits117: Chart on UK - Market size and forecast 2023-2028 ($ million)
- Exhibits118: Data Table on UK - Market size and forecast 2023-2028 ($ million)
- Exhibits119: Chart on UK - Year-over-year growth 2023-2028 (%)
- Exhibits120: Data Table on UK - Year-over-year growth 2023-2028 (%)
- Exhibits121: Chart on China - Market size and forecast 2023-2028 ($ million)
- Exhibits122: Data Table on China - Market size and forecast 2023-2028 ($ million)
- Exhibits123: Chart on China - Year-over-year growth 2023-2028 (%)
- Exhibits124: Data Table on China - Year-over-year growth 2023-2028 (%)
- Exhibits125: Chart on India - Market size and forecast 2023-2028 ($ million)
- Exhibits126: Data Table on India - Market size and forecast 2023-2028 ($ million)
- Exhibits127: Chart on India - Year-over-year growth 2023-2028 (%)
- Exhibits128: Data Table on India - Year-over-year growth 2023-2028 (%)
- Exhibits129: Chart on Germany - Market size and forecast 2023-2028 ($ million)
- Exhibits130: Data Table on Germany - Market size and forecast 2023-2028 ($ million)
- Exhibits131: Chart on Germany - Year-over-year growth 2023-2028 (%)
- Exhibits132: Data Table on Germany - Year-over-year growth 2023-2028 (%)
- Exhibits133: Chart on Brazil - Market size and forecast 2023-2028 ($ million)
- Exhibits134: Data Table on Brazil - Market size and forecast 2023-2028 ($ million)
- Exhibits135: Chart on Brazil - Year-over-year growth 2023-2028 (%)
- Exhibits136: Data Table on Brazil - Year-over-year growth 2023-2028 (%)
- Exhibits137: Chart on Japan - Market size and forecast 2023-2028 ($ million)
- Exhibits138: Data Table on Japan - Market size and forecast 2023-2028 ($ million)
- Exhibits139: Chart on Japan - Year-over-year growth 2023-2028 (%)
- Exhibits140: Data Table on Japan - Year-over-year growth 2023-2028 (%)
- Exhibits141: Chart on France - Market size and forecast 2023-2028 ($ million)
- Exhibits142: Data Table on France - Market size and forecast 2023-2028 ($ million)
- Exhibits143: Chart on France - Year-over-year growth 2023-2028 (%)
- Exhibits144: Data Table on France - Year-over-year growth 2023-2028 (%)
- Exhibits145: Chart on Canada - Market size and forecast 2023-2028 ($ million)
- Exhibits146: Data Table on Canada - Market size and forecast 2023-2028 ($ million)
- Exhibits147: Chart on Canada - Year-over-year growth 2023-2028 (%)
- Exhibits148: Data Table on Canada - Year-over-year growth 2023-2028 (%)
- Exhibits149: Chart on Italy - Market size and forecast 2023-2028 ($ million)
- Exhibits150: Data Table on Italy - Market size and forecast 2023-2028 ($ million)
- Exhibits151: Chart on Italy - Year-over-year growth 2023-2028 (%)
- Exhibits152: Data Table on Italy - Year-over-year growth 2023-2028 (%)
- Exhibits153: Market opportunity By Geographical Landscape ($ million)
- Exhibits154: Data Tables on Market opportunity By Geographical Landscape ($ million)
- Exhibits155: Impact of drivers and challenges in 2023 and 2028
- Exhibits156: Overview on criticality of inputs and factors of differentiation
- Exhibits157: Overview on factors of disruption
- Exhibits158: Impact of key risks on business
- Exhibits159: Companies covered
- Exhibits160: Company ranking index
- Exhibits161: Matrix on companies position and classification
- Exhibits162: AECOM - Overview
- Exhibits163: AECOM - Business segments
- Exhibits164: AECOM - Key news
- Exhibits165: AECOM - Key offerings
- Exhibits166: AECOM - Segment focus
- Exhibits167: SWOT
- Exhibits168: Clean Earth Inc. - Overview
- Exhibits169: Clean Earth Inc. - Product / Service
- Exhibits170: Clean Earth Inc. - Key offerings
- Exhibits171: SWOT
- Exhibits172: Clean Harbors Inc. - Overview
- Exhibits173: Clean Harbors Inc. - Business segments
- Exhibits174: Clean Harbors Inc. - Key news
- Exhibits175: Clean Harbors Inc. - Key offerings
- Exhibits176: Clean Harbors Inc. - Segment focus
- Exhibits177: SWOT
- Exhibits178: ENTACT LLC - Overview
- Exhibits179: ENTACT LLC - Product / Service
- Exhibits180: ENTACT LLC - Key offerings
- Exhibits181: SWOT
- Exhibits182: ERM Group Inc. - Overview
- Exhibits183: ERM Group Inc. - Product / Service
- Exhibits184: ERM Group Inc. - Key offerings
- Exhibits185: SWOT
- Exhibits186: Keller Group Plc - Overview
- Exhibits187: Keller Group Plc - Business segments
- Exhibits188: Keller Group Plc - Key offerings
- Exhibits189: Keller Group Plc - Segment focus
- Exhibits190: SWOT
- Exhibits191: Kuwait Petroleum Corp. - Overview
- Exhibits192: Kuwait Petroleum Corp. - Product / Service
- Exhibits193: Kuwait Petroleum Corp. - Key offerings
- Exhibits194: SWOT
- Exhibits195: NRC International Holdings - Overview
- Exhibits196: NRC International Holdings - Product / Service
- Exhibits197: NRC International Holdings - Key offerings
- Exhibits198: SWOT
- Exhibits199: Ortec Group - Overview
- Exhibits200: Ortec Group - Product / Service
- Exhibits201: Ortec Group - Key offerings
- Exhibits202: SWOT
- Exhibits203: REGENESIS - Overview
- Exhibits204: REGENESIS - Product / Service
- Exhibits205: REGENESIS - Key offerings
- Exhibits206: SWOT
- Exhibits207: Soil Solutions Inc. - Overview
- Exhibits208: Soil Solutions Inc. - Product / Service
- Exhibits209: Soil Solutions Inc. - Key offerings
- Exhibits210: SWOT
- Exhibits211: SUEZ SA - Overview
- Exhibits212: SUEZ SA - Product / Service
- Exhibits213: SUEZ SA - Key news
- Exhibits214: SUEZ SA - Key offerings
- Exhibits215: SWOT
- Exhibits216: Terrapure Environmental - Overview
- Exhibits217: Terrapure Environmental - Product / Service
- Exhibits218: Terrapure Environmental - Key offerings
- Exhibits219: SWOT
- Exhibits220: Veolia Environnement SA - Overview
Exhibits22
Oil Pollution Soil Treatment Market 2024-2028
The oil pollution soil treatment market is forecasted to grow by USD 882 mn during 2023-2028, accelerating at a CAGR of 5.4% during the forecast period. The report on the oil pollution soil treatment market provides a holistic analysis, market size and forecast, trends, growth drivers, and challenges, as well as vendor analysis covering around 25 vendors.
The report offers an up-to-date analysis regarding the current market scenario, the latest trends and drivers, and the overall market environment. The market is driven by rising incidence of oil spills and industrial contamination, expansion of oil and gas pipelines, and environmental regulations associated with soil treatment.
| Market Scope | |
|---|---|
| Base Year | 2024 |
| End Year | 2028 |
| Series Year | 2024-2028 |
| Growth Momentum | Accelerate |
| YOY 2024 | 5.3% |
| CAGR | 5.4% |
| Incremental Value | $882 mn |
Technavio's oil pollution soil treatment market is segmented as below:
By Method
- Bioremediation
- Thermal treatment
- Chemical treatment
- Physical treatment
- Electrokinetic treatment
By End-user
- Oil and gas
- Industrial manufacturing
- Agriculture
- Waste management
- Construction and infrastructure
By Geographical Landscape
- North America
- Europe
- APAC
- South America
- Middle East and Africa
This study identifies the integration of data analytics, remote sensing, and geographic information system in monitoring soil conditions as one of the prime reasons driving the oil pollution soil treatment market growth during the next few years. Also, shift toward eco-friendly and sustainable soil treatment methods and use of nanotechnology in soil treatment will lead to sizable demand in the market.
The report on the oil pollution soil treatment market covers the following areas:
- Oil Pollution Soil Treatment Market sizing
- Oil Pollution Soil Treatment Market forecast
- Oil Pollution Soil Treatment Market industry analysis
The robust vendor analysis is designed to help clients improve their market position, and in line with this, this report provides a detailed analysis of several leading oil pollution soil treatment market vendors that include AECOM, Clean Earth Inc., Clean Harbors Inc., ENTACT LLC, ERM Group Inc., Excalibur Group LLC, Jacobs Solutions Inc., Keller Group Plc, Kuwait Petroleum Corp., NRC International Holdings, Ortec Group, REGENESIS, Soil Solutions Inc., SUEZ SA, Terrapure Environmental, Tetra Tech Coffey Holding Pty Ltd., Veolia Environnement SA, and WSP Global Inc.. Also, the oil pollution soil treatment market analysis report includes information on upcoming trends and challenges that will influence market growth. This is to help companies strategize and leverage all forthcoming growth opportunities.
The study was conducted using an objective combination of primary and secondary information including inputs from key participants in the industry. The report contains a comprehensive market and vendor landscape in addition to an analysis of the key vendors.
The publisher presents a detailed picture of the market by the way of study, synthesis, and summation of data from multiple sources by an analysis of key parameters such as profit, pricing, competition, and promotions. It presents various market facets by identifying the key industry influencers. The data presented is comprehensive, reliable, and a result of extensive primary and secondary research. The market research reports provide a complete competitive landscape and an in-depth vendor selection methodology and analysis using qualitative and quantitative research to forecast accurate market growth.
Table of Contents
1 Executive Summary
- 1.1 Market overview
- Executive Summary - Chart on Market Overview
- Executive Summary - Data Table on Market Overview
- Executive Summary - Chart on Global Market Characteristics
- Executive Summary - Chart on Market By Geographical Landscape
- Executive Summary - Chart on Market Segmentation by Method
- Executive Summary - Chart on Market Segmentation by End-user
- Executive Summary - Chart on Incremental Growth
- Executive Summary - Data Table on Incremental Growth
- Executive Summary - Chart on Company Market Positioning
2 Technavio Analysis
- 2.1 Analysis of price sensitivity, lifecycle, customer purchase basket, adoption rates, and purchase criteria
- Analysis of price sensitivity, lifecycle, customer purchase basket, adoption rates, and purchase criteria
- 2.2 Criticality of inputs and Factors of differentiation
- Overview on criticality of inputs and factors of differentiation
- 2.3 Factors of disruption
- Overview on factors of disruption
- 2.4 Impact of drivers and challenges
- Impact of drivers and challenges in 2023 and 2028
3 Market Landscape
- 3.1 Market ecosystem
- Parent Market
- Data Table on - Parent Market
- 3.2 Market characteristics
- Market characteristics analysis
- 3.3 Value chain analysis
- Value Chain Analysis
4 Market Sizing
- 4.1 Market definition
- Offerings of companies included in the market definition
- 4.2 Market segment analysis
- Market segments
- 4.3 Market size 2023
- 4.4 Market outlook: Forecast for 2023-2028
- Chart on Global - Market size and forecast 2023-2028 ($ million)
- Data Table on Global - Market size and forecast 2023-2028 ($ million)
- Chart on Global Market: Year-over-year growth 2023-2028 (%)
- Data Table on Global Market: Year-over-year growth 2023-2028 (%)
5 Historic Market Size
- 5.1 Global Oil Pollution Soil Treatment Market 2018 - 2022
- Historic Market Size - Data Table on Global Oil Pollution Soil Treatment Market 2018 - 2022 ($ million)
- 5.2 Method segment analysis 2018 - 2022
- Historic Market Size - Method Segment 2018 - 2022 ($ million)
- 5.3 End-user segment analysis 2018 - 2022
- Historic Market Size - End-user Segment 2018 - 2022 ($ million)
- 5.4 Geography segment analysis 2018 - 2022
- Historic Market Size - Geography Segment 2018 - 2022 ($ million)
- 5.5 Country segment analysis 2018 - 2022
- Historic Market Size - Country Segment 2018 - 2022 ($ million)
6 Qualitative Analysis
- 6.1 Impact of AI on the Global Oil Pollution Soil Treatment Market
7 Five Forces Analysis
- 7.1 Five forces summary
- Five forces analysis - Comparison between 2023 and 2028
- 7.2 Bargaining power of buyers
- Bargaining power of buyers - Impact of key factors 2023 and 2028
- 7.3 Bargaining power of suppliers
- Bargaining power of suppliers - Impact of key factors in 2023 and 2028
- 7.4 Threat of new entrants
- Threat of new entrants - Impact of key factors in 2023 and 2028
- 7.5 Threat of substitutes
- Threat of substitutes - Impact of key factors in 2023 and 2028
- 7.6 Threat of rivalry
- Threat of rivalry - Impact of key factors in 2023 and 2028
- 7.7 Market condition
- Chart on Market condition - Five forces 2023 and 2028
8 Market Segmentation by Method
- 8.1 Market segments
- Chart on Method - Market share 2023-2028 (%)
- Data Table on Method - Market share 2023-2028 (%)
- 8.2 Comparison by Method
- Chart on Comparison by Method
- Data Table on Comparison by Method
- 8.3 Bioremediation - Market size and forecast 2023-2028
- Chart on Bioremediation - Market size and forecast 2023-2028 ($ million)
- Data Table on Bioremediation - Market size and forecast 2023-2028 ($ million)
- Chart on Bioremediation - Year-over-year growth 2023-2028 (%)
- Data Table on Bioremediation - Year-over-year growth 2023-2028 (%)
- 8.4 Thermal treatment - Market size and forecast 2023-2028
- Chart on Thermal treatment - Market size and forecast 2023-2028 ($ million)
- Data Table on Thermal treatment - Market size and forecast 2023-2028 ($ million)
- Chart on Thermal treatment - Year-over-year growth 2023-2028 (%)
- Data Table on Thermal treatment - Year-over-year growth 2023-2028 (%)
- 8.5 Chemical treatment - Market size and forecast 2023-2028
- Chart on Chemical treatment - Market size and forecast 2023-2028 ($ million)
- Data Table on Chemical treatment - Market size and forecast 2023-2028 ($ million)
- Chart on Chemical treatment - Year-over-year growth 2023-2028 (%)
- Data Table on Chemical treatment - Year-over-year growth 2023-2028 (%)
- 8.6 Physical treatment - Market size and forecast 2023-2028
- Chart on Physical treatment - Market size and forecast 2023-2028 ($ million)
- Data Table on Physical treatment - Market size and forecast 2023-2028 ($ million)
- Chart on Physical treatment - Year-over-year growth 2023-2028 (%)
- Data Table on Physical treatment - Year-over-year growth 2023-2028 (%)
- 8.7 Electrokinetic treatment - Market size and forecast 2023-2028
- Chart on Electrokinetic treatment - Market size and forecast 2023-2028 ($ million)
- Data Table on Electrokinetic treatment - Market size and forecast 2023-2028 ($ million)
- Chart on Electrokinetic treatment - Year-over-year growth 2023-2028 (%)
- Data Table on Electrokinetic treatment - Year-over-year growth 2023-2028 (%)
- 8.8 Market opportunity by Method
- Market opportunity by Method ($ million)
- Data Table on Market opportunity by Method ($ million)
9 Market Segmentation by End-user
- 9.1 Market segments
- Chart on End-user - Market share 2023-2028 (%)
- Data Table on End-user - Market share 2023-2028 (%)
- 9.2 Comparison by End-user
- Chart on Comparison by End-user
- Data Table on Comparison by End-user
- 9.3 Oil and gas - Market size and forecast 2023-2028
- Chart on Oil and gas - Market size and forecast 2023-2028 ($ million)
- Data Table on Oil and gas - Market size and forecast 2023-2028 ($ million)
- Chart on Oil and gas - Year-over-year growth 2023-2028 (%)
- Data Table on Oil and gas - Year-over-year growth 2023-2028 (%)
- 9.4 Industrial manufacturing - Market size and forecast 2023-2028
- Chart on Industrial manufacturing - Market size and forecast 2023-2028 ($ million)
- Data Table on Industrial manufacturing - Market size and forecast 2023-2028 ($ million)
- Chart on Industrial manufacturing - Year-over-year growth 2023-2028 (%)
- Data Table on Industrial manufacturing - Year-over-year growth 2023-2028 (%)
- 9.5 Agriculture - Market size and forecast 2023-2028
- Chart on Agriculture - Market size and forecast 2023-2028 ($ million)
- Data Table on Agriculture - Market size and forecast 2023-2028 ($ million)
- Chart on Agriculture - Year-over-year growth 2023-2028 (%)
- Data Table on Agriculture - Year-over-year growth 2023-2028 (%)
- 9.6 Waste management - Market size and forecast 2023-2028
- Chart on Waste management - Market size and forecast 2023-2028 ($ million)
- Data Table on Waste management - Market size and forecast 2023-2028 ($ million)
- Chart on Waste management - Year-over-year growth 2023-2028 (%)
- Data Table on Waste management - Year-over-year growth 2023-2028 (%)
- 9.7 Construction and infrastructure - Market size and forecast 2023-2028
- Chart on Construction and infrastructure - Market size and forecast 2023-2028 ($ million)
- Data Table on Construction and infrastructure - Market size and forecast 2023-2028 ($ million)
- Chart on Construction and infrastructure - Year-over-year growth 2023-2028 (%)
- Data Table on Construction and infrastructure - Year-over-year growth 2023-2028 (%)
- 9.8 Market opportunity by End-user
- Market opportunity by End-user ($ million)
- Data Table on Market opportunity by End-user ($ million)
10 Customer Landscape
- 10.1 Customer landscape overview
- Analysis of price sensitivity, lifecycle, customer purchase basket, adoption rates, and purchase criteria
11 Geographic Landscape
- 11.1 Geographic segmentation
- Chart on Market share By Geographical Landscape 2023-2028 (%)
- Data Table on Market share By Geographical Landscape 2023-2028 (%)
- 11.2 Geographic comparison
- Chart on Geographic comparison
- Data Table on Geographic comparison
- 11.3 North America - Market size and forecast 2023-2028
- Chart on North America - Market size and forecast 2023-2028 ($ million)
- Data Table on North America - Market size and forecast 2023-2028 ($ million)
- Chart on North America - Year-over-year growth 2023-2028 (%)
- Data Table on North America - Year-over-year growth 2023-2028 (%)
- 11.4 Europe - Market size and forecast 2023-2028
- Chart on Europe - Market size and forecast 2023-2028 ($ million)
- Data Table on Europe - Market size and forecast 2023-2028 ($ million)
- Chart on Europe - Year-over-year growth 2023-2028 (%)
- Data Table on Europe - Year-over-year growth 2023-2028 (%)
- 11.5 APAC - Market size and forecast 2023-2028
- Chart on APAC - Market size and forecast 2023-2028 ($ million)
- Data Table on APAC - Market size and forecast 2023-2028 ($ million)
- Chart on APAC - Year-over-year growth 2023-2028 (%)
- Data Table on APAC - Year-over-year growth 2023-2028 (%)
- 11.6 South America - Market size and forecast 2023-2028
- Chart on South America - Market size and forecast 2023-2028 ($ million)
- Data Table on South America - Market size and forecast 2023-2028 ($ million)
- Chart on South America - Year-over-year growth 2023-2028 (%)
- Data Table on South America - Year-over-year growth 2023-2028 (%)
- 11.7 Middle East and Africa - Market size and forecast 2023-2028
- Chart on Middle East and Africa - Market size and forecast 2023-2028 ($ million)
- Data Table on Middle East and Africa - Market size and forecast 2023-2028 ($ million)
- Chart on Middle East and Africa - Year-over-year growth 2023-2028 (%)
- Data Table on Middle East and Africa - Year-over-year growth 2023-2028 (%)
- 11.8 US - Market size and forecast 2023-2028
- Chart on US - Market size and forecast 2023-2028 ($ million)
- Data Table on US - Market size and forecast 2023-2028 ($ million)
- Chart on US - Year-over-year growth 2023-2028 (%)
- Data Table on US - Year-over-year growth 2023-2028 (%)
- 11.9 UK - Market size and forecast 2023-2028
- Chart on UK - Market size and forecast 2023-2028 ($ million)
- Data Table on UK - Market size and forecast 2023-2028 ($ million)
- Chart on UK - Year-over-year growth 2023-2028 (%)
- Data Table on UK - Year-over-year growth 2023-2028 (%)
- 11.10 China - Market size and forecast 2023-2028
- Chart on China - Market size and forecast 2023-2028 ($ million)
- Data Table on China - Market size and forecast 2023-2028 ($ million)
- Chart on China - Year-over-year growth 2023-2028 (%)
- Data Table on China - Year-over-year growth 2023-2028 (%)
- 11.11 India - Market size and forecast 2023-2028
- Chart on India - Market size and forecast 2023-2028 ($ million)
- Data Table on India - Market size and forecast 2023-2028 ($ million)
- Chart on India - Year-over-year growth 2023-2028 (%)
- Data Table on India - Year-over-year growth 2023-2028 (%)
- 11.12 Germany - Market size and forecast 2023-2028
- Chart on Germany - Market size and forecast 2023-2028 ($ million)
- Data Table on Germany - Market size and forecast 2023-2028 ($ million)
- Chart on Germany - Year-over-year growth 2023-2028 (%)
- Data Table on Germany - Year-over-year growth 2023-2028 (%)
- 11.13 Brazil - Market size and forecast 2023-2028
- Chart on Brazil - Market size and forecast 2023-2028 ($ million)
- Data Table on Brazil - Market size and forecast 2023-2028 ($ million)
- Chart on Brazil - Year-over-year growth 2023-2028 (%)
- Data Table on Brazil - Year-over-year growth 2023-2028 (%)
- 11.14 Japan - Market size and forecast 2023-2028
- Chart on Japan - Market size and forecast 2023-2028 ($ million)
- Data Table on Japan - Market size and forecast 2023-2028 ($ million)
- Chart on Japan - Year-over-year growth 2023-2028 (%)
- Data Table on Japan - Year-over-year growth 2023-2028 (%)
- 11.15 France - Market size and forecast 2023-2028
- Chart on France - Market size and forecast 2023-2028 ($ million)
- Data Table on France - Market size and forecast 2023-2028 ($ million)
- Chart on France - Year-over-year growth 2023-2028 (%)
- Data Table on France - Year-over-year growth 2023-2028 (%)
- 11.16 Canada - Market size and forecast 2023-2028
- Chart on Canada - Market size and forecast 2023-2028 ($ million)
- Data Table on Canada - Market size and forecast 2023-2028 ($ million)
- Chart on Canada - Year-over-year growth 2023-2028 (%)
- Data Table on Canada - Year-over-year growth 2023-2028 (%)
- 11.17 Italy - Market size and forecast 2023-2028
- Chart on Italy - Market size and forecast 2023-2028 ($ million)
- Data Table on Italy - Market size and forecast 2023-2028 ($ million)
- Chart on Italy - Year-over-year growth 2023-2028 (%)
- Data Table on Italy - Year-over-year growth 2023-2028 (%)
- 11.18 Market opportunity By Geographical Landscape
- Market opportunity By Geographical Landscape ($ million)
- Data Tables on Market opportunity By Geographical Landscape ($ million)
12 Drivers, Challenges, and Opportunity/Restraints
- 12.1 Market drivers
- 12.2 Market challenges
- 12.3 Impact of drivers and challenges
- Impact of drivers and challenges in 2023 and 2028
- 12.4 Market opportunities/restraints
13 Competitive Landscape
- 13.1 Overview
- 13.2 Competitive Landscape
- Overview on criticality of inputs and factors of differentiation
- 13.3 Landscape disruption
- Overview on factors of disruption
- 13.4 Industry risks
- Impact of key risks on business
14 Competitive Analysis
- 14.1 Companies profiled
- Companies covered
- 14.2 Company ranking index
- Company ranking index
- 14.3 Market positioning of companies
- Matrix on companies position and classification
- 14.4 AECOM
- AECOM - Overview
- AECOM - Business segments
- AECOM - Key news
- AECOM - Key offerings
- AECOM - Segment focus
- SWOT
- 14.5 Clean Earth Inc.
- Clean Earth Inc. - Overview
- Clean Earth Inc. - Product / Service
- Clean Earth Inc. - Key offerings
- SWOT
- 14.6 Clean Harbors Inc.
- Clean Harbors Inc. - Overview
- Clean Harbors Inc. - Business segments
- Clean Harbors Inc. - Key news
- Clean Harbors Inc. - Key offerings
- Clean Harbors Inc. - Segment focus
- SWOT
- 14.7 ENTACT LLC
- ENTACT LLC - Overview
- ENTACT LLC - Product / Service
- ENTACT LLC - Key offerings
- SWOT
- 14.8 ERM Group Inc.
- ERM Group Inc. - Overview
- ERM Group Inc. - Product / Service
- ERM Group Inc. - Key offerings
- SWOT
- 14.9 Keller Group Plc
- Keller Group Plc - Overview
- Keller Group Plc - Business segments
- Keller Group Plc - Key offerings
- Keller Group Plc - Segment focus
- SWOT
- 14.10 Kuwait Petroleum Corp.
- Kuwait Petroleum Corp. - Overview
- Kuwait Petroleum Corp. - Product / Service
- Kuwait Petroleum Corp. - Key offerings
- SWOT
- 14.11 NRC International Holdings
- NRC International Holdings - Overview
- NRC International Holdings - Product / Service
- NRC International Holdings - Key offerings
- SWOT
- 14.12 Ortec Group
- Ortec Group - Overview
- Ortec Group - Product / Service
- Ortec Group - Key offerings
- SWOT
- 14.13 REGENESIS
- REGENESIS - Overview
- REGENESIS - Product / Service
- REGENESIS - Key offerings
- SWOT
- 14.14 Soil Solutions Inc.
- Soil Solutions Inc. - Overview
- Soil Solutions Inc. - Product / Service
- Soil Solutions Inc. - Key offerings
- SWOT
- 14.15 SUEZ SA
- SUEZ SA - Overview
- SUEZ SA - Product / Service
- SUEZ SA - Key news
- SUEZ SA - Key offerings
- SWOT
- 14.16 Terrapure Environmental
- Terrapure Environmental - Overview
- Terrapure Environmental - Product / Service
- Terrapure Environmental - Key offerings
- SWOT
- 14.17 Veolia Environnement SA
- Veolia Environnement SA - Overview
- Veolia Environnement SA - Business segments
- Veolia Environnement SA - Key news
- Veolia Environnement SA - Key offerings
- Veolia Environnement SA - Segment focus
- SWOT
- 14.18 WSP Global Inc.
- WSP Global Inc. - Overview
- WSP Global Inc. - Business segments
- WSP Global Inc. - Key offerings
- WSP Global Inc. - Segment focus
- SWOT
15 Appendix
- 15.1 Scope of the report
- 15.2 Inclusions and exclusions checklist
- Inclusions checklist
- Exclusions checklist
- 15.3 Currency conversion rates for US$
- Currency conversion rates for US$
- 15.4 Research methodology
- Research methodology
- 15.5 Data procurement
- Information sources
- 15.6 Data validation
- Data validation
- 15.7 Validation techniques employed for market sizing
- Validation techniques employed for market sizing
- 15.8 Data synthesis
- Data synthesis
- 15.9 360 degree market analysis
- 360 degree market analysis
- 15.10 List of abbreviations
- List of abbreviations
- Strong business value chain
- Higher growth prospects
- Strong operational management
- Strong business value chain
- Economies of scale
- Strong market position
- Higher growth prospects
- Strong business value chain
- Strong operational management
- Strong business value chain
- Economies of scale
- Strong operational management
- Strong market position
- Higher growth prospects
- Economies of scale
- Strong market position
- Strong operational management
- Stable customer base
- Economies of scale
- Higher growth prospects

