|
|
市場調査レポート
商品コード
1584008
電動車いすの世界市場、2024~2028年Global Electric Wheelchairs Market 2024-2028 |
||||||

|
|||||||
カスタマイズ可能
|
|||||||


| 電動車いすの世界市場、2024~2028年 |
|
出版日: 2024年08月15日
発行: TechNavio
ページ情報: 英文 149 Pages
納期: 即納可能
|

全表示
- 概要
- 図表
- 目次
電動車いす市場、2024~2028年
電動車いす市場は2023~2028年に25億9,000万米ドル、予測期間中のCAGRは13.64%で成長すると予測されます。当レポートでは、電動車いす市場の全体的な分析、市場規模・予測、動向、成長促進要因、課題、約25のベンダーを網羅したベンダー分析などを掲載しています。
現在の市場シナリオ、最新動向と促進要因、市場環境全体に関する最新分析を提供しています。市場は、整形外科疾患や神経疾患の有病率の増加、リハビリテーションサービスの需要拡大、新製品の発売などによって牽引されています。
| 市場範囲 | |
|---|---|
| 基準年 | 2024年 |
| 終了年 | 2028年 |
| 予測期間 | 2024~2028年 |
| 成長モメンタム | 加速 |
| 前年比[2024年] | 11.73% |
| CAGR | 13.64% |
| 増分額 | 25億9,000万米ドル |
本調査では、今後数年間の電動車いす市場成長を牽引する主要要因の一つとして、前輪式電動車いすの採用が増加していることを挙げています。また、eコマースチャネルを通じたオンライン販売の増加や、世界の高齢者の増加が、市場の大きな需要につながるとしています。
目次
第1章 エグゼクティブサマリー
- 市場概要
第2章 市場情勢
- 市場エコシステム
- 市場の特徴
- バリューチェーン分析
第3章 市場規模の評価
- 市場の定義
- 市場セグメント分析
- 市場規模 2023年
- 市場の展望 2023~2028年
第4章 市場規模実績
- 電動車いすの世界市場 2018~2022年
- エンドユーザー別セグメント分析 2018~2022年
- 製品別セグメント分析 2018~2022年
- 地域別セグメント分析 2018~2022年
- 国別セグメント分析 2018~2022年
第5章 ファイブフォース分析
- ファイブフォースの要約
- 買い手の交渉力
- 供給企業の交渉力
- 新規参入業者の脅威
- 代替品の脅威
- 競争の脅威
- 市況
第6章 エンドユーザー別市場セグメンテーション
- 市場セグメンテーション
- 比較:エンドユーザー別
- 個人:市場規模と予測 2023~2028年
- 病院:市場規模と予測 2023~2028年
- スポーツコンディショニング:市場規模と予測 2023~2028年
- エンドユーザー別の市場機会
第7章 製品別市場セグメンテーション
- 市場セグメンテーション
- 比較:製品別
- 乾電池型電動車いす:市場規模と予測 2023~2028年
- 電解液型電動車いす:市場規模と予測 2023~2028年
- 製品別の市場機会
第8章 顧客情勢
- 顧客情勢概要
第9章 地域別情勢
- 地域別セグメンテーション
- 比較:地域別
- 北米:市場規模と予測 2023~2028年
- 欧州:市場規模と予測 2023~2028年
- アジア:市場規模と予測 2023~2028年
- その他:市場規模と予測 2023~2028年
- 米国:市場規模と予測 2023~2028年
- ドイツ:市場規模と予測 2023~2028年
- カナダ:市場規模と予測 2023~2028年
- フランス:市場規模と予測 2023~2028年
- 日本:市場規模と予測 2023~2028年
- 地域情勢別の市場機会
第10章 促進要因・課題・機会・抑制要因
- 市場促進要因
- 市場課題
- 促進要因と課題の影響
- 市場機会・抑制要因
第11章 競合情勢
- 概要
- 競合情勢
- 混乱の状況
- 業界のリスク
第12章 競合分析
- 企業プロファイル
- 企業の市場ポジショニング
- ComfyGO Inc.
- GF Health Products Inc.
- Hoveround Corp.
- Invacare Corp.
- Karma Medical Products Co. Ltd.
- LEVO AG
- Matsunaga Manufactory Co. Ltd.
- Medical Depot Inc.
- Medical Device Depot Inc.
- MEYRA GROUP
- Ottobock SE and Co. KGaA
- Permobil AB
- Pride Mobility Products Corp.
- Roma Medical
- Sunrise Medical LLC
第13章 付録
Exhibits:
- Exhibits1: Executive Summary - Chart on Market Overview
- Exhibits2: Executive Summary - Data Table on Market Overview
- Exhibits3: Executive Summary - Chart on Global Market Characteristics
- Exhibits4: Executive Summary - Chart on Market By Geographical Landscape
- Exhibits5: Executive Summary - Chart on Market Segmentation by End-user
- Exhibits6: Executive Summary - Chart on Market Segmentation by Product
- Exhibits7: Executive Summary - Chart on Incremental Growth
- Exhibits8: Executive Summary - Data Table on Incremental Growth
- Exhibits9: Executive Summary - Chart on Company Market Positioning
- Exhibits10: Parent Market
- Exhibits11: Data Table on - Parent Market
- Exhibits12: Market characteristics analysis
- Exhibits13: Value Chain Analysis
- Exhibits14: Offerings of companies included in the market definition
- Exhibits15: Market segments
- Exhibits16: Chart on Global - Market size and forecast 2023-2028 ($ million)
- Exhibits17: Data Table on Global - Market size and forecast 2023-2028 ($ million)
- Exhibits18: Chart on Global Market: Year-over-year growth 2023-2028 (%)
- Exhibits19: Data Table on Global Market: Year-over-year growth 2023-2028 (%)
- Exhibits20: Historic Market Size - Data Table on Global Electric Wheelchairs Market 2018 - 2022 ($ million)
- Exhibits21: Historic Market Size - End-user Segment 2018 - 2022 ($ million)
- Exhibits22: Historic Market Size - Product Segment 2018 - 2022 ($ million)
- Exhibits23: Historic Market Size - Geography Segment 2018 - 2022 ($ million)
- Exhibits24: Historic Market Size - Country Segment 2018 - 2022 ($ million)
- Exhibits25: Five forces analysis - Comparison between 2023 and 2028
- Exhibits26: Bargaining power of buyers - Impact of key factors 2023 and 2028
- Exhibits27: Bargaining power of suppliers - Impact of key factors in 2023 and 2028
- Exhibits28: Threat of new entrants - Impact of key factors in 2023 and 2028
- Exhibits29: Threat of substitutes - Impact of key factors in 2023 and 2028
- Exhibits30: Threat of rivalry - Impact of key factors in 2023 and 2028
- Exhibits31: Chart on Market condition - Five forces 2023 and 2028
- Exhibits32: Chart on End-user - Market share 2023-2028 (%)
- Exhibits33: Data Table on End-user - Market share 2023-2028 (%)
- Exhibits34: Chart on Comparison by End-user
- Exhibits35: Data Table on Comparison by End-user
- Exhibits36: Chart on Personal - Market size and forecast 2023-2028 ($ million)
- Exhibits37: Data Table on Personal - Market size and forecast 2023-2028 ($ million)
- Exhibits38: Chart on Personal - Year-over-year growth 2023-2028 (%)
- Exhibits39: Data Table on Personal - Year-over-year growth 2023-2028 (%)
- Exhibits40: Chart on Hospitals - Market size and forecast 2023-2028 ($ million)
- Exhibits41: Data Table on Hospitals - Market size and forecast 2023-2028 ($ million)
- Exhibits42: Chart on Hospitals - Year-over-year growth 2023-2028 (%)
- Exhibits43: Data Table on Hospitals - Year-over-year growth 2023-2028 (%)
- Exhibits44: Chart on Sports conditioning - Market size and forecast 2023-2028 ($ million)
- Exhibits45: Data Table on Sports conditioning - Market size and forecast 2023-2028 ($ million)
- Exhibits46: Chart on Sports conditioning - Year-over-year growth 2023-2028 (%)
- Exhibits47: Data Table on Sports conditioning - Year-over-year growth 2023-2028 (%)
- Exhibits48: Market opportunity by End-user ($ million)
- Exhibits49: Data Table on Market opportunity by End-user ($ million)
- Exhibits50: Chart on Product - Market share 2023-2028 (%)
- Exhibits51: Data Table on Product - Market share 2023-2028 (%)
- Exhibits52: Chart on Comparison by Product
- Exhibits53: Data Table on Comparison by Product
- Exhibits54: Chart on Dry-battery electric wheelchairs - Market size and forecast 2023-2028 ($ million)
- Exhibits55: Data Table on Dry-battery electric wheelchairs - Market size and forecast 2023-2028 ($ million)
- Exhibits56: Chart on Dry-battery electric wheelchairs - Year-over-year growth 2023-2028 (%)
- Exhibits57: Data Table on Dry-battery electric wheelchairs - Year-over-year growth 2023-2028 (%)
- Exhibits58: Chart on Wet-battery electric wheelchairs - Market size and forecast 2023-2028 ($ million)
- Exhibits59: Data Table on Wet-battery electric wheelchairs - Market size and forecast 2023-2028 ($ million)
- Exhibits60: Chart on Wet-battery electric wheelchairs - Year-over-year growth 2023-2028 (%)
- Exhibits61: Data Table on Wet-battery electric wheelchairs - Year-over-year growth 2023-2028 (%)
- Exhibits62: Market opportunity by Product ($ million)
- Exhibits63: Data Table on Market opportunity by Product ($ million)
- Exhibits64: Analysis of price sensitivity, lifecycle, customer purchase basket, adoption rates, and purchase criteria
- Exhibits65: Chart on Market share By Geographical Landscape 2023-2028 (%)
- Exhibits66: Data Table on Market share By Geographical Landscape 2023-2028 (%)
- Exhibits67: Chart on Geographic comparison
- Exhibits68: Data Table on Geographic comparison
- Exhibits69: Chart on North America - Market size and forecast 2023-2028 ($ million)
- Exhibits70: Data Table on North America - Market size and forecast 2023-2028 ($ million)
- Exhibits71: Chart on North America - Year-over-year growth 2023-2028 (%)
- Exhibits72: Data Table on North America - Year-over-year growth 2023-2028 (%)
- Exhibits73: Chart on Europe - Market size and forecast 2023-2028 ($ million)
- Exhibits74: Data Table on Europe - Market size and forecast 2023-2028 ($ million)
- Exhibits75: Chart on Europe - Year-over-year growth 2023-2028 (%)
- Exhibits76: Data Table on Europe - Year-over-year growth 2023-2028 (%)
- Exhibits77: Chart on Asia - Market size and forecast 2023-2028 ($ million)
- Exhibits78: Data Table on Asia - Market size and forecast 2023-2028 ($ million)
- Exhibits79: Chart on Asia - Year-over-year growth 2023-2028 (%)
- Exhibits80: Data Table on Asia - Year-over-year growth 2023-2028 (%)
- Exhibits81: Chart on Rest of World (ROW) - Market size and forecast 2023-2028 ($ million)
- Exhibits82: Data Table on Rest of World (ROW) - Market size and forecast 2023-2028 ($ million)
- Exhibits83: Chart on Rest of World (ROW) - Year-over-year growth 2023-2028 (%)
- Exhibits84: Data Table on Rest of World (ROW) - Year-over-year growth 2023-2028 (%)
- Exhibits85: Chart on US - Market size and forecast 2023-2028 ($ million)
- Exhibits86: Data Table on US - Market size and forecast 2023-2028 ($ million)
- Exhibits87: Chart on US - Year-over-year growth 2023-2028 (%)
- Exhibits88: Data Table on US - Year-over-year growth 2023-2028 (%)
- Exhibits89: Chart on Germany - Market size and forecast 2023-2028 ($ million)
- Exhibits90: Data Table on Germany - Market size and forecast 2023-2028 ($ million)
- Exhibits91: Chart on Germany - Year-over-year growth 2023-2028 (%)
- Exhibits92: Data Table on Germany - Year-over-year growth 2023-2028 (%)
- Exhibits93: Chart on Canada - Market size and forecast 2023-2028 ($ million)
- Exhibits94: Data Table on Canada - Market size and forecast 2023-2028 ($ million)
- Exhibits95: Chart on Canada - Year-over-year growth 2023-2028 (%)
- Exhibits96: Data Table on Canada - Year-over-year growth 2023-2028 (%)
- Exhibits97: Chart on France - Market size and forecast 2023-2028 ($ million)
- Exhibits98: Data Table on France - Market size and forecast 2023-2028 ($ million)
- Exhibits99: Chart on France - Year-over-year growth 2023-2028 (%)
- Exhibits100: Data Table on France - Year-over-year growth 2023-2028 (%)
- Exhibits101: Chart on Japan - Market size and forecast 2023-2028 ($ million)
- Exhibits102: Data Table on Japan - Market size and forecast 2023-2028 ($ million)
- Exhibits103: Chart on Japan - Year-over-year growth 2023-2028 (%)
- Exhibits104: Data Table on Japan - Year-over-year growth 2023-2028 (%)
- Exhibits105: Market opportunity By Geographical Landscape ($ million)
- Exhibits106: Data Tables on Market opportunity By Geographical Landscape ($ million)
- Exhibits107: Impact of drivers and challenges in 2023 and 2028
- Exhibits108: Overview on criticality of inputs and factors of differentiation
- Exhibits109: Overview on factors of disruption
- Exhibits110: Impact of key risks on business
- Exhibits111: Companies covered
- Exhibits112: Matrix on companies position and classification
- Exhibits113: ComfyGO Inc. - Overview
- Exhibits114: ComfyGO Inc. - Product / Service
- Exhibits115: ComfyGO Inc. - Key offerings
- Exhibits116: GF Health Products Inc. - Overview
- Exhibits117: GF Health Products Inc. - Product / Service
- Exhibits118: GF Health Products Inc. - Key offerings
- Exhibits119: Hoveround Corp. - Overview
- Exhibits120: Hoveround Corp. - Product / Service
- Exhibits121: Hoveround Corp. - Key offerings
- Exhibits122: Invacare Corp. - Overview
- Exhibits123: Invacare Corp. - Business segments
- Exhibits124: Invacare Corp. - Key news
- Exhibits125: Invacare Corp. - Key offerings
- Exhibits126: Invacare Corp. - Segment focus
- Exhibits127: Karma Medical Products Co. Ltd. - Overview
- Exhibits128: Karma Medical Products Co. Ltd. - Product / Service
- Exhibits129: Karma Medical Products Co. Ltd. - Key offerings
- Exhibits130: LEVO AG - Overview
- Exhibits131: LEVO AG - Product / Service
- Exhibits132: LEVO AG - Key offerings
- Exhibits133: Matsunaga Manufactory Co. Ltd. - Overview
- Exhibits134: Matsunaga Manufactory Co. Ltd. - Product / Service
- Exhibits135: Matsunaga Manufactory Co. Ltd. - Key offerings
- Exhibits136: Medical Depot Inc. - Overview
- Exhibits137: Medical Depot Inc. - Product / Service
- Exhibits138: Medical Depot Inc. - Key offerings
- Exhibits139: Medical Device Depot Inc. - Overview
- Exhibits140: Medical Device Depot Inc. - Product / Service
- Exhibits141: Medical Device Depot Inc. - Key offerings
- Exhibits142: MEYRA GROUP - Overview
- Exhibits143: MEYRA GROUP - Product / Service
- Exhibits144: MEYRA GROUP - Key offerings
- Exhibits145: Ottobock SE and Co. KGaA - Overview
- Exhibits146: Ottobock SE and Co. KGaA - Product / Service
- Exhibits147: Ottobock SE and Co. KGaA - Key offerings
- Exhibits148: Permobil AB - Overview
- Exhibits149: Permobil AB - Product / Service
- Exhibits150: Permobil AB - Key news
- Exhibits151: Permobil AB - Key offerings
- Exhibits152: Pride Mobility Products Corp. - Overview
- Exhibits153: Pride Mobility Products Corp. - Product / Service
- Exhibits154: Pride Mobility Products Corp. - Key offerings
- Exhibits155: Roma Medical - Overview
- Exhibits156: Roma Medical - Product / Service
- Exhibits157: Roma Medical - Key offerings
- Exhibits158: Sunrise Medical LLC - Overview
- Exhibits159: Sunrise Medical LLC - Product / Service
- Exhibits160: Sunrise Medical LLC - Key offerings
- Exhibits161: Inclusions checklist
- Exhibits162: Exclusions checklist
- Exhibits163: Currency conversion rates for US$
- Exhibits164: Research methodology
- Exhibits165: Information sources
- Exhibits166: Data validation
- Exhibits167: Validation techniques employed for market sizing
- Exhibits168: Data synthesis
- Exhibits169: 360 degree market analysis
- Exhibits170: List of abbreviations
Electric Wheelchairs Market 2024-2028
The electric wheelchairs market is forecasted to grow by USD 2590 mn during 2023-2028, accelerating at a CAGR of 13.64% during the forecast period. The report on the electric wheelchairs market provides a holistic analysis, market size and forecast, trends, growth drivers, and challenges, as well as vendor analysis covering around 25 vendors.
The report offers an up-to-date analysis regarding the current market scenario, the latest trends and drivers, and the overall market environment. The market is driven by increasing prevalence of orthopedic and neurologic disorders, growing demand for rehabilitation services, and new product launches.
| Market Scope | |
|---|---|
| Base Year | 2024 |
| End Year | 2028 |
| Series Year | 2024-2028 |
| Growth Momentum | Accelerate |
| YOY 2024 | 11.73% |
| CAGR | 13.64% |
| Incremental Value | $2590 mn |
Technavio's electric wheelchairs market is segmented as below:
By End-user
- Personal
- Hospitals
- Sports conditioning
By Product
- Dry-battery electric wheelchairs
- Wet-battery electric wheelchairs
By Geographical Landscape
- North America
- Europe
- Asia
- Rest of World (ROW)
This study identifies the growing adoption of front-wheel-electric wheelchairs as one of the prime reasons driving the electric wheelchairs market growth during the next few years. Also, growing online sales through e-commerce channels and rising geriatric population worldwide will lead to sizable demand in the market.
The report on the electric wheelchairs market covers the following areas:
- Electric wheelchairs market sizing
- Electric wheelchairs market forecast
- Electric wheelchairs market industry analysis
The robust vendor analysis is designed to help clients improve their market position, and in line with this, this report provides a detailed analysis of several leading electric wheelchairs market vendors that include ComfyGO Inc., GF Health Products Inc., Hoveround Corp., Invacare Corp., Karma Medical Products Co. Ltd., Karman Healthcare Inc., LEVO AG, Matsunaga Manufactory Co. Ltd., Medical Depot Inc., Medical Device Depot Inc., MEYRA GROUP, Mr. Wheelchair cc, Ottobock SE and Co. KGaA, Permobil AB, Pride Mobility Products Corp., Roma Medical, Silverline meditech Pvt. Ltd., Sunrise Medical LLC, United Seating and Mobility LLC, and WHILL Inc.. Also, the electric wheelchairs market analysis report includes information on upcoming trends and challenges that will influence market growth. This is to help companies strategize and leverage all forthcoming growth opportunities.
The study was conducted using an objective combination of primary and secondary information including inputs from key participants in the industry. The report contains a comprehensive market and vendor landscape in addition to an analysis of the key vendors.
The publisher presents a detailed picture of the market by the way of study, synthesis, and summation of data from multiple sources by an analysis of key parameters such as profit, pricing, competition, and promotions. It presents various market facets by identifying the key industry influencers. The data presented is comprehensive, reliable, and a result of extensive primary and secondary research. The market research reports provide a complete competitive landscape and an in-depth vendor selection methodology and analysis using qualitative and quantitative research to forecast accurate market growth.
Table of Contents
1 Executive Summary
- 1.1 Market overview
- Executive Summary - Chart on Market Overview
- Executive Summary - Data Table on Market Overview
- Executive Summary - Chart on Global Market Characteristics
- Executive Summary - Chart on Market By Geographical Landscape
- Executive Summary - Chart on Market Segmentation by End-user
- Executive Summary - Chart on Market Segmentation by Product
- Executive Summary - Chart on Incremental Growth
- Executive Summary - Data Table on Incremental Growth
- Executive Summary - Chart on Company Market Positioning
2 Market Landscape
- 2.1 Market ecosystem
- Parent Market
- Data Table on - Parent Market
- 2.2 Market characteristics
- Market characteristics analysis
- 2.3 Value chain analysis
- Value Chain Analysis
3 Market Sizing
- 3.1 Market definition
- Offerings of companies included in the market definition
- 3.2 Market segment analysis
- Market segments
- 3.3 Market size 2023
- 3.4 Market outlook: Forecast for 2023-2028
- Chart on Global - Market size and forecast 2023-2028 ($ million)
- Data Table on Global - Market size and forecast 2023-2028 ($ million)
- Chart on Global Market: Year-over-year growth 2023-2028 (%)
- Data Table on Global Market: Year-over-year growth 2023-2028 (%)
4 Historic Market Size
- 4.1 Global Electric Wheelchairs Market 2018 - 2022
- Historic Market Size - Data Table on Global Electric Wheelchairs Market 2018 - 2022 ($ million)
- 4.2 End-user segment analysis 2018 - 2022
- Historic Market Size - End-user Segment 2018 - 2022 ($ million)
- 4.3 Product segment analysis 2018 - 2022
- Historic Market Size - Product Segment 2018 - 2022 ($ million)
- 4.4 Geography segment analysis 2018 - 2022
- Historic Market Size - Geography Segment 2018 - 2022 ($ million)
- 4.5 Country segment analysis 2018 - 2022
- Historic Market Size - Country Segment 2018 - 2022 ($ million)
5 Five Forces Analysis
- 5.1 Five forces summary
- Five forces analysis - Comparison between 2023 and 2028
- 5.2 Bargaining power of buyers
- Bargaining power of buyers - Impact of key factors 2023 and 2028
- 5.3 Bargaining power of suppliers
- Bargaining power of suppliers - Impact of key factors in 2023 and 2028
- 5.4 Threat of new entrants
- Threat of new entrants - Impact of key factors in 2023 and 2028
- 5.5 Threat of substitutes
- Threat of substitutes - Impact of key factors in 2023 and 2028
- 5.6 Threat of rivalry
- Threat of rivalry - Impact of key factors in 2023 and 2028
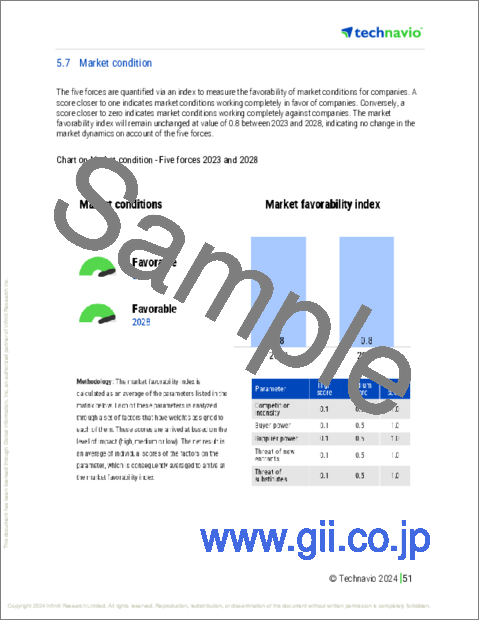
- 5.7 Market condition
- Chart on Market condition - Five forces 2023 and 2028
6 Market Segmentation by End-user
- 6.1 Market segments
- Chart on End-user - Market share 2023-2028 (%)
- Data Table on End-user - Market share 2023-2028 (%)
- 6.2 Comparison by End-user
- Chart on Comparison by End-user
- Data Table on Comparison by End-user
- 6.3 Personal - Market size and forecast 2023-2028
- Chart on Personal - Market size and forecast 2023-2028 ($ million)
- Data Table on Personal - Market size and forecast 2023-2028 ($ million)
- Chart on Personal - Year-over-year growth 2023-2028 (%)
- Data Table on Personal - Year-over-year growth 2023-2028 (%)
- 6.4 Hospitals - Market size and forecast 2023-2028
- Chart on Hospitals - Market size and forecast 2023-2028 ($ million)
- Data Table on Hospitals - Market size and forecast 2023-2028 ($ million)
- Chart on Hospitals - Year-over-year growth 2023-2028 (%)
- Data Table on Hospitals - Year-over-year growth 2023-2028 (%)
- 6.5 Sports conditioning - Market size and forecast 2023-2028
- Chart on Sports conditioning - Market size and forecast 2023-2028 ($ million)
- Data Table on Sports conditioning - Market size and forecast 2023-2028 ($ million)
- Chart on Sports conditioning - Year-over-year growth 2023-2028 (%)
- Data Table on Sports conditioning - Year-over-year growth 2023-2028 (%)
- 6.6 Market opportunity by End-user
- Market opportunity by End-user ($ million)
- Data Table on Market opportunity by End-user ($ million)
7 Market Segmentation by Product
- 7.1 Market segments
- Chart on Product - Market share 2023-2028 (%)
- Data Table on Product - Market share 2023-2028 (%)
- 7.2 Comparison by Product
- Chart on Comparison by Product
- Data Table on Comparison by Product
- 7.3 Dry-battery electric wheelchairs - Market size and forecast 2023-2028
- Chart on Dry-battery electric wheelchairs - Market size and forecast 2023-2028 ($ million)
- Data Table on Dry-battery electric wheelchairs - Market size and forecast 2023-2028 ($ million)
- Chart on Dry-battery electric wheelchairs - Year-over-year growth 2023-2028 (%)
- Data Table on Dry-battery electric wheelchairs - Year-over-year growth 2023-2028 (%)
- 7.4 Wet-battery electric wheelchairs - Market size and forecast 2023-2028
- Chart on Wet-battery electric wheelchairs - Market size and forecast 2023-2028 ($ million)
- Data Table on Wet-battery electric wheelchairs - Market size and forecast 2023-2028 ($ million)
- Chart on Wet-battery electric wheelchairs - Year-over-year growth 2023-2028 (%)
- Data Table on Wet-battery electric wheelchairs - Year-over-year growth 2023-2028 (%)
- 7.5 Market opportunity by Product
- Market opportunity by Product ($ million)
- Data Table on Market opportunity by Product ($ million)
8 Customer Landscape
- 8.1 Customer landscape overview
- Analysis of price sensitivity, lifecycle, customer purchase basket, adoption rates, and purchase criteria
9 Geographic Landscape
- 9.1 Geographic segmentation
- Chart on Market share By Geographical Landscape 2023-2028 (%)
- Data Table on Market share By Geographical Landscape 2023-2028 (%)
- 9.2 Geographic comparison
- Chart on Geographic comparison
- Data Table on Geographic comparison
- 9.3 North America - Market size and forecast 2023-2028
- Chart on North America - Market size and forecast 2023-2028 ($ million)
- Data Table on North America - Market size and forecast 2023-2028 ($ million)
- Chart on North America - Year-over-year growth 2023-2028 (%)
- Data Table on North America - Year-over-year growth 2023-2028 (%)
- 9.4 Europe - Market size and forecast 2023-2028
- Chart on Europe - Market size and forecast 2023-2028 ($ million)
- Data Table on Europe - Market size and forecast 2023-2028 ($ million)
- Chart on Europe - Year-over-year growth 2023-2028 (%)
- Data Table on Europe - Year-over-year growth 2023-2028 (%)
- 9.5 Asia - Market size and forecast 2023-2028
- Chart on Asia - Market size and forecast 2023-2028 ($ million)
- Data Table on Asia - Market size and forecast 2023-2028 ($ million)
- Chart on Asia - Year-over-year growth 2023-2028 (%)
- Data Table on Asia - Year-over-year growth 2023-2028 (%)
- 9.6 Rest of World (ROW) - Market size and forecast 2023-2028
- Chart on Rest of World (ROW) - Market size and forecast 2023-2028 ($ million)
- Data Table on Rest of World (ROW) - Market size and forecast 2023-2028 ($ million)
- Chart on Rest of World (ROW) - Year-over-year growth 2023-2028 (%)
- Data Table on Rest of World (ROW) - Year-over-year growth 2023-2028 (%)
- 9.7 US - Market size and forecast 2023-2028
- Chart on US - Market size and forecast 2023-2028 ($ million)
- Data Table on US - Market size and forecast 2023-2028 ($ million)
- Chart on US - Year-over-year growth 2023-2028 (%)
- Data Table on US - Year-over-year growth 2023-2028 (%)
- 9.8 Germany - Market size and forecast 2023-2028
- Chart on Germany - Market size and forecast 2023-2028 ($ million)
- Data Table on Germany - Market size and forecast 2023-2028 ($ million)
- Chart on Germany - Year-over-year growth 2023-2028 (%)
- Data Table on Germany - Year-over-year growth 2023-2028 (%)
- 9.9 Canada - Market size and forecast 2023-2028
- Chart on Canada - Market size and forecast 2023-2028 ($ million)
- Data Table on Canada - Market size and forecast 2023-2028 ($ million)
- Chart on Canada - Year-over-year growth 2023-2028 (%)
- Data Table on Canada - Year-over-year growth 2023-2028 (%)
- 9.10 France - Market size and forecast 2023-2028
- Chart on France - Market size and forecast 2023-2028 ($ million)
- Data Table on France - Market size and forecast 2023-2028 ($ million)
- Chart on France - Year-over-year growth 2023-2028 (%)
- Data Table on France - Year-over-year growth 2023-2028 (%)
- 9.11 Japan - Market size and forecast 2023-2028
- Chart on Japan - Market size and forecast 2023-2028 ($ million)
- Data Table on Japan - Market size and forecast 2023-2028 ($ million)
- Chart on Japan - Year-over-year growth 2023-2028 (%)
- Data Table on Japan - Year-over-year growth 2023-2028 (%)
- 9.12 Market opportunity By Geographical Landscape
- Market opportunity By Geographical Landscape ($ million)
- Data Tables on Market opportunity By Geographical Landscape ($ million)
10 Drivers, Challenges, and Opportunity/Restraints
- 10.1 Market drivers
- 10.2 Market challenges
- 10.3 Impact of drivers and challenges
- Impact of drivers and challenges in 2023 and 2028
- 10.4 Market opportunities/restraints
11 Competitive Landscape
- 11.1 Overview
- 11.2 Competitive Landscape
- Overview on criticality of inputs and factors of differentiation
- 11.3 Landscape disruption
- Overview on factors of disruption
- 11.4 Industry risks
- Impact of key risks on business
12 Competitive Analysis
- 12.1 Companies profiled
- Companies covered
- 12.2 Market positioning of companies
- Matrix on companies position and classification
- 12.3 ComfyGO Inc.
- ComfyGO Inc. - Overview
- ComfyGO Inc. - Product / Service
- ComfyGO Inc. - Key offerings
- 12.4 GF Health Products Inc.
- GF Health Products Inc. - Overview
- GF Health Products Inc. - Product / Service
- GF Health Products Inc. - Key offerings
- 12.5 Hoveround Corp.
- Hoveround Corp. - Overview
- Hoveround Corp. - Product / Service
- Hoveround Corp. - Key offerings
- 12.6 Invacare Corp.
- Invacare Corp. - Overview
- Invacare Corp. - Business segments
- Invacare Corp. - Key news
- Invacare Corp. - Key offerings
- Invacare Corp. - Segment focus
- 12.7 Karma Medical Products Co. Ltd.
- Karma Medical Products Co. Ltd. - Overview
- Karma Medical Products Co. Ltd. - Product / Service
- Karma Medical Products Co. Ltd. - Key offerings
- 12.8 LEVO AG
- LEVO AG - Overview
- LEVO AG - Product / Service
- LEVO AG - Key offerings
- 12.9 Matsunaga Manufactory Co. Ltd.
- Matsunaga Manufactory Co. Ltd. - Overview
- Matsunaga Manufactory Co. Ltd. - Product / Service
- Matsunaga Manufactory Co. Ltd. - Key offerings
- 12.10 Medical Depot Inc.
- Medical Depot Inc. - Overview
- Medical Depot Inc. - Product / Service
- Medical Depot Inc. - Key offerings
- 12.11 Medical Device Depot Inc.
- Medical Device Depot Inc. - Overview
- Medical Device Depot Inc. - Product / Service
- Medical Device Depot Inc. - Key offerings
- 12.12 MEYRA GROUP
- MEYRA GROUP - Overview
- MEYRA GROUP - Product / Service
- MEYRA GROUP - Key offerings
- 12.13 Ottobock SE and Co. KGaA
- Ottobock SE and Co. KGaA - Overview
- Ottobock SE and Co. KGaA - Product / Service
- Ottobock SE and Co. KGaA - Key offerings
- 12.14 Permobil AB
- Permobil AB - Overview
- Permobil AB - Product / Service
- Permobil AB - Key news
- Permobil AB - Key offerings
- 12.15 Pride Mobility Products Corp.
- Pride Mobility Products Corp. - Overview
- Pride Mobility Products Corp. - Product / Service
- Pride Mobility Products Corp. - Key offerings
- 12.16 Roma Medical
- Roma Medical - Overview
- Roma Medical - Product / Service
- Roma Medical - Key offerings
- 12.17 Sunrise Medical LLC
- Sunrise Medical LLC - Overview
- Sunrise Medical LLC - Product / Service
- Sunrise Medical LLC - Key offerings
13 Appendix
- 13.1 Scope of the report
- 13.2 Inclusions and exclusions checklist
- Inclusions checklist
- Exclusions checklist
- 13.3 Currency conversion rates for US$
- Currency conversion rates for US$
- 13.4 Research methodology
- Research methodology
- 13.5 Data procurement
- Information sources
- 13.6 Data validation
- Data validation
- 13.7 Validation techniques employed for market sizing
- Validation techniques employed for market sizing
- 13.8 Data synthesis
- Data synthesis
- 13.9 360 degree market analysis
- 360 degree market analysis
- 13.10 List of abbreviations
- List of abbreviations
