|
|
市場調査レポート
商品コード
1908344
乗用車用電動クーラントポンプの世界市場、2026年~2030年Global Electric Coolant Pump For Passenger Cars Market 2026-2030 |
||||||

|
|||||||
カスタマイズ可能
|
|||||||

| 乗用車用電動クーラントポンプの世界市場、2026年~2030年 |
|
出版日: 2026年01月14日
発行: TechNavio
ページ情報: 英文 295 Pages
納期: 即納可能
|

概要
世界の乗用車用電動クーラントポンプ市場は、2025年から2030年の間に451億9,570万米ドルの成長が見込まれ、予測期間中のCAGRは23.8%と予測されています。
本レポートでは、世界の乗用車用電動クーラントポンプ市場に関する包括的な分析、市場規模と予測、動向、成長要因、課題に加え、約25社のベンダー分析を提供しています。
本レポートは、現在の市場状況、最新の動向と促進要因、市場環境全般に関する最新の分析を提供します。市場は、機械部品の急速な電動化、電気自動車(EV)の普及拡大、電動クーラントポンプの信頼性および耐久性の向上によって牽引されています。
本調査は、業界の主要関係者からの情報を含む一次情報と二次情報を客観的に組み合わせて実施されました。本レポートには、主要企業の分析に加え、包括的な市場規模データ、地域別分析を伴うセグメント、ベンダー情勢が含まれています。レポートには過去データと予測データが掲載されています。
| 市場範囲 | |
|---|---|
| 基準年 | 2026年 |
| 終了年 | 2030年 |
| 予測期間 | 2026年~2030年 |
| 成長モメンタム | 加速 |
| 前年比2026年 | 19.7% |
| CAGR | 23.8% |
| 増分額 | 451億9,570万米ドル |
本調査では、今後数年間における乗用車用電動クーラントポンプの世界市場成長を牽引する主要な要因の一つとして、自動車用電動ポンプシステムの改良が挙げられます。また、熱管理システムとの統合の進展や、自動車用ポンプにおける先進材料の採用が、市場における相当な需要創出につながると見込まれます。
目次
第1章 エグゼクティブサマリー
第2章 Technavio分析
- 価格反応性・ライフサイクル・顧客購入バスケット・採用率・購入基準の分析
- インプットの重要性と差別化の要因
- 混乱の要因
- 促進要因と課題の影響
第3章 市場情勢
- 市場エコシステム
- 市場の特徴
- バリューチェーン分析
第4章 市場規模
- 市場の定義
- 市場セグメント分析
- 市場規模、2025年
- 市場の見通し、2025年~2030年
第5章 市場規模実績
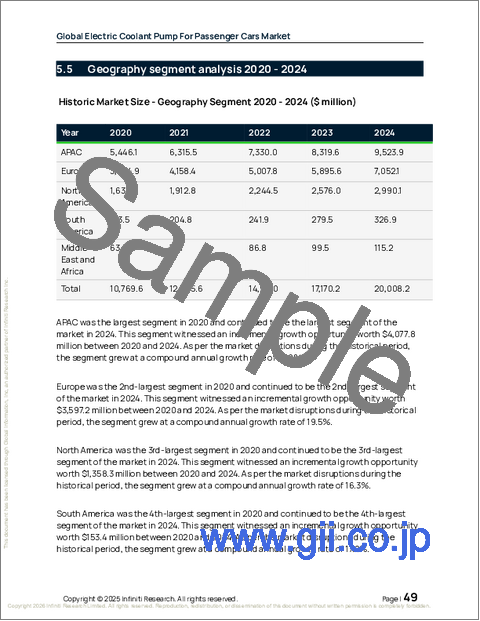
- 乗用車用電動クーラントポンプの世界市場、2020年~2024年
- 用途別セグメント分析、2020年~2024年
- タイプセグメント分析、2020年~2024年
- 流通チャネルセグメント分析、2020年~2024年
- 地域別セグメント分析、2020年~2024年
- 国別セグメント分析、2020年~2024年
第6章 定性分析
- AIの影響:乗用車用電動クーラントポンプの世界市場
第7章 ファイブフォース分析
- ファイブフォースの要約
- 買い手の交渉力
- 供給企業の交渉力
- 新規参入業者の脅威
- 代替品の脅威
- 競争の脅威
- 市況
第8章 市場セグメンテーション:用途別
- 比較:用途別
- 内燃機関(ICE)パワートレイン
- ハイブリッド・電気パワートレイン
- 市場機会:用途別
第9章 市場セグメンテーション:タイプ別
- 比較:タイプ別
- バッテリー式電気自動車
- プラグインハイブリッド電気自動車
- ハイブリッド電気自動車
- 市場機会:タイプ別
第10章 市場セグメンテーション:流通チャネル別
- 比較:流通チャネル別
- OEMメーカー
- アフターマーケット
- 市場機会:流通チャネル別
第11章 顧客情勢
第12章 地域別情勢
- 地域別セグメンテーション
- 地域別比較
- アジア太平洋地域
- 中国
- 日本
- インド
- 韓国
- オーストラリア
- インドネシア
- 欧州
- ドイツ
- イギリス
- フランス
- イタリア
- スペイン
- オランダ
- 北米
- 米国
- カナダ
- メキシコ
- 南米
- ブラジル
- アルゼンチン
- コロンビア
- 中東・アフリカ
- 南アフリカ
- UAE
- サウジアラビア
- イスラエル
- トルコ
- 市場機会:地域別
第13章 促進要因、課題、機会
- 市場促進要因
- 市場の課題
- 促進要因と課題の影響
- 市場機会
第14章 競合情勢
- 概要
- 競合情勢
- 混乱の状況
- 業界のリスク
第15章 競合分析
- 企業プロファイル
- 企業ランキング指標
- 企業の市場ポジショニング
- AISIN Corp.
- Buhler Motor GmbH
- Continental AG
- Gates Corp.
- GMB CORP.
- Hanon Systems
- Johnson Electric Holdings Ltd.
- MAHLE GmbH
- Mikuni Corp.
- Nidec Corp.
- Rheinmetall AG
- Robert Bosch GmbH
- Sogefi Spa
- TI Fluid Systems Plc
- Valeo SA

