|
|
市場調査レポート
商品コード
1908902
火災試験の世界市場、2026年~2030年Global Fire Testing Market 2026-2030 |
||||||
|
|||||||
カスタマイズ可能
|
|||||||

| 火災試験の世界市場、2026年~2030年 |
|
出版日: 2026年01月14日
発行: TechNavio
ページ情報: 英文 299 Pages
納期: 即納可能
|

概要
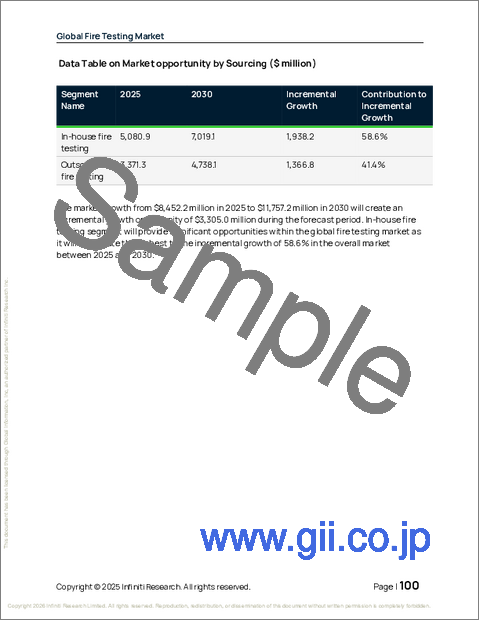
世界の火災試験市場は、2025年から2030年の間に33億500万米ドルの成長が見込まれ、予測期間中のCAGRは6.8%と予測されています。
本報告書では、世界の火災試験市場に関する包括的な分析、市場規模と予測、動向、成長要因、課題に加え、約25社のベンダー分析を提供しています。
本レポートは、現在の市場状況、最新の動向と促進要因、市場環境全般に関する最新の分析を提供します。市場は、世界の防火安全要件の強化、エネルギー貯蔵や高性能材料用途における新たな危険性の出現、防火安全分析における予測シミュレーションの技術統合によって牽引されています。
本調査は、業界の主要関係者からの情報を含む、一次情報と二次情報の客観的な組み合わせを用いて実施されました。本レポートには、主要企業の分析に加え、包括的な市場規模データ、地域別分析を伴うセグメント、ベンダー情勢が含まれています。レポートには過去データと予測データが掲載されています。
| 市場範囲 | |
|---|---|
| 基準年 | 2026年 |
| 対象期間 | 2030年 |
| 予測期間 | 2026年~2030年 |
| 成長モメンタム | 加速 |
| 前年比2026年 | 6.5% |
| CAGR | 6.8% |
| 増分額 | 33億500万米ドル |
本調査では、デジタルツイン技術と高度な計算流体力学の統合が、今後数年間における世界の火災試験市場成長を牽引する主要な要因の一つであると特定しています。また、持続可能な消火剤や環境に配慮した試験プロトコルへの移行、ならびに電気自動車インフラ向けの安全基準と試験の強化が、市場において相当な需要を生み出すものと見込まれます。
目次
第1章 エグゼクティブサマリー
第2章 Technavio分析
- 価格反応性・ライフサイクル・顧客購入バスケット・採用率・購入基準の分析
- インプットの重要性と差別化の要因
- 混乱の要因
- 促進要因と課題の影響
第3章 市場情勢
- 市場エコシステム
- 市場の特徴
- バリューチェーン分析
第4章 市場規模
- 市場の定義
- 市場セグメント分析
- 市場規模、2025年
- 市場の見通し、2025年~2030年
第5章 市場規模実績
- 世界の火災試験市場、2020年~2024年
- サービスタイプセグメント分析、2020年~2024年
- 調達セグメント分析、2020年~2024年
- エンドユーザーセグメント分析、2020年~2024年
- 地域別セグメント分析、2020年~2024年
- 国別セグメント分析、2020年~2024年
第6章 定性分析
- AIの影響:世界の火災試験市場
第7章 ファイブフォース分析
- ファイブフォースの要約
- 買い手の交渉力
- 供給企業の交渉力
- 新規参入業者の脅威
- 代替品の脅威
- 競争の脅威
- 市況
第8章 市場セグメンテーション:サービスタイプ別
- 比較:サービスタイプ別
- 試験
- 検査
- 認証
- 市場機会:サービスタイプ別
第9章 市場セグメンテーション:調達方法別
- 比較:調達方法別
- 社内での火災試験
- 外部委託での火災試験
- 市場機会:調達方法別
第10章 市場セグメンテーション:エンドユーザー別
- 比較:エンドユーザー別
- 建設・インフラ
- 自動車
- 航空宇宙・防衛
- 消費財・小売業
- その他
- 市場機会:エンドユーザー別
第11章 顧客情勢
第12章 地域別情勢
- 地域別セグメンテーション
- 地域別比較
- アジア太平洋地域
- 中国
- 日本
- インド
- 韓国
- オーストラリア
- インドネシア
- 欧州
- ドイツ
- イギリス
- フランス
- イタリア
- スペイン
- オランダ
- 北米
- 米国
- カナダ
- メキシコ
- 南米
- ブラジル
- アルゼンチン
- チリ
- 中東・アフリカ
- サウジアラビア
- UAE
- 南アフリカ
- トルコ
- エジプト
- 市場機会:地域別
第13章 促進要因、課題、機会
- 市場促進要因
- 市場の課題
- 促進要因と課題の影響
- 市場機会
第14章 競合情勢
- 概要
- 競合情勢
- 混乱の状況
- 業界のリスク
第15章 競合分析
- 企業プロファイル
- 企業ランキング指標
- 企業の市場ポジショニング
- Applus Servicios Tech S.L
- Bureau Veritas SA
- DEKRA SE
- Element Materials Tech.
- Eurofins Scientific SE
- Exponent Inc.
- Factory Mutual Insu Co.
- Intertek Group Plc
- QIMA Ltd.
- SGS SA
- The Smithers Group Inc.
- TUV NORD AG
- TUV Rheinland Group
- TUV SUD AG
- UL LLC

