|
|
市場調査レポート
商品コード
1908275
スマートワークプレイスの世界市場、2026年~2030年Global Smart Workplace Market 2026-2030 |
||||||
|
|||||||
カスタマイズ可能
|
|||||||

| スマートワークプレイスの世界市場、2026年~2030年 |
|
出版日: 2026年01月14日
発行: TechNavio
ページ情報: 英文 296 Pages
納期: 即納可能
|

概要
世界のスマートワークプレイス市場は、2025年から2030年にかけて594億7,560万米ドルの成長が見込まれ、予測期間中のCAGRは16.1%と予測されています。
本報告書では、世界のスマートワークプレイス市場に関する包括的な分析、市場規模と予測、動向、成長要因、課題に加え、約25社のベンダー分析を提供しています。
本レポートは、現在の市場状況、最新の市場動向と促進要因、市場環境全般に関する最新の分析を提供します。市場の成長は、業務効率とエネルギー効率の必要性、進化する労働力ニーズと従業員体験への戦略的焦点、基盤技術の急速な進歩と普及の進展によって牽引されています。
本調査は、業界の主要関係者からの情報を含む一次情報と二次情報を客観的に組み合わせて実施されました。本レポートには、主要企業の分析に加え、包括的な市場規模データ、地域別分析を伴うセグメント、ベンダー情勢が含まれています。レポートには過去データと予測データが記載されています。
| 市場範囲 | |
|---|---|
| 基準年 | 2026年 |
| 終了年 | 2030年 |
| 予測期間 | 2026年~2030年 |
| 成長モメンタム | 加速 |
| 前年比2026年 | 14.5% |
| CAGR | 16.1% |
| 増分額 | 594億7,560万米ドル |
本調査では、今後数年間における世界のスマートワークプレイス市場の成長を牽引する主要な要因の一つとして、予測型職場管理のためのデジタルツインの出現を挙げています。また、職場体験の高度なパーソナライゼーションと、職場運営および分析への生成AIの導入が、市場において相当な需要を生み出すものと見込まれます。
目次
第1章 エグゼクティブサマリー
第2章 Technavio分析
- 価格反応性・ライフサイクル・顧客購入バスケット・採用率・購入基準の分析
- インプットの重要性と差別化の要因
- 混乱の要因
- 促進要因と課題の影響
第3章 市場情勢
- 市場エコシステム
- 市場の特徴
- バリューチェーン分析
第4章 市場規模
- 市場の定義
- 市場セグメント分析
- 市場規模、2025年
- 市場の見通し、2025年~2030年
第5章 市場規模実績
- 世界のスマートワークプレイス市場、2020年~2024年
- タイプセグメント分析、2020年~2024年
- 部品セグメント分析、2020年~2024年
- エンドユーザーセグメント分析、2020年~2024年
- 地域別セグメント分析、2020年~2024年
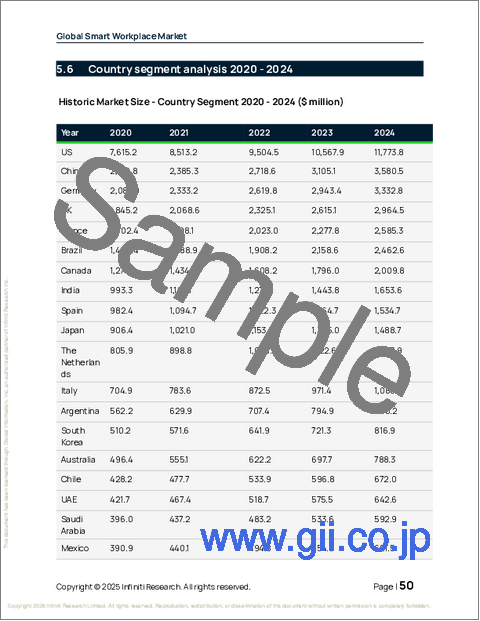
- 国別セグメント分析、2020年~2024年
第6章 定性分析
- AIの影響:世界のスマートワークプレイス市場
第7章 ファイブフォース分析
- ファイブフォースの要約
- 買い手の交渉力
- 供給企業の交渉力
- 新規参入業者の脅威
- 代替品の脅威
- 競争の脅威
- 市況
第8章 市場セグメンテーション:タイプ別
- 比較:タイプ別
- 新築建物
- 改修工事
- 市場機会:タイプ別
第9章 市場セグメンテーション:コンポーネント別
- 比較:コンポーネント別
- ソリューション
- サービス
- 市場機会:コンポーネント別
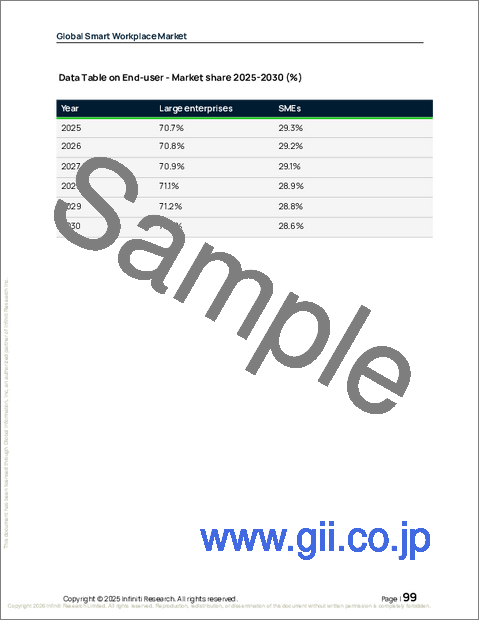
第10章 市場セグメンテーション:エンドユーザー別
- 比較:エンドユーザー別
- 大企業
- 中小企業
- 市場機会:エンドユーザー別
第11章 顧客情勢
- 顧客情勢の概要
第12章 地域別情勢
- 地域別セグメンテーション
- 地域別比較
- 欧州
- ドイツ
- イギリス
- フランス
- スペイン
- オランダ
- イタリア
- 北米
- 米国
- カナダ
- メキシコ
- アジア太平洋地域
- 中国
- インド
- 日本
- 韓国
- オーストラリア
- インドネシア
- 南米
- ブラジル
- アルゼンチン
- チリ
- 中東・アフリカ
- UAE
- サウジアラビア
- イスラエル
- 南アフリカ
- トルコ
- 市場機会:地域別
第13章 促進要因、課題、機会
- 市場促進要因
- 市場の課題
- 促進要因と課題の影響
- 市場機会
第14章 競合情勢
- 概要
- 競合情勢
- 混乱の状況
- 業界のリスク
第15章 競合分析
- 企業プロファイル
- 企業ランキング指標
- 企業の市場ポジショニング
- ABB Ltd.
- Atos SE
- Cisco Systems Inc.
- Coor Service Management
- Crestron Electronics Inc.
- Honeywell International Inc.
- iOFFICE LP
- Johnson Controls International
- Legrand SA
- Planon Group
- Robert Bosch GmbH
- Schneider Electric SE
- Siemens AG
- Signify NV
- Verizon Communications Inc.

