|
|
市場調査レポート
商品コード
1581956
外来輸液センターの世界市場、2024~2028年Global Ambulatory Infusion Center Market 2024-2028 |
||||||
|
|||||||
カスタマイズ可能
|
|||||||

| 外来輸液センターの世界市場、2024~2028年 |
|
出版日: 2024年10月19日
発行: TechNavio
ページ情報: 英文 207 Pages
納期: 即納可能
|

全表示
- 概要
- 図表
- 目次
外来輸液センター市場、2024~2028年
外来輸液センター市場は2023~2028年に146億8,800万米ドル、予測期間中のCAGRは5.6%で成長すると予測されます。当レポートでは、外来輸液センター市場の全体的な分析、市場規模・予測、動向、成長促進要因、課題、約25のベンダーを網羅したベンダー分析などを掲載しています。
現在の市場シナリオ、最新動向と促進要因、市場環境全体に関する最新分析を提供しています。市場は、投資の増加、サービス品質を促進する優秀性の認定と認識、がんと慢性疾患の有病率の上昇によって牽引されています。
| 市場範囲 | |
|---|---|
| 基準年 | 2024年 |
| 終了年 | 2028年 |
| 予測期間 | 2024~2028年 |
| 成長モメンタム | 加速 |
| 前年比[2024年] | 5% |
| CAGR | 5.6% |
| 増分額 | 146億8,800万米ドル |
本調査では、今後数年間の外来輸液センター市場の成長を促進する主要要因の1つとして、パートナーシップと買収を挙げています。また、外来輸液センター業界の立ち上げや専門薬局サービスの拡大は、市場の大きな需要につながります。
目次
第1章 エグゼクティブサマリー
- 市場概要
第2章 Technavio分析
- 価格・ライフサイクル・顧客購入バスケット・採用率・購入基準の分析
- インプットの重要性と差別化の要因
- 混乱の要因
- 促進要因と課題の影響
第3章 市場情勢
- 市場エコシステム
- 市場の特徴
- バリューチェーン分析
第4章 市場規模の評価
- 市場の定義
- 市場セグメント分析
- 市場規模 2023年
- 市場の展望 2023~2028年
第5章 市場規模実績
- 外来輸液センターの世界市場 2018~2022年
- タイプ別セグメント分析 2018~2022年
- 適応症セグメント分析 2018~2022年
- 地域別セグメント分析 2018~2022年
- 国別セグメント分析 2018~2022年
第6章 定性分析
- AIの影響-外来輸液センターの世界市場
第7章 ファイブフォース分析
- ファイブフォースの要約
- 買い手の交渉力
- 供給企業の交渉力
- 新規参入業者の脅威
- 代替品の脅威
- 競争の脅威
- 市況
第8章 市場セグメンテーション:タイプ別
- 市場セグメンテーション
- 比較:タイプ別
- 独立系センター:市場規模と予測 2023~2028年
- 病院:市場規模と予測 2023~2028年
- 在宅医療:市場規模と予測 2023~2028年
- タイプ別の市場機会
第9章 市場セグメンテーション:適応症別
- 市場セグメンテーション
- 比較:適応症別
- 腫瘍:市場規模と予測 2023~2028年
- 自己免疫疾患:市場規模と予測 2023~2028年
- 感染症:市場規模と予測 2023~2028年
- 神経疾患:市場規模と予測 2023~2028年
- 慢性疼痛:市場規模と予測 2023~2028年
- 適応症別の市場機会
第10章 顧客情勢
- 顧客情勢概要
第11章 地域別情勢
- 地域別セグメンテーション
- 比較:地域別
- 北米:市場規模と予測 2023~2028年
- 欧州:市場規模と予測 2023~2028年
- アジア:市場規模と予測 2023~2028年
- その他:市場規模と予測 2023~2028年
- 米国:市場規模と予測 2023~2028年
- 英国:市場規模と予測 2023~2028年
- 中国:市場規模と予測 2023~2028年
- ドイツ:市場規模と予測 2023~2028年
- 日本:市場規模と予測 2023~2028年
- フランス:市場規模と予測 2023~2028年
- スペイン:市場規模と予測 2023~2028年
- 韓国:市場規模と予測 2023~2028年
- カナダ:市場規模と予測 2023~2028年
- インド:市場規模と予測 2023~2028年
- 地域情勢別の市場機会
第12章 促進要因・課題・機会・抑制要因
- 市場促進要因
- 市場課題
- 促進要因と課題の影響
- 市場機会・抑制要因
第13章 競合情勢
- 概要
- 競合情勢
- 混乱の状況
- 業界のリスク
第14章 競合分析
- 企業プロファイル
- 企業ランキング指数
- 企業の市場ポジショニング
- Ameripharma Infusion Center
- Arnot Health
- Carson Tahoe Health
- ChristianaCare
- Coram llc
- Haywood Regional Medical Center
- Horizon Infusions
- Icahn School of Medicine at Mount Sinai
- Novant Health
- Palmetto Infusion
- Premier Point
- Stoughton Health
- Swedish Health Services
- United Health Group Inc.
- Valley Health System
第15章 付録
Exhibits:
- Exhibits1: Executive Summary - Chart on Market Overview
- Exhibits2: Executive Summary - Data Table on Market Overview
- Exhibits3: Executive Summary - Chart on Global Market Characteristics
- Exhibits4: Executive Summary - Chart on Market By Geographical Landscape
- Exhibits5: Executive Summary - Chart on Market Segmentation by Type
- Exhibits6: Executive Summary - Chart on Market Segmentation by Indication
- Exhibits7: Executive Summary - Chart on Incremental Growth
- Exhibits8: Executive Summary - Data Table on Incremental Growth
- Exhibits9: Executive Summary - Chart on Company Market Positioning
- Exhibits10: Analysis of price sensitivity, lifecycle, customer purchase basket, adoption rates, and purchase criteria
- Exhibits11: Overview on criticality of inputs and factors of differentiation
- Exhibits12: Overview on factors of disruption
- Exhibits13: Impact of drivers and challenges in 2023 and 2028
- Exhibits14: Parent Market
- Exhibits15: Data Table on - Parent Market
- Exhibits16: Market characteristics analysis
- Exhibits17: Value Chain Analysis
- Exhibits18: Offerings of companies included in the market definition
- Exhibits19: Market segments
- Exhibits20: Chart on Global - Market size and forecast 2023-2028 ($ million)
- Exhibits21: Data Table on Global - Market size and forecast 2023-2028 ($ million)
- Exhibits22: Chart on Global Market: Year-over-year growth 2023-2028 (%)
- Exhibits23: Data Table on Global Market: Year-over-year growth 2023-2028 (%)
- Exhibits24: Historic Market Size - Data Table on Global Ambulatory Infusion Center Market 2018 - 2022 ($ million)
- Exhibits25: Historic Market Size - Type Segment 2018 - 2022 ($ million)
- Exhibits26: Historic Market Size - Indication Segment 2018 - 2022 ($ million)
- Exhibits27: Historic Market Size - Geography Segment 2018 - 2022 ($ million)
- Exhibits28: Historic Market Size - Country Segment 2018 - 2022 ($ million)
- Exhibits29: Five forces analysis - Comparison between 2023 and 2028
- Exhibits30: Bargaining power of buyers - Impact of key factors 2023 and 2028
- Exhibits31: Bargaining power of suppliers - Impact of key factors in 2023 and 2028
- Exhibits32: Threat of new entrants - Impact of key factors in 2023 and 2028
- Exhibits33: Threat of substitutes - Impact of key factors in 2023 and 2028
- Exhibits34: Threat of rivalry - Impact of key factors in 2023 and 2028
- Exhibits35: Chart on Market condition - Five forces 2023 and 2028
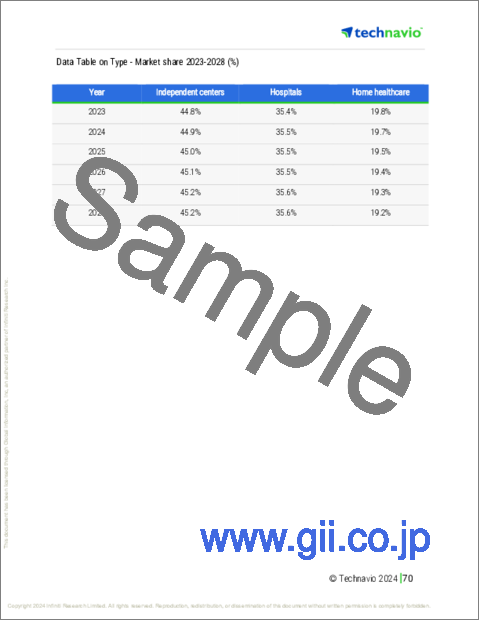
- Exhibits36: Chart on Type - Market share 2023-2028 (%)
- Exhibits37: Data Table on Type - Market share 2023-2028 (%)
- Exhibits38: Chart on Comparison by Type
- Exhibits39: Data Table on Comparison by Type
- Exhibits40: Chart on Independent centers - Market size and forecast 2023-2028 ($ million)
- Exhibits41: Data Table on Independent centers - Market size and forecast 2023-2028 ($ million)
- Exhibits42: Chart on Independent centers - Year-over-year growth 2023-2028 (%)
- Exhibits43: Data Table on Independent centers - Year-over-year growth 2023-2028 (%)
- Exhibits44: Chart on Hospitals - Market size and forecast 2023-2028 ($ million)
- Exhibits45: Data Table on Hospitals - Market size and forecast 2023-2028 ($ million)
- Exhibits46: Chart on Hospitals - Year-over-year growth 2023-2028 (%)
- Exhibits47: Data Table on Hospitals - Year-over-year growth 2023-2028 (%)
- Exhibits48: Chart on Home healthcare - Market size and forecast 2023-2028 ($ million)
- Exhibits49: Data Table on Home healthcare - Market size and forecast 2023-2028 ($ million)
- Exhibits50: Chart on Home healthcare - Year-over-year growth 2023-2028 (%)
- Exhibits51: Data Table on Home healthcare - Year-over-year growth 2023-2028 (%)
- Exhibits52: Market opportunity by Type ($ million)
- Exhibits53: Data Table on Market opportunity by Type ($ million)
- Exhibits54: Chart on Indication - Market share 2023-2028 (%)
- Exhibits55: Data Table on Indication - Market share 2023-2028 (%)
- Exhibits56: Chart on Comparison by Indication
- Exhibits57: Data Table on Comparison by Indication
- Exhibits58: Chart on Oncology - Market size and forecast 2023-2028 ($ million)
- Exhibits59: Data Table on Oncology - Market size and forecast 2023-2028 ($ million)
- Exhibits60: Chart on Oncology - Year-over-year growth 2023-2028 (%)
- Exhibits61: Data Table on Oncology - Year-over-year growth 2023-2028 (%)
- Exhibits62: Chart on Autoimmune disorders - Market size and forecast 2023-2028 ($ million)
- Exhibits63: Data Table on Autoimmune disorders - Market size and forecast 2023-2028 ($ million)
- Exhibits64: Chart on Autoimmune disorders - Year-over-year growth 2023-2028 (%)
- Exhibits65: Data Table on Autoimmune disorders - Year-over-year growth 2023-2028 (%)
- Exhibits66: Chart on Infectious diseases - Market size and forecast 2023-2028 ($ million)
- Exhibits67: Data Table on Infectious diseases - Market size and forecast 2023-2028 ($ million)
- Exhibits68: Chart on Infectious diseases - Year-over-year growth 2023-2028 (%)
- Exhibits69: Data Table on Infectious diseases - Year-over-year growth 2023-2028 (%)
- Exhibits70: Chart on Neurological disorders - Market size and forecast 2023-2028 ($ million)
- Exhibits71: Data Table on Neurological disorders - Market size and forecast 2023-2028 ($ million)
- Exhibits72: Chart on Neurological disorders - Year-over-year growth 2023-2028 (%)
- Exhibits73: Data Table on Neurological disorders - Year-over-year growth 2023-2028 (%)
- Exhibits74: Chart on Chronic pain conditions - Market size and forecast 2023-2028 ($ million)
- Exhibits75: Data Table on Chronic pain conditions - Market size and forecast 2023-2028 ($ million)
- Exhibits76: Chart on Chronic pain conditions - Year-over-year growth 2023-2028 (%)
- Exhibits77: Data Table on Chronic pain conditions - Year-over-year growth 2023-2028 (%)
- Exhibits78: Market opportunity by Indication ($ million)
- Exhibits79: Data Table on Market opportunity by Indication ($ million)
- Exhibits80: Analysis of price sensitivity, lifecycle, customer purchase basket, adoption rates, and purchase criteria
- Exhibits81: Chart on Market share By Geographical Landscape 2023-2028 (%)
- Exhibits82: Data Table on Market share By Geographical Landscape 2023-2028 (%)
- Exhibits83: Chart on Geographic comparison
- Exhibits84: Data Table on Geographic comparison
- Exhibits85: Chart on North America - Market size and forecast 2023-2028 ($ million)
- Exhibits86: Data Table on North America - Market size and forecast 2023-2028 ($ million)
- Exhibits87: Chart on North America - Year-over-year growth 2023-2028 (%)
- Exhibits88: Data Table on North America - Year-over-year growth 2023-2028 (%)
- Exhibits89: Chart on Europe - Market size and forecast 2023-2028 ($ million)
- Exhibits90: Data Table on Europe - Market size and forecast 2023-2028 ($ million)
- Exhibits91: Chart on Europe - Year-over-year growth 2023-2028 (%)
- Exhibits92: Data Table on Europe - Year-over-year growth 2023-2028 (%)
- Exhibits93: Chart on Asia - Market size and forecast 2023-2028 ($ million)
- Exhibits94: Data Table on Asia - Market size and forecast 2023-2028 ($ million)
- Exhibits95: Chart on Asia - Year-over-year growth 2023-2028 (%)
- Exhibits96: Data Table on Asia - Year-over-year growth 2023-2028 (%)
- Exhibits97: Chart on Rest of World (ROW) - Market size and forecast 2023-2028 ($ million)
- Exhibits98: Data Table on Rest of World (ROW) - Market size and forecast 2023-2028 ($ million)
- Exhibits99: Chart on Rest of World (ROW) - Year-over-year growth 2023-2028 (%)
- Exhibits100: Data Table on Rest of World (ROW) - Year-over-year growth 2023-2028 (%)
- Exhibits101: Chart on US - Market size and forecast 2023-2028 ($ million)
- Exhibits102: Data Table on US - Market size and forecast 2023-2028 ($ million)
- Exhibits103: Chart on US - Year-over-year growth 2023-2028 (%)
- Exhibits104: Data Table on US - Year-over-year growth 2023-2028 (%)
- Exhibits105: Chart on UK - Market size and forecast 2023-2028 ($ million)
- Exhibits106: Data Table on UK - Market size and forecast 2023-2028 ($ million)
- Exhibits107: Chart on UK - Year-over-year growth 2023-2028 (%)
- Exhibits108: Data Table on UK - Year-over-year growth 2023-2028 (%)
- Exhibits109: Chart on China - Market size and forecast 2023-2028 ($ million)
- Exhibits110: Data Table on China - Market size and forecast 2023-2028 ($ million)
- Exhibits111: Chart on China - Year-over-year growth 2023-2028 (%)
- Exhibits112: Data Table on China - Year-over-year growth 2023-2028 (%)
- Exhibits113: Chart on Germany - Market size and forecast 2023-2028 ($ million)
- Exhibits114: Data Table on Germany - Market size and forecast 2023-2028 ($ million)
- Exhibits115: Chart on Germany - Year-over-year growth 2023-2028 (%)
- Exhibits116: Data Table on Germany - Year-over-year growth 2023-2028 (%)
- Exhibits117: Chart on Japan - Market size and forecast 2023-2028 ($ million)
- Exhibits118: Data Table on Japan - Market size and forecast 2023-2028 ($ million)
- Exhibits119: Chart on Japan - Year-over-year growth 2023-2028 (%)
- Exhibits120: Data Table on Japan - Year-over-year growth 2023-2028 (%)
- Exhibits121: Chart on France - Market size and forecast 2023-2028 ($ million)
- Exhibits122: Data Table on France - Market size and forecast 2023-2028 ($ million)
- Exhibits123: Chart on France - Year-over-year growth 2023-2028 (%)
- Exhibits124: Data Table on France - Year-over-year growth 2023-2028 (%)
- Exhibits125: Chart on Spain - Market size and forecast 2023-2028 ($ million)
- Exhibits126: Data Table on Spain - Market size and forecast 2023-2028 ($ million)
- Exhibits127: Chart on Spain - Year-over-year growth 2023-2028 (%)
- Exhibits128: Data Table on Spain - Year-over-year growth 2023-2028 (%)
- Exhibits129: Chart on South Korea - Market size and forecast 2023-2028 ($ million)
- Exhibits130: Data Table on South Korea - Market size and forecast 2023-2028 ($ million)
- Exhibits131: Chart on South Korea - Year-over-year growth 2023-2028 (%)
- Exhibits132: Data Table on South Korea - Year-over-year growth 2023-2028 (%)
- Exhibits133: Chart on Canada - Market size and forecast 2023-2028 ($ million)
- Exhibits134: Data Table on Canada - Market size and forecast 2023-2028 ($ million)
- Exhibits135: Chart on Canada - Year-over-year growth 2023-2028 (%)
- Exhibits136: Data Table on Canada - Year-over-year growth 2023-2028 (%)
- Exhibits137: Chart on India - Market size and forecast 2023-2028 ($ million)
- Exhibits138: Data Table on India - Market size and forecast 2023-2028 ($ million)
- Exhibits139: Chart on India - Year-over-year growth 2023-2028 (%)
- Exhibits140: Data Table on India - Year-over-year growth 2023-2028 (%)
- Exhibits141: Market opportunity By Geographical Landscape ($ million)
- Exhibits142: Data Tables on Market opportunity By Geographical Landscape ($ million)
- Exhibits143: Impact of drivers and challenges in 2023 and 2028
- Exhibits144: Overview on criticality of inputs and factors of differentiation
- Exhibits145: Overview on factors of disruption
- Exhibits146: Impact of key risks on business
- Exhibits147: Companies covered
- Exhibits148: Company ranking index
- Exhibits149: Matrix on companies position and classification
- Exhibits150: Ameripharma Infusion Center - Overview
- Exhibits151: Ameripharma Infusion Center - Product / Service
- Exhibits152: Ameripharma Infusion Center - Key offerings
- Exhibits153: SWOT
- Exhibits154: Arnot Health - Overview
- Exhibits155: Arnot Health - Product / Service
- Exhibits156: Arnot Health - Key offerings
- Exhibits157: SWOT
- Exhibits158: Carson Tahoe Health - Overview
- Exhibits159: Carson Tahoe Health - Product / Service
- Exhibits160: Carson Tahoe Health - Key offerings
- Exhibits161: SWOT
- Exhibits162: ChristianaCare - Overview
- Exhibits163: ChristianaCare - Product / Service
- Exhibits164: ChristianaCare - Key offerings
- Exhibits165: SWOT
- Exhibits166: Coram llc - Overview
- Exhibits167: Coram llc - Product / Service
- Exhibits168: Coram llc - Key offerings
- Exhibits169: SWOT
- Exhibits170: Haywood Regional Medical Center - Overview
- Exhibits171: Haywood Regional Medical Center - Product / Service
- Exhibits172: Haywood Regional Medical Center - Key offerings
- Exhibits173: SWOT
- Exhibits174: Horizon Infusions - Overview
- Exhibits175: Horizon Infusions - Product / Service
- Exhibits176: Horizon Infusions - Key offerings
- Exhibits177: SWOT
- Exhibits178: Icahn School of Medicine at Mount Sinai - Overview
- Exhibits179: Icahn School of Medicine at Mount Sinai - Product / Service
- Exhibits180: Icahn School of Medicine at Mount Sinai - Key offerings
- Exhibits181: SWOT
- Exhibits182: Novant Health - Overview
- Exhibits183: Novant Health - Product / Service
- Exhibits184: Novant Health - Key offerings
- Exhibits185: SWOT
- Exhibits186: Palmetto Infusion - Overview
- Exhibits187: Palmetto Infusion - Product / Service
- Exhibits188: Palmetto Infusion - Key offerings
- Exhibits189: SWOT
- Exhibits190: Premier Point - Overview
- Exhibits191: Premier Point - Product / Service
- Exhibits192: Premier Point - Key offerings
- Exhibits193: SWOT
- Exhibits194: Stoughton Health - Overview
- Exhibits195: Stoughton Health - Product / Service
- Exhibits196: Stoughton Health - Key offerings
- Exhibits197: SWOT
- Exhibits198: Swedish Health Services - Overview
- Exhibits199: Swedish Health Services - Product / Service
- Exhibits200: Swedish Health Services - Key offerings
- Exhibits201: SWOT
- Exhibits202: United Health Group Inc. - Overview
- Exhibits203: United Health Group Inc. - Business segments
- Exhibits204: United Health Group Inc. - Key offerings
- Exhibits205: United Health Group Inc. - Segment focus
- Exhibits206: SWOT
- Exhibits207: Valley Health System - Overview
- Exhibits208: Valley Health System - Product / Service
- Exhibits209: Valley Health System - Key offerings
- Exhibits210: SWOT
- Exhibits211: Inclusions checklist
- Exhibits212: Exclusions checklist
- Exhibits213: Currency conversion rates for US$
- Exhibits214: Research methodology
- Exhibits215: Information sources
- Exhibits216: Data validation
- Exhibits217: Validation techniques employed for market sizing
- Exhibits218: Data synthesis
- Exhibits219: 360 degree market analysis
- Exhibits220: List of abbreviations
Ambulatory Infusion Center Market 2024-2028
The ambulatory infusion center market is forecasted to grow by USD 14688 mn during 2023-2028, accelerating at a CAGR of 5.6% during the forecast period. The report on the ambulatory infusion center market provides a holistic analysis, market size and forecast, trends, growth drivers, and challenges, as well as vendor analysis covering around 25 vendors.
The report offers an up-to-date analysis regarding the current market scenario, the latest trends and drivers, and the overall market environment. The market is driven by increasing investments, accreditation and recognition of excellence promoting service quality, and rising prevalence of cancer and chronic diseases.
| Market Scope | |
|---|---|
| Base Year | 2024 |
| End Year | 2028 |
| Series Year | 2024-2028 |
| Growth Momentum | Accelerate |
| YOY 2024 | 5% |
| CAGR | 5.6% |
| Incremental Value | $14688 mn |
Technavio's ambulatory infusion center market is segmented as below:
By Type
- Independent centers
- Hospitals
- Home healthcare
By Indication
- Oncology
- Autoimmune disorders
- Infectious diseases
- Neurological disorders
- Chronic pain conditions
By Geographical Landscape
- North America
- Europe
- Asia
- Rest of World (ROW)
This study identifies the partnerships and acquisitions as one of the prime reasons driving the ambulatory infusion center market growth during the next few years. Also, launches in ambulatory infusion center industry and expansion of specialty pharmacy services will lead to sizable demand in the market.
The report on the ambulatory infusion center market covers the following areas:
- Ambulatory Infusion Center Market sizing
- Ambulatory Infusion Center Market forecast
- Ambulatory Infusion Center Market industry analysis
The robust vendor analysis is designed to help clients improve their market position, and in line with this, this report provides a detailed analysis of several leading ambulatory infusion center market vendors that include Ameripharma Infusion Center, Arnot Health, Carson Tahoe Health, ChristianaCare, Coram llc, Haywood Regional Medical Center, Horizon Infusions, Icahn School of Medicine at Mount Sinai, Novant Health, Palmetto Infusion, Premier Point, Stoughton Health, Swedish Health Services, ThrivewellI, United Health Group Inc., and Valley Health System. Also, the ambulatory infusion center market analysis report includes information on upcoming trends and challenges that will influence market growth. This is to help companies strategize and leverage all forthcoming growth opportunities.
The study was conducted using an objective combination of primary and secondary information including inputs from key participants in the industry. The report contains a comprehensive market and vendor landscape in addition to an analysis of the key vendors.
The publisher presents a detailed picture of the market by the way of study, synthesis, and summation of data from multiple sources by an analysis of key parameters such as profit, pricing, competition, and promotions. It presents various market facets by identifying the key industry influencers. The data presented is comprehensive, reliable, and a result of extensive primary and secondary research. The market research reports provide a complete competitive landscape and an in-depth vendor selection methodology and analysis using qualitative and quantitative research to forecast accurate market growth.
Table of Contents
1 Executive Summary
- 1.1 Market overview
- Executive Summary - Chart on Market Overview
- Executive Summary - Data Table on Market Overview
- Executive Summary - Chart on Global Market Characteristics
- Executive Summary - Chart on Market By Geographical Landscape
- Executive Summary - Chart on Market Segmentation by Type
- Executive Summary - Chart on Market Segmentation by Indication
- Executive Summary - Chart on Incremental Growth
- Executive Summary - Data Table on Incremental Growth
- Executive Summary - Chart on Company Market Positioning
2 Technavio Analysis
- 2.1 Analysis of price sensitivity, lifecycle, customer purchase basket, adoption rates, and purchase criteria
- Analysis of price sensitivity, lifecycle, customer purchase basket, adoption rates, and purchase criteria
- 2.2 Criticality of inputs and Factors of differentiation
- Overview on criticality of inputs and factors of differentiation
- 2.3 Factors of disruption
- Overview on factors of disruption
- 2.4 Impact of drivers and challenges
- Impact of drivers and challenges in 2023 and 2028
3 Market Landscape
- 3.1 Market ecosystem
- Parent Market
- Data Table on - Parent Market
- 3.2 Market characteristics
- Market characteristics analysis
- 3.3 Value chain analysis
- Value Chain Analysis
4 Market Sizing
- 4.1 Market definition
- Offerings of companies included in the market definition
- 4.2 Market segment analysis
- Market segments
- 4.3 Market size 2023
- 4.4 Market outlook: Forecast for 2023-2028
- Chart on Global - Market size and forecast 2023-2028 ($ million)
- Data Table on Global - Market size and forecast 2023-2028 ($ million)
- Chart on Global Market: Year-over-year growth 2023-2028 (%)
- Data Table on Global Market: Year-over-year growth 2023-2028 (%)
5 Historic Market Size
- 5.1 Global Ambulatory Infusion Center Market 2018 - 2022
- Historic Market Size - Data Table on Global Ambulatory Infusion Center Market 2018 - 2022 ($ million)
- 5.2 Type segment analysis 2018 - 2022
- Historic Market Size - Type Segment 2018 - 2022 ($ million)
- 5.3 Indication segment analysis 2018 - 2022
- Historic Market Size - Indication Segment 2018 - 2022 ($ million)
- 5.4 Geography segment analysis 2018 - 2022
- Historic Market Size - Geography Segment 2018 - 2022 ($ million)
- 5.5 Country segment analysis 2018 - 2022
- Historic Market Size - Country Segment 2018 - 2022 ($ million)
6 Qualitative Analysis
- 6.1 Impact of AI on the global ambulatory infusion center market
7 Five Forces Analysis
- 7.1 Five forces summary
- Five forces analysis - Comparison between 2023 and 2028
- 7.2 Bargaining power of buyers
- Bargaining power of buyers - Impact of key factors 2023 and 2028
- 7.3 Bargaining power of suppliers
- Bargaining power of suppliers - Impact of key factors in 2023 and 2028
- 7.4 Threat of new entrants
- Threat of new entrants - Impact of key factors in 2023 and 2028
- 7.5 Threat of substitutes
- Threat of substitutes - Impact of key factors in 2023 and 2028
- 7.6 Threat of rivalry
- Threat of rivalry - Impact of key factors in 2023 and 2028
- 7.7 Market condition
- Chart on Market condition - Five forces 2023 and 2028
8 Market Segmentation by Type
- 8.1 Market segments
- Chart on Type - Market share 2023-2028 (%)
- Data Table on Type - Market share 2023-2028 (%)
- 8.2 Comparison by Type
- Chart on Comparison by Type
- Data Table on Comparison by Type
- 8.3 Independent centers - Market size and forecast 2023-2028
- Chart on Independent centers - Market size and forecast 2023-2028 ($ million)
- Data Table on Independent centers - Market size and forecast 2023-2028 ($ million)
- Chart on Independent centers - Year-over-year growth 2023-2028 (%)
- Data Table on Independent centers - Year-over-year growth 2023-2028 (%)
- 8.4 Hospitals - Market size and forecast 2023-2028
- Chart on Hospitals - Market size and forecast 2023-2028 ($ million)
- Data Table on Hospitals - Market size and forecast 2023-2028 ($ million)
- Chart on Hospitals - Year-over-year growth 2023-2028 (%)
- Data Table on Hospitals - Year-over-year growth 2023-2028 (%)
- 8.5 Home healthcare - Market size and forecast 2023-2028
- Chart on Home healthcare - Market size and forecast 2023-2028 ($ million)
- Data Table on Home healthcare - Market size and forecast 2023-2028 ($ million)
- Chart on Home healthcare - Year-over-year growth 2023-2028 (%)
- Data Table on Home healthcare - Year-over-year growth 2023-2028 (%)
- 8.6 Market opportunity by Type
- Market opportunity by Type ($ million)
- Data Table on Market opportunity by Type ($ million)
9 Market Segmentation by Indication
- 9.1 Market segments
- Chart on Indication - Market share 2023-2028 (%)
- Data Table on Indication - Market share 2023-2028 (%)
- 9.2 Comparison by Indication
- Chart on Comparison by Indication
- Data Table on Comparison by Indication
- 9.3 Oncology - Market size and forecast 2023-2028
- Chart on Oncology - Market size and forecast 2023-2028 ($ million)
- Data Table on Oncology - Market size and forecast 2023-2028 ($ million)
- Chart on Oncology - Year-over-year growth 2023-2028 (%)
- Data Table on Oncology - Year-over-year growth 2023-2028 (%)
- 9.4 Autoimmune disorders - Market size and forecast 2023-2028
- Chart on Autoimmune disorders - Market size and forecast 2023-2028 ($ million)
- Data Table on Autoimmune disorders - Market size and forecast 2023-2028 ($ million)
- Chart on Autoimmune disorders - Year-over-year growth 2023-2028 (%)
- Data Table on Autoimmune disorders - Year-over-year growth 2023-2028 (%)
- 9.5 Infectious diseases - Market size and forecast 2023-2028
- Chart on Infectious diseases - Market size and forecast 2023-2028 ($ million)
- Data Table on Infectious diseases - Market size and forecast 2023-2028 ($ million)
- Chart on Infectious diseases - Year-over-year growth 2023-2028 (%)
- Data Table on Infectious diseases - Year-over-year growth 2023-2028 (%)
- 9.6 Neurological disorders - Market size and forecast 2023-2028
- Chart on Neurological disorders - Market size and forecast 2023-2028 ($ million)
- Data Table on Neurological disorders - Market size and forecast 2023-2028 ($ million)
- Chart on Neurological disorders - Year-over-year growth 2023-2028 (%)
- Data Table on Neurological disorders - Year-over-year growth 2023-2028 (%)
- 9.7 Chronic pain conditions - Market size and forecast 2023-2028
- Chart on Chronic pain conditions - Market size and forecast 2023-2028 ($ million)
- Data Table on Chronic pain conditions - Market size and forecast 2023-2028 ($ million)
- Chart on Chronic pain conditions - Year-over-year growth 2023-2028 (%)
- Data Table on Chronic pain conditions - Year-over-year growth 2023-2028 (%)
- 9.8 Market opportunity by Indication
- Market opportunity by Indication ($ million)
- Data Table on Market opportunity by Indication ($ million)
10 Customer Landscape
- 10.1 Customer landscape overview
- Analysis of price sensitivity, lifecycle, customer purchase basket, adoption rates, and purchase criteria
11 Geographic Landscape
- 11.1 Geographic segmentation
- Chart on Market share By Geographical Landscape 2023-2028 (%)
- Data Table on Market share By Geographical Landscape 2023-2028 (%)
- 11.2 Geographic comparison
- Chart on Geographic comparison
- Data Table on Geographic comparison
- 11.3 North America - Market size and forecast 2023-2028
- Chart on North America - Market size and forecast 2023-2028 ($ million)
- Data Table on North America - Market size and forecast 2023-2028 ($ million)
- Chart on North America - Year-over-year growth 2023-2028 (%)
- Data Table on North America - Year-over-year growth 2023-2028 (%)
- 11.4 Europe - Market size and forecast 2023-2028
- Chart on Europe - Market size and forecast 2023-2028 ($ million)
- Data Table on Europe - Market size and forecast 2023-2028 ($ million)
- Chart on Europe - Year-over-year growth 2023-2028 (%)
- Data Table on Europe - Year-over-year growth 2023-2028 (%)
- 11.5 Asia - Market size and forecast 2023-2028
- Chart on Asia - Market size and forecast 2023-2028 ($ million)
- Data Table on Asia - Market size and forecast 2023-2028 ($ million)
- Chart on Asia - Year-over-year growth 2023-2028 (%)
- Data Table on Asia - Year-over-year growth 2023-2028 (%)
- 11.6 Rest of World (ROW) - Market size and forecast 2023-2028
- Chart on Rest of World (ROW) - Market size and forecast 2023-2028 ($ million)
- Data Table on Rest of World (ROW) - Market size and forecast 2023-2028 ($ million)
- Chart on Rest of World (ROW) - Year-over-year growth 2023-2028 (%)
- Data Table on Rest of World (ROW) - Year-over-year growth 2023-2028 (%)
- 11.7 US - Market size and forecast 2023-2028
- Chart on US - Market size and forecast 2023-2028 ($ million)
- Data Table on US - Market size and forecast 2023-2028 ($ million)
- Chart on US - Year-over-year growth 2023-2028 (%)
- Data Table on US - Year-over-year growth 2023-2028 (%)
- 11.8 UK - Market size and forecast 2023-2028
- Chart on UK - Market size and forecast 2023-2028 ($ million)
- Data Table on UK - Market size and forecast 2023-2028 ($ million)
- Chart on UK - Year-over-year growth 2023-2028 (%)
- Data Table on UK - Year-over-year growth 2023-2028 (%)
- 11.9 China - Market size and forecast 2023-2028
- Chart on China - Market size and forecast 2023-2028 ($ million)
- Data Table on China - Market size and forecast 2023-2028 ($ million)
- Chart on China - Year-over-year growth 2023-2028 (%)
- Data Table on China - Year-over-year growth 2023-2028 (%)
- 11.10 Germany - Market size and forecast 2023-2028
- Chart on Germany - Market size and forecast 2023-2028 ($ million)
- Data Table on Germany - Market size and forecast 2023-2028 ($ million)
- Chart on Germany - Year-over-year growth 2023-2028 (%)
- Data Table on Germany - Year-over-year growth 2023-2028 (%)
- 11.11 Japan - Market size and forecast 2023-2028
- Chart on Japan - Market size and forecast 2023-2028 ($ million)
- Data Table on Japan - Market size and forecast 2023-2028 ($ million)
- Chart on Japan - Year-over-year growth 2023-2028 (%)
- Data Table on Japan - Year-over-year growth 2023-2028 (%)
- 11.12 France - Market size and forecast 2023-2028
- Chart on France - Market size and forecast 2023-2028 ($ million)
- Data Table on France - Market size and forecast 2023-2028 ($ million)
- Chart on France - Year-over-year growth 2023-2028 (%)
- Data Table on France - Year-over-year growth 2023-2028 (%)
- 11.13 Spain - Market size and forecast 2023-2028
- Chart on Spain - Market size and forecast 2023-2028 ($ million)
- Data Table on Spain - Market size and forecast 2023-2028 ($ million)
- Chart on Spain - Year-over-year growth 2023-2028 (%)
- Data Table on Spain - Year-over-year growth 2023-2028 (%)
- 11.14 South Korea - Market size and forecast 2023-2028
- Chart on South Korea - Market size and forecast 2023-2028 ($ million)
- Data Table on South Korea - Market size and forecast 2023-2028 ($ million)
- Chart on South Korea - Year-over-year growth 2023-2028 (%)
- Data Table on South Korea - Year-over-year growth 2023-2028 (%)
- 11.15 Canada - Market size and forecast 2023-2028
- Chart on Canada - Market size and forecast 2023-2028 ($ million)
- Data Table on Canada - Market size and forecast 2023-2028 ($ million)
- Chart on Canada - Year-over-year growth 2023-2028 (%)
- Data Table on Canada - Year-over-year growth 2023-2028 (%)
- 11.16 India - Market size and forecast 2023-2028
- Chart on India - Market size and forecast 2023-2028 ($ million)
- Data Table on India - Market size and forecast 2023-2028 ($ million)
- Chart on India - Year-over-year growth 2023-2028 (%)
- Data Table on India - Year-over-year growth 2023-2028 (%)
- 11.17 Market opportunity By Geographical Landscape
- Market opportunity By Geographical Landscape ($ million)
- Data Tables on Market opportunity By Geographical Landscape ($ million)
12 Drivers, Challenges, and Opportunity/Restraints
- 12.1 Market drivers
- 12.2 Market challenges
- 12.3 Impact of drivers and challenges
- Impact of drivers and challenges in 2023 and 2028
- 12.4 Market opportunities/restraints
13 Competitive Landscape
- 13.1 Overview
- 13.2 Competitive Landscape
- Overview on criticality of inputs and factors of differentiation
- 13.3 Landscape disruption
- Overview on factors of disruption
- 13.4 Industry risks
- Impact of key risks on business
14 Competitive Analysis
- 14.1 Companies profiled
- Companies covered
- 14.2 Company ranking index
- Company ranking index
- 14.3 Market positioning of companies
- Matrix on companies position and classification
- 14.4 Ameripharma Infusion Center
- Ameripharma Infusion Center - Overview
- Ameripharma Infusion Center - Product / Service
- Ameripharma Infusion Center - Key offerings
- SWOT
- 14.5 Arnot Health
- Arnot Health - Overview
- Arnot Health - Product / Service
- Arnot Health - Key offerings
- SWOT
- 14.6 Carson Tahoe Health
- Carson Tahoe Health - Overview
- Carson Tahoe Health - Product / Service
- Carson Tahoe Health - Key offerings
- SWOT
- 14.7 ChristianaCare
- ChristianaCare - Overview
- ChristianaCare - Product / Service
- ChristianaCare - Key offerings
- SWOT
- 14.8 Coram llc
- Coram llc - Overview
- Coram llc - Product / Service
- Coram llc - Key offerings
- SWOT
- 14.9 Haywood Regional Medical Center
- Haywood Regional Medical Center - Overview
- Haywood Regional Medical Center - Product / Service
- Haywood Regional Medical Center - Key offerings
- SWOT
- 14.10 Horizon Infusions
- Horizon Infusions - Overview
- Horizon Infusions - Product / Service
- Horizon Infusions - Key offerings
- SWOT
- 14.11 Icahn School of Medicine at Mount Sinai
- Icahn School of Medicine at Mount Sinai - Overview
- Icahn School of Medicine at Mount Sinai - Product / Service
- Icahn School of Medicine at Mount Sinai - Key offerings
- SWOT
- 14.12 Novant Health
- Novant Health - Overview
- Novant Health - Product / Service
- Novant Health - Key offerings
- SWOT
- 14.13 Palmetto Infusion
- Palmetto Infusion - Overview
- Palmetto Infusion - Product / Service
- Palmetto Infusion - Key offerings
- SWOT
- 14.14 Premier Point
- Premier Point - Overview
- Premier Point - Product / Service
- Premier Point - Key offerings
- SWOT
- 14.15 Stoughton Health
- Stoughton Health - Overview
- Stoughton Health - Product / Service
- Stoughton Health - Key offerings
- SWOT
- 14.16 Swedish Health Services
- Swedish Health Services - Overview
- Swedish Health Services - Product / Service
- Swedish Health Services - Key offerings
- SWOT
- 14.17 United Health Group Inc.
- United Health Group Inc. - Overview
- United Health Group Inc. - Business segments
- United Health Group Inc. - Key offerings
- United Health Group Inc. - Segment focus
- SWOT
- 14.18 Valley Health System
- Valley Health System - Overview
- Valley Health System - Product / Service
- Valley Health System - Key offerings
- SWOT
15 Appendix
- 15.1 Scope of the report
- 15.2 Inclusions and exclusions checklist
- Inclusions checklist
- Exclusions checklist
- 15.3 Currency conversion rates for US$
- Currency conversion rates for US$
- 15.4 Research methodology
- Research methodology
- 15.5 Data procurement
- Information sources
- 15.6 Data validation
- Data validation
- 15.7 Validation techniques employed for market sizing
- Validation techniques employed for market sizing
- 15.8 Data synthesis
- Data synthesis
- 15.9 360 degree market analysis
- 360 degree market analysis
- 15.10 List of abbreviations
- List of abbreviations

